I really am a big fan of Buffet, but not everything he is not doing is pure gambling.
Momentum is (after size) the biggest factor that can be used, even if buffet is not using momentum.
I try to be inspired by Buffet and a ton of others role models, but I try not to be influenced (total return was one of the biggest
inspirations for me, and “volatility is not risk”…).
The difference for me:
If you are inspired AND then think it trough by yourself (backtest it, think about it, reference it etc.) and only if it you believe then
its so good that it inmproves your trading you use it.
Influenced means for me that one takes it 1:1 without reflecting it and hoping that it saves you in the investing world.
if you have not it thought trough by yourself and YOU then think this it it, its fine.
Otherwise the next DD will get you out of the market, because its not the system “of you own beats”.
One needs to come up with his or hers own approach…
Thanks for posting those mkt-timing rules again. There are no rules that can protect one from a market correction. As you say, it also does not harm to look at the free weekly BCIp recession indicator, which stubbornly stays at or near 100.
Best, Georg
Whoops . . . my arithmetic was buggy. Looks like I’ve been spoiled by Excel.
Ouch. We can never ever ever ever ever ever ever ever justify doing anything just because “it give a better return,” especially if we know what we did was objectively wrong. That’s exactly why so many times we’ve seen magnificently tested models fail in real life, sometimes immediately and sometimes later on, after a run of pure luck ran out.
Andreas, interestingly, is operating on the edge of this sort of thing. We can use a bad thing if we have reason to assume it’s a widely replicated error in the marketplace and that enough money is moving on the basis of a specific idea (good, bad or indifferent) to produce exploitable market opportunities.
This is an area that really didn’t exist until fairly recently and came about through the combined emergence of concentration of trading power and the emergence of technological platforms and algorithms that are often driven by strategists long on math and programming but who may or may not know how to spell PE or EPS and think Warren Buffett is an all-you-can eat self-serve restaurant in a town called Warren.
It fits in the behavioral finance camp, I assume (or would argue if nobody else actually said it) and it can be a fascinating area for exploration, at least for a while (if all the techno quants were to suddenly study and apply sound principles of security analysis, the whole filed would vaporize). It might also been seen as a 21st century version of something like the old odd-lot indicator, where traders would assume that individuals, who are more likely to trade odd lots (not multiples of 100 shares) don’t know what they are doing and develop strategies that go against them. It’s also implicit in things I’ve seen form Robert Shiller and Fisher Black.
If you want to use a/b based on a belief in something along these lines, you could research it do enough tests of a/b formulations vs (a-b)/abs(b) formulations to see if these is something systemic there that’s worth pursuing. But have that intention.
But just trading a/b because one used in in backtests and it “worked;” no, no . . . that’s pure data mining and an invitation to trouble.
Again, you can do anything at all if you think it through and know why you’re doing it, and why it would or world not work. Even something like correlation between past and future; I’ve often ripped Yuval an new you-know-what for this sort of thing. But if you understand what and why you’re doing it, and thoughtfully monitor for indications that failure is becoming more probable, then it’s fine; trend-following technical analysts do this all the time, monitoring for divergences, changes in strength of trend, etc.
Bottom line:
Nothing is good if done naively and based on nothing more than backtests.
Anything can be good if done thoughtfully with understanding or what could make it work and what could make it fail.
The backtest is like an editor who tells you that you did or did not do a good job of translating . . . a manuscript from Russian to English, a strategy from human-speak to computer (p123 in this case)-speak, etc.
Sorry to be a little late to this discussion, but if you just use a minus sign instead of a slash you’ll probably get more meaningful results and you won’t have to be bedeviled by negative numbers twisting your results into 180-degree nonsense (as Marc so rightly points out). In general, when comparing a plain number to a previous number (e.g. EPS, sales, gross profit) to measure growth, the (a-b)/abs(b) formula is best. But when comparing a ratio to a previous ratio, a minus sign may be better.
Let’s take an example. Amazon’s operating margin improved from 4.99% to 5.33% over the last twelve months. Microsoft’s operating margin improved from 32.47% to 35.2%. Which is more significant? If you use the minus sign, Microsoft has a much more significant improvement (2.73% versus 0.34%); if you use (a-b)/abs(b), Amazon comes pretty close (Amazon 6.8% vs Microsoft 8.4%).
Well, the reason Microsoft’s improvement was almost 3% is that their sales increased by 15 billion and their operating income increased by 8 billion. And that is very impressive indeed. Amazon’s sales increased by 45 billion and their operating income increased by 3.6 billion. Which is not so impressive.
Now I personally believe that a huge growth in operating margin is not a good thing, but that’s a subject for a different discussion.
if the bench price is above its ema 75, but below its ema 200, there could be a buy signal and a sell signal at the same time. I do not know what the program does in this case. I would use the same ema for buy and sell rule.
The sistem before decide what to sell than what to buy, so if the stocks go down ema 200 is sold and can be purchased again only if it goes up on ema 75 (and the other rules satisfied).
can you show PLS the performance histogram of your RS since 2014 (or similar) and with a weekly rebalance? You use Uneverse =No OTC?
Do you use Percentile NAs Negative in your RS?
Fabio
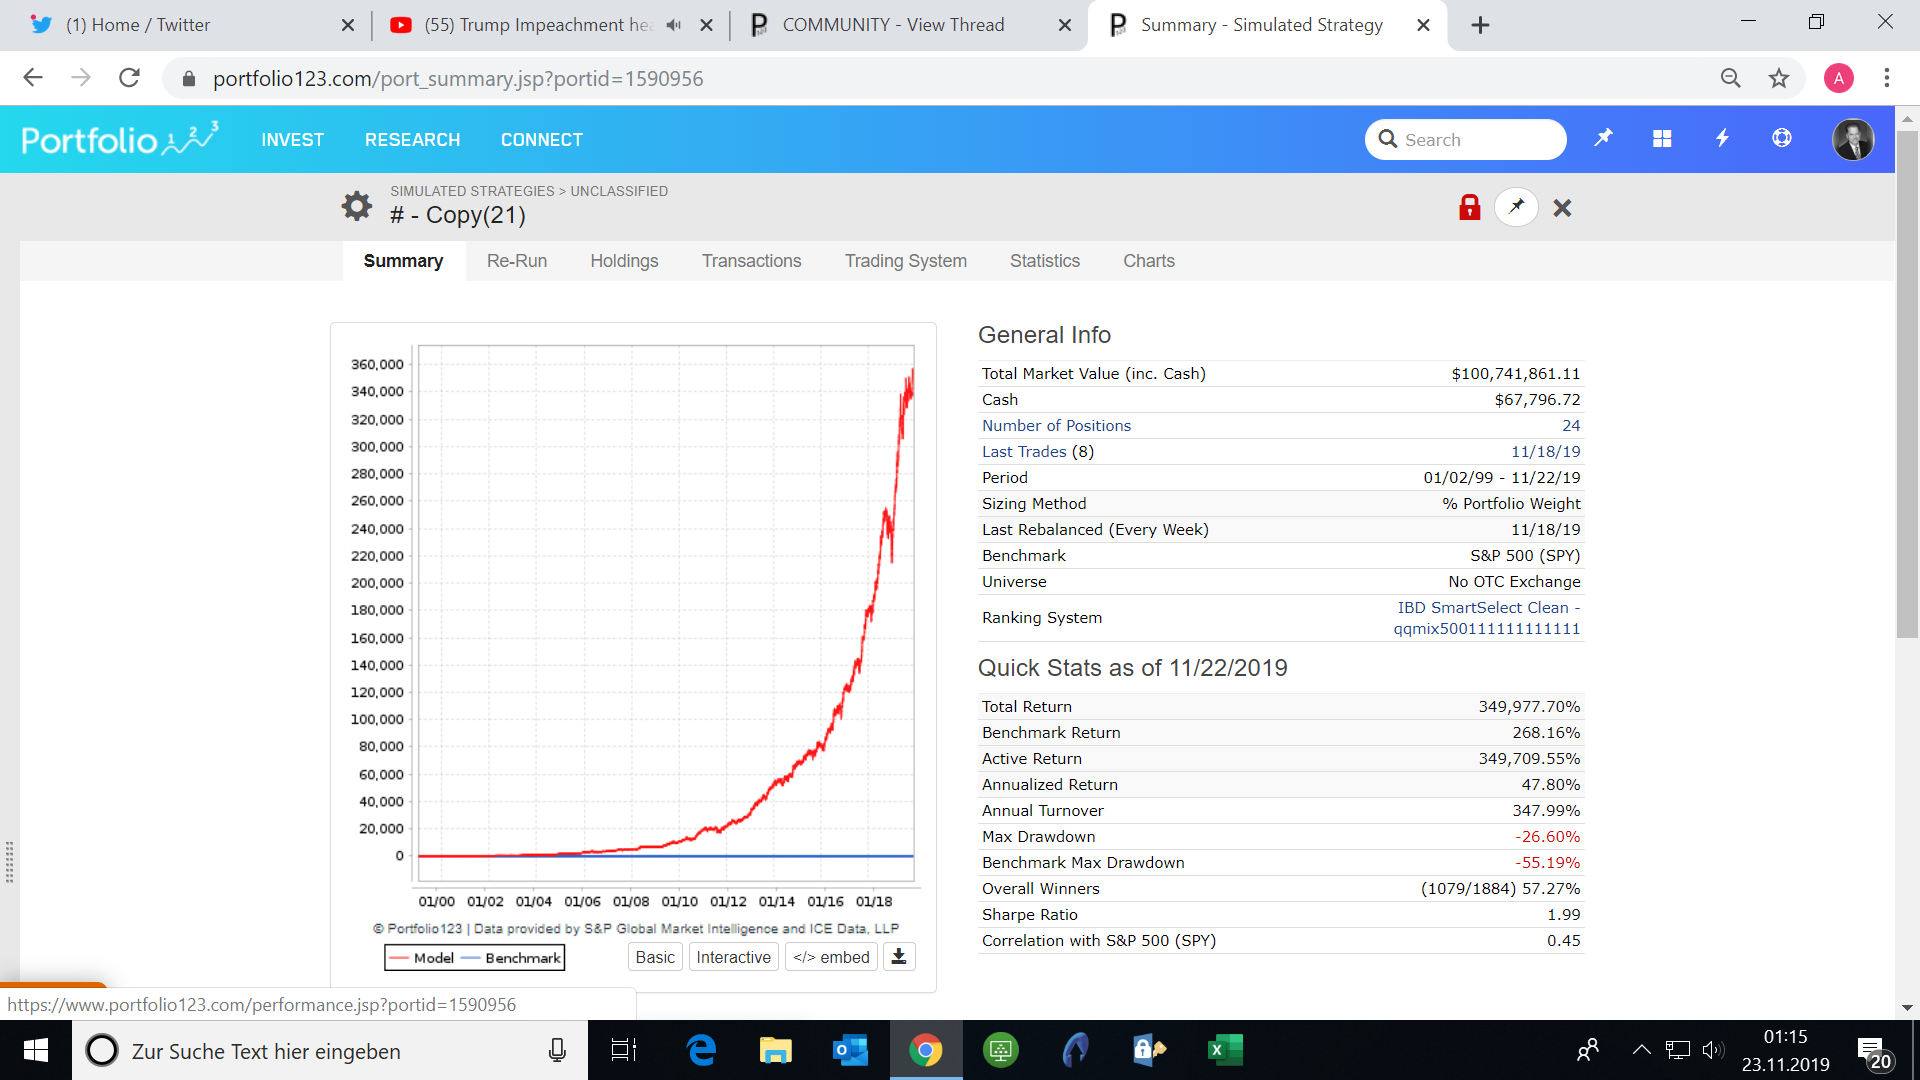
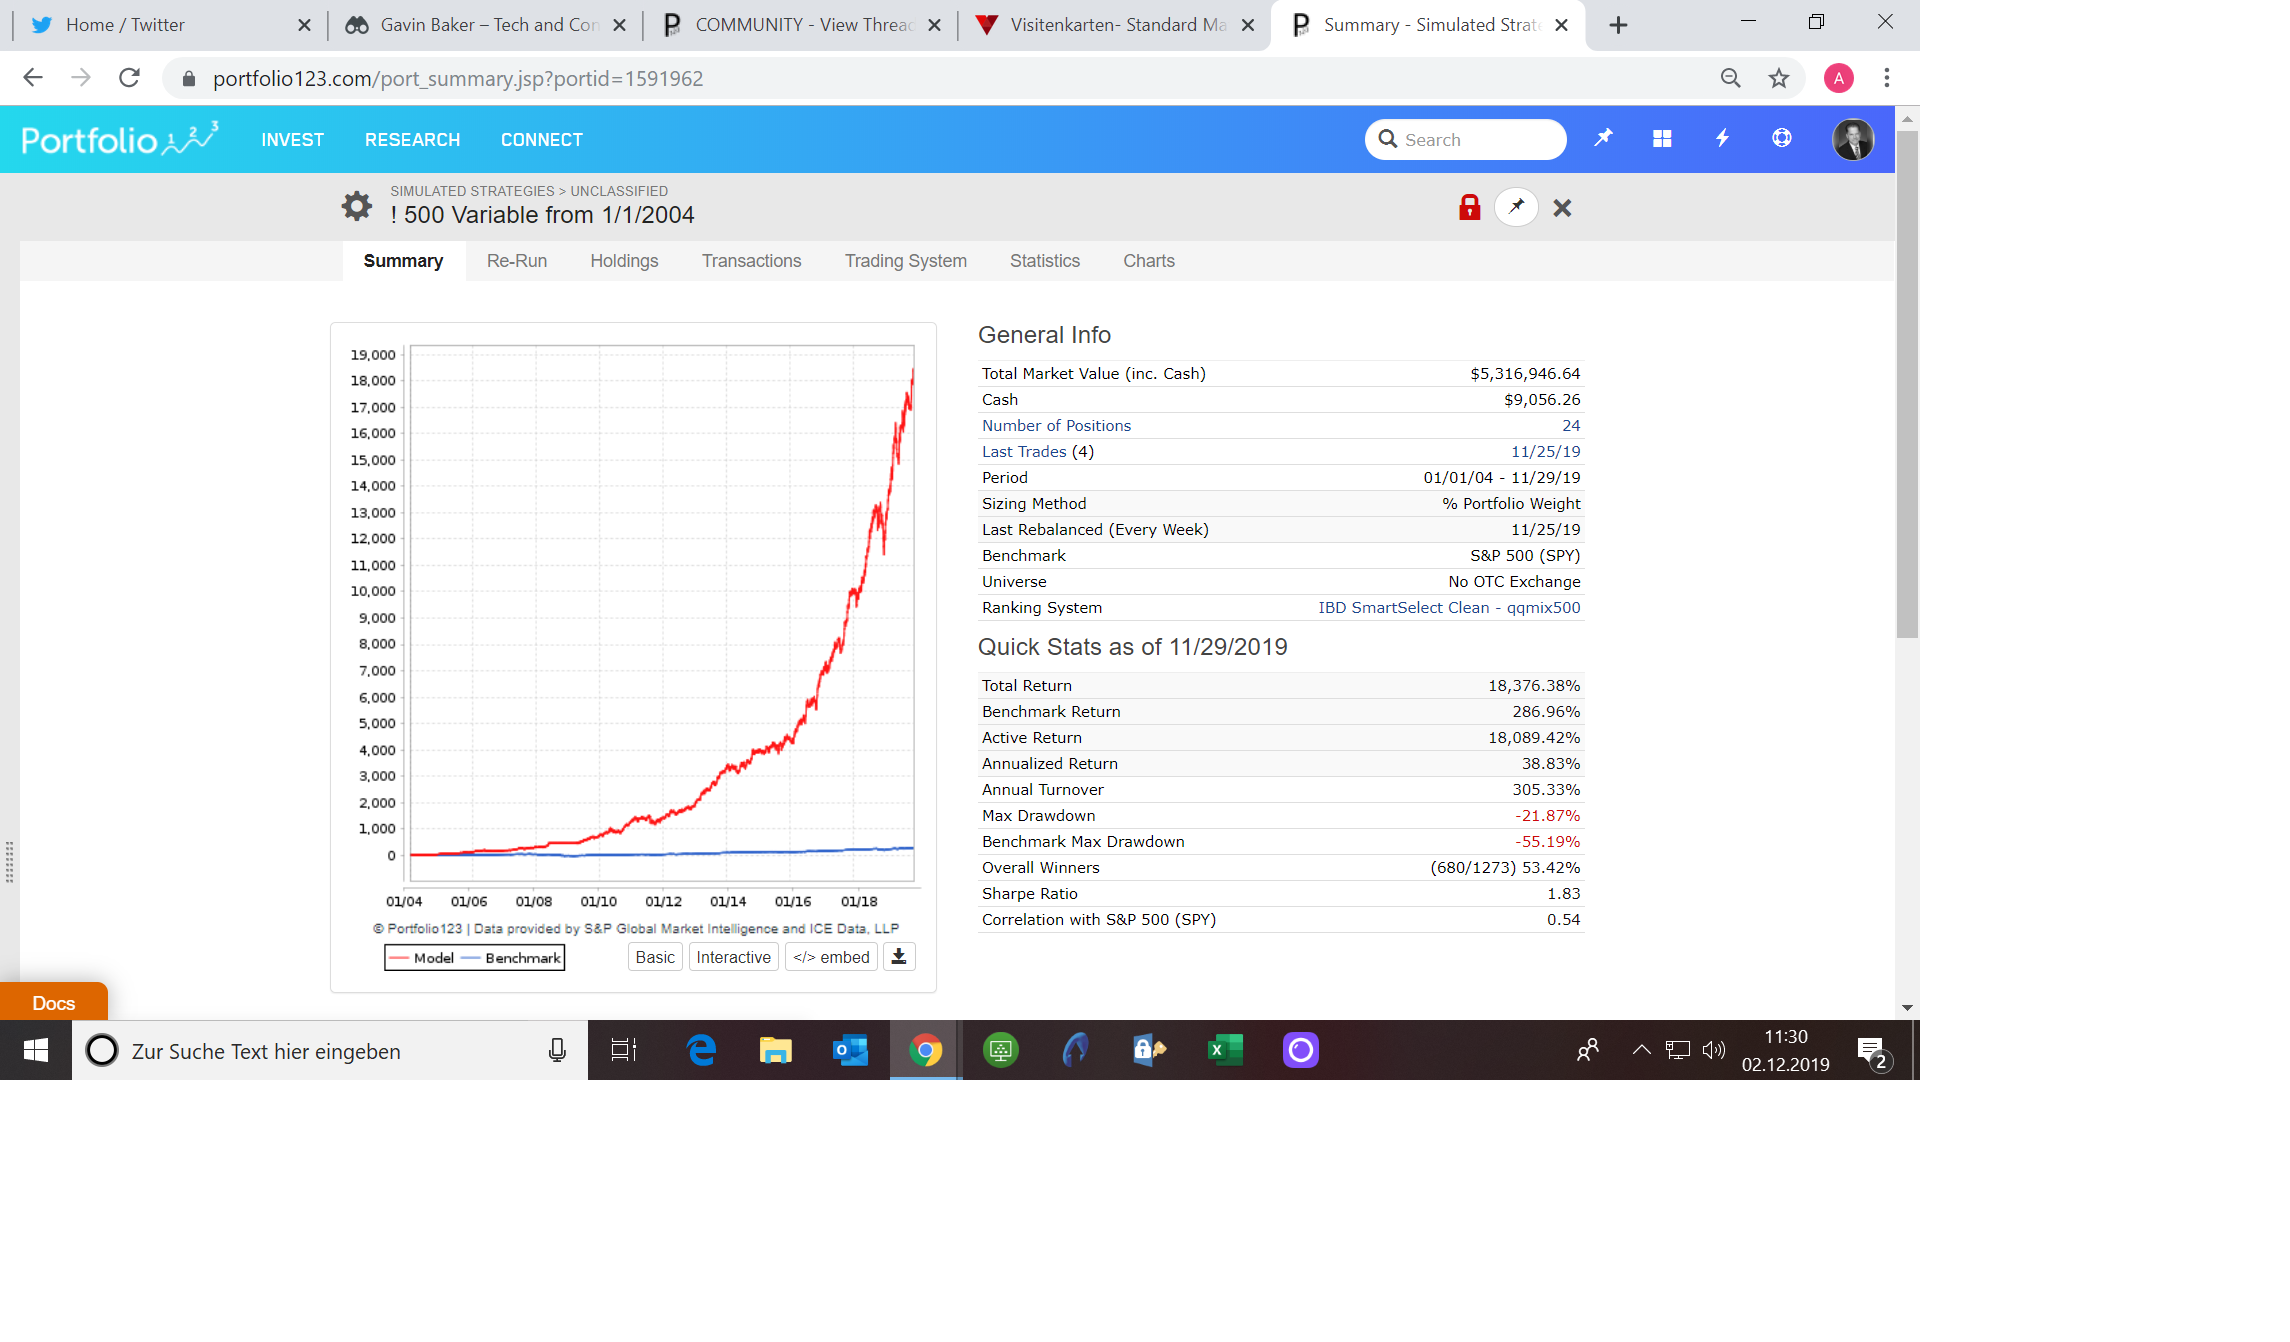
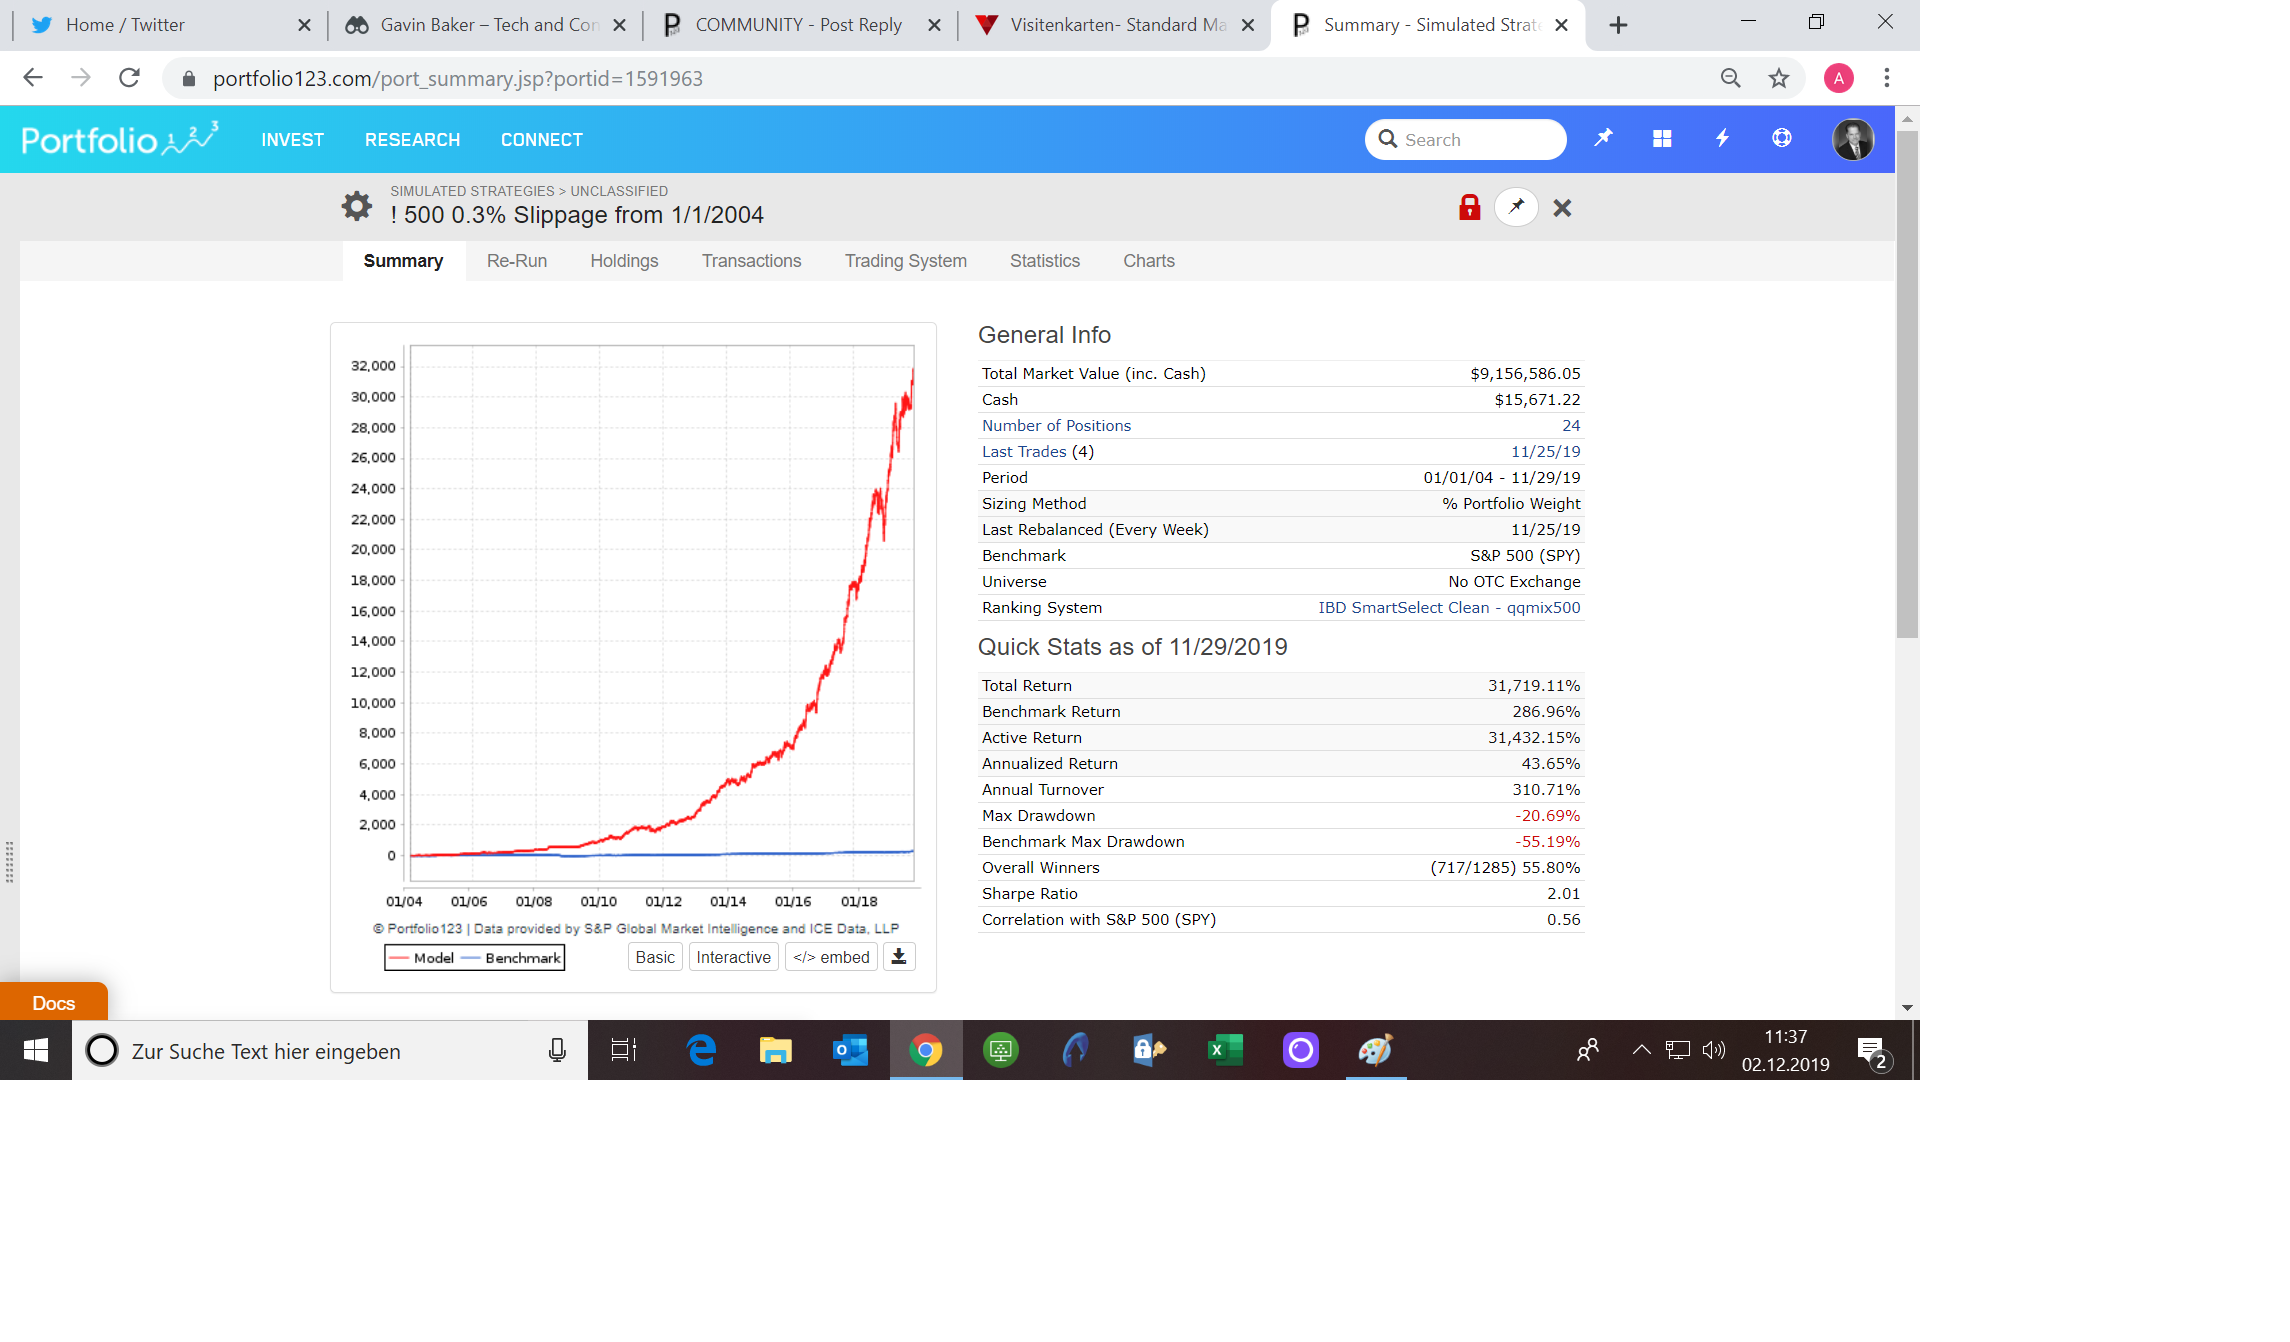
Andreas, can you please post performance curve for your small/micro-cap model starting 1/1/2004. Many of us have been restricted by P123 to a 15 year backtest period.
Thanks
Andreas,
Thanks for posting the performance from 2004 for your small/micro-cap model.
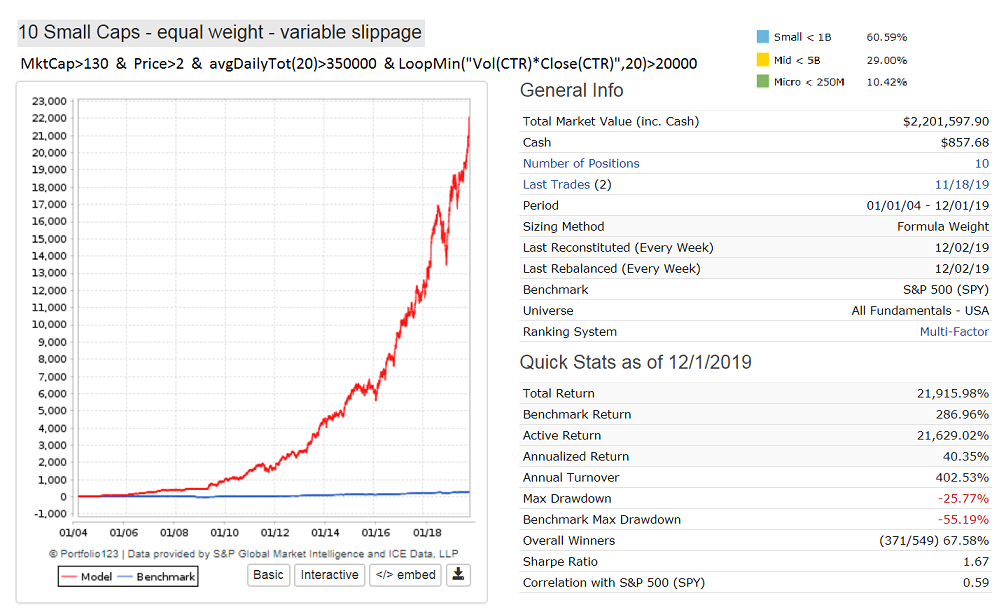
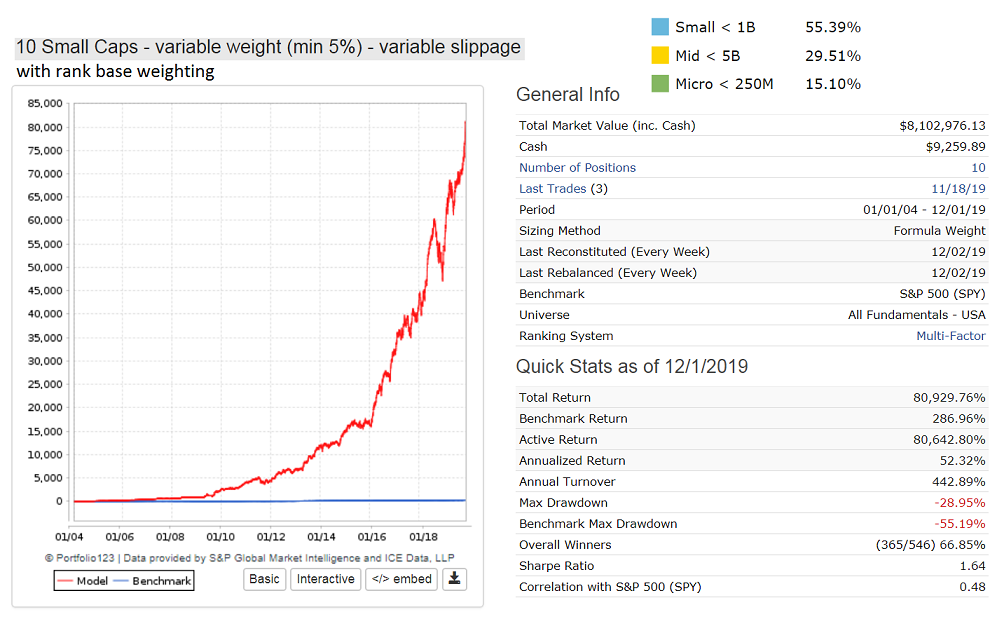
It is interesting that I can get a similar simulated performance and max drawdown with 10 positions and less micro-caps (10%). See liquidity filter rule on picture. Performance curve is very similar to your model.
Your 20+ position model’s holds about 40% micro- and 40% small-caps according to your QuantStrike post. Because of the many micro-caps your trading cost (variable slippage) are very high, 17.7% of ending market value as per your Nov-18 forum posting of the trade stats. For my 10-pos small-cap model, also with variable slippage, trading costs are only 8.0% of ending market value because MktCap of stocks is greater, and possibly also because of fewer trades, 549 vs 1273.
The annualized return can be increased from 40% to 52% with little reduction in Sharpe by using rank based weighting. Min weight is specified as 5% for this 10 position model. Reason for the increase in return is that the lower ranked stocks tend to perform worse, and therefor it is advantageous if they have less weight in the portfolio.
Andreas,
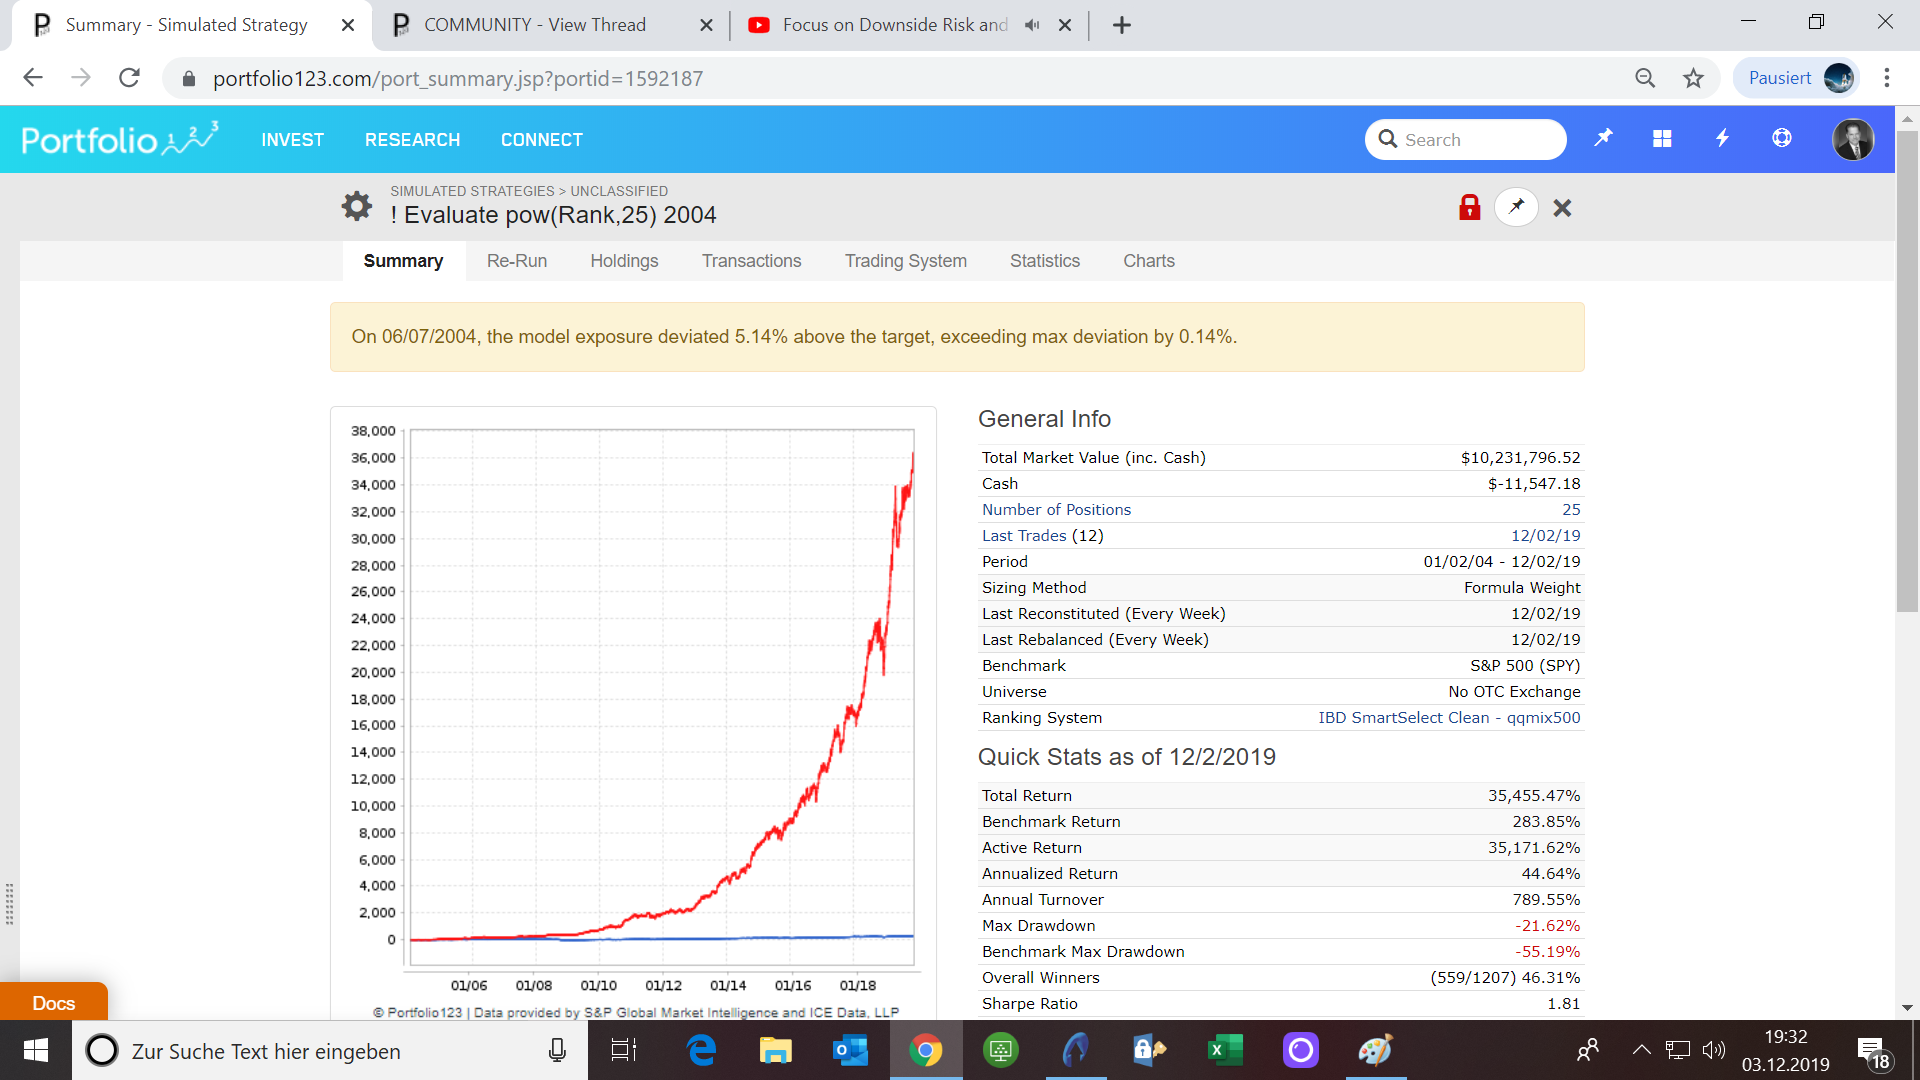
In the Rebalance module you need to use
Sizing Method= Formula Weight
and
Position Weight Formula= pow(Rank,xx)
Depending on your ranking system adjust the power to any number that works. In my case the higher the power, the higher the return. Should work for your model as well.
Also set Weight Constraints to a min value. For a 25 pos model the equal weight is 4%, so you don’t want to go much lower than 2% for your model. For my 10 pos model I set min weight to 6%, and max weight to 100%. Also you should adjust Transaction Control to reduce the number of small rebalancing transactions.
Let us know if you can improve return without lowering Sharpe too much.