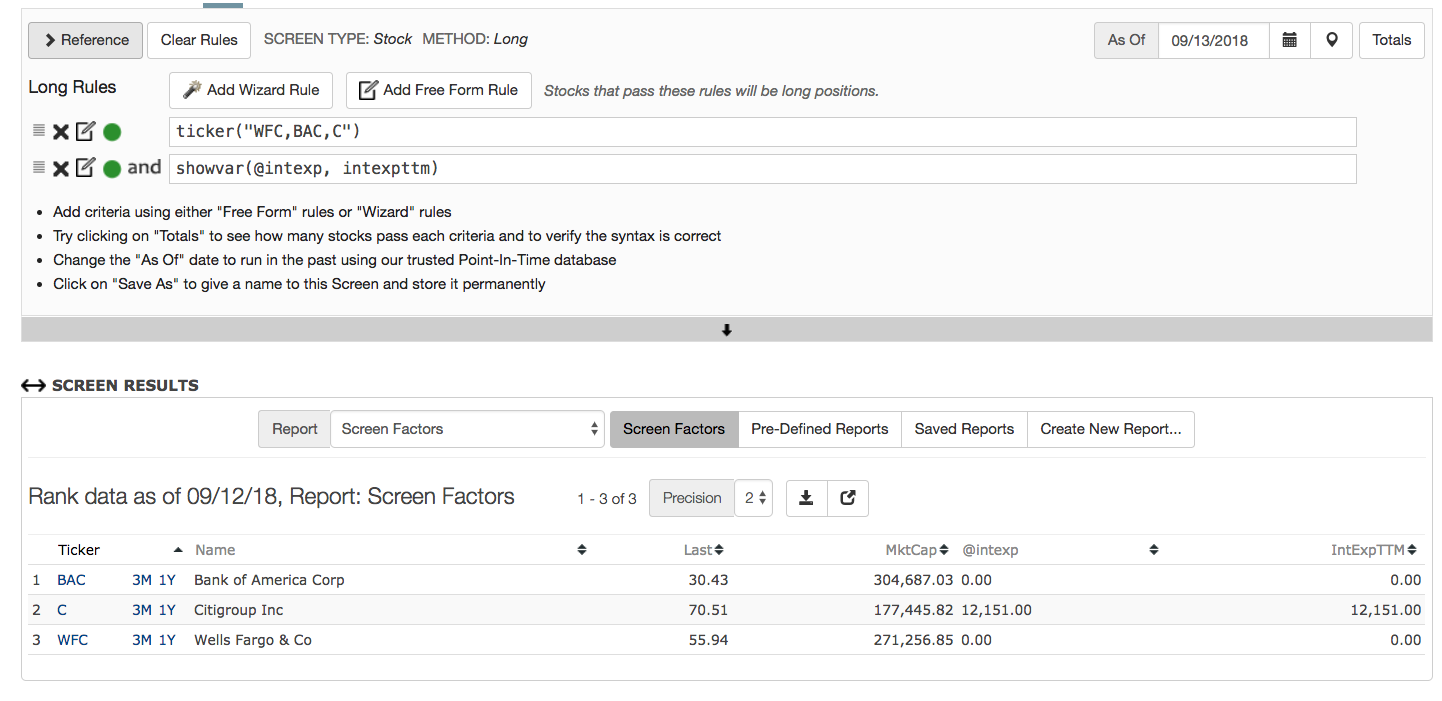
It seems “IntExp” is 0 for many large, well known banks according to the P123 data. Check out the screener output attached below, where it shows 0 interest expense for WFC and BAC.
These huge banks certainly have interest expenses.
Is this a data bug or a quirk in how Computstat classifies interest expense?
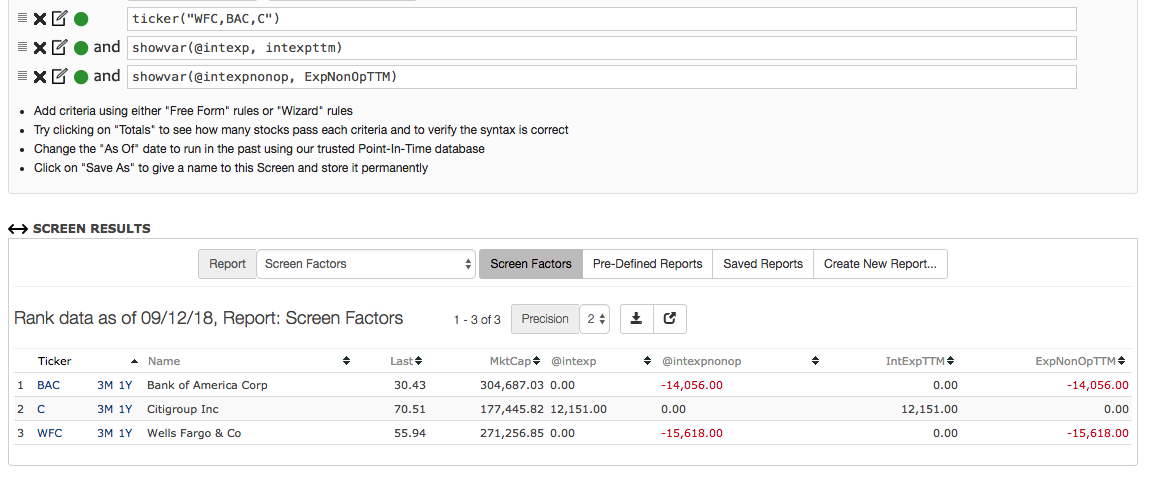
I haven’t compared to their actual reported sec financials, but looking through my bank ranking system, it looks like “ExpNonOp” field might be a place to look. I have a few calcs where I was working with expenses and tried variations with that field in combination with intexp. BAC and WFC have values the expnonop fields vs. 0 in the intexp field, whereas C has 0 in that field but has a value in the intexp field.
edit: see the description regarding the sign on the value for expnonop. A “negative” expnonop is an expense, so you have to reverse the sign in a calculation. if it’s positive it’s income.
It’s a combination of accounting quirks, CompuStat quirks and Portfolio123 quirks.
To begin, remember that just about everything that we’re reporting on Portfolio123 is from the consolidated statements. If you look at the CompuStat interest lines, there’s approximately one jillion of them, give or take scads. A fair number of them are specific to financial companies.
From Portfolio123’s perspective, that’s not good. We want things that are broadly comparable. This is further complicated by the fact that some financial companies, on their consolidated sheets, report net interest income. (BAC is one of them, and while WFC reports the line, they have more detail on their income statement.) This results in nulls where you’d expect interest income/expense subtotals to be.
So we want the line items that are most broadly applicable and can be expect to be present, CompuStat can be a little inconsistent across companies in their reporting of exactly what goes where, and the companies themselves are inconsistent in how they report this stuff. This means that for financial companies, the spot to look is actually quite broad: operating income. It also seems to include stuff like fee income and investment income, but the lion’s share of OpInc for both BAC and WFC seems to be interest income.
Compustat Banks used to be a separate db, but was merged. As a result, bank data taxonomies were forced into Compustat’s industrials taxonomy.
And as a result of this result, banks and financials data points in Compustat/Capital IQ differ significantly from banks’ standard financial reporting formats.
Some quirks include:
[]Current assets/liabilities are meaningless
[]Customer deposits are treated as liabilities (maps to Accounts Payable in Compustat/Capital IQ)
[]Loans are treated like assets (maps to Accounts Receivable in Compustat/Capital IQ)
[]PP&E is mostly meaningless (includes only office buildings); thus, DepAmort() is meaningless
[]CostG() → Total Interest Expense plus Provision for Loan Losses
[]ExpNonOp() → Depreciation and Amortization minus All Other Current Operating Expenses plus Non-Recurring Expense
[]InvestST() → Due from Banks plus Federal Funds Sold and Securities Purchased Under Agreements to Resell
[]IntExp() and IntInc() are not available (unless there is third party debt)
But knowing these things, we can begin to reconstruct some meaningful metrics for banks.
The upshot of these reporting policies is that it’s impossible to get at items that any bank analyst would consider essential. On the balance sheet, for example, analysts look at growth in loans and deposits, neither of which is available. On the income statement, they always look at the loan loss provision, since this can be quite volatile, distorting trends in profitability, and can also flag deteriorating asset quality. But the LLP is not available, and I don’t see a way to back into it. So I can’t calculate pretax pre-provision (PTPP) income to see the underlying business trend. Also note that most analysts think of a bank’s revenue as net interest income plus noninterest income. In Compustat, it’s interest income plus noninterest income, which is pretty much meaningless, since interest income fluctuates with the level of rates. Admittedly, this hasn’t been much of an issue recently, but it used to be and may be again.
One addition to the very helpful guide provided by primus: GrossProfit appears to be net interest income plus noninterest income minus the loan loss provision. I’ve found this mildly useful in my sub-model for financials.
I developed my financial sub-model on the Prussell 3000 excluding BDCs (which are no longer in the actual Russell indexes) and capital markets stocks (which are not balance-sheet businesses like other financials). I modified the valuation and profitability components of my main model, but left the other composite factors unchanged, because they appeared to work reasonably well.
In a 10-year weekly rolling backtest, with a six-month holding period, the top decile of my financial sub-model had an average excess return of 2.85% against the cap-weighted Prussell 3000. The excess return for my equal-weighted selection universe, under the same conditions, was -1.04%, so I see the effective excess return of the model’s top decile as 3.89% for six months, which I think is pretty good for the sector. In down markets, the effective excess return was 4.60%. That’s important to me, because valuation-focused strategies in financials can have very poor results in down markets.
Note that model development of this type would be much easier if we could specify the equal-weighted selection universe as the benchmark for backtests (as I argued in a recent Feature Request).
If I had access to the bank data I mentioned in my previous post, I would probably build an industry-specific screen to use in my fundamental review.