Can anyone explain to me why for InvtyChg, it is negative for increases and positive for decreases, but for RecvblChg, it is positive for increases and negative for decreases. This is defined in their Full Description of the formula. The RecvblChg description seems to be very inconsistent with all the other changes in working capital items. Is the description wrong or the formula wrong?
Also, how is OtherWCChg defined? Is it supposed to be negative for increases and positive for decreases or vice versa? It is not in the description.
It is very very confusing.
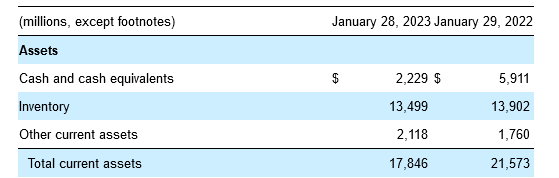
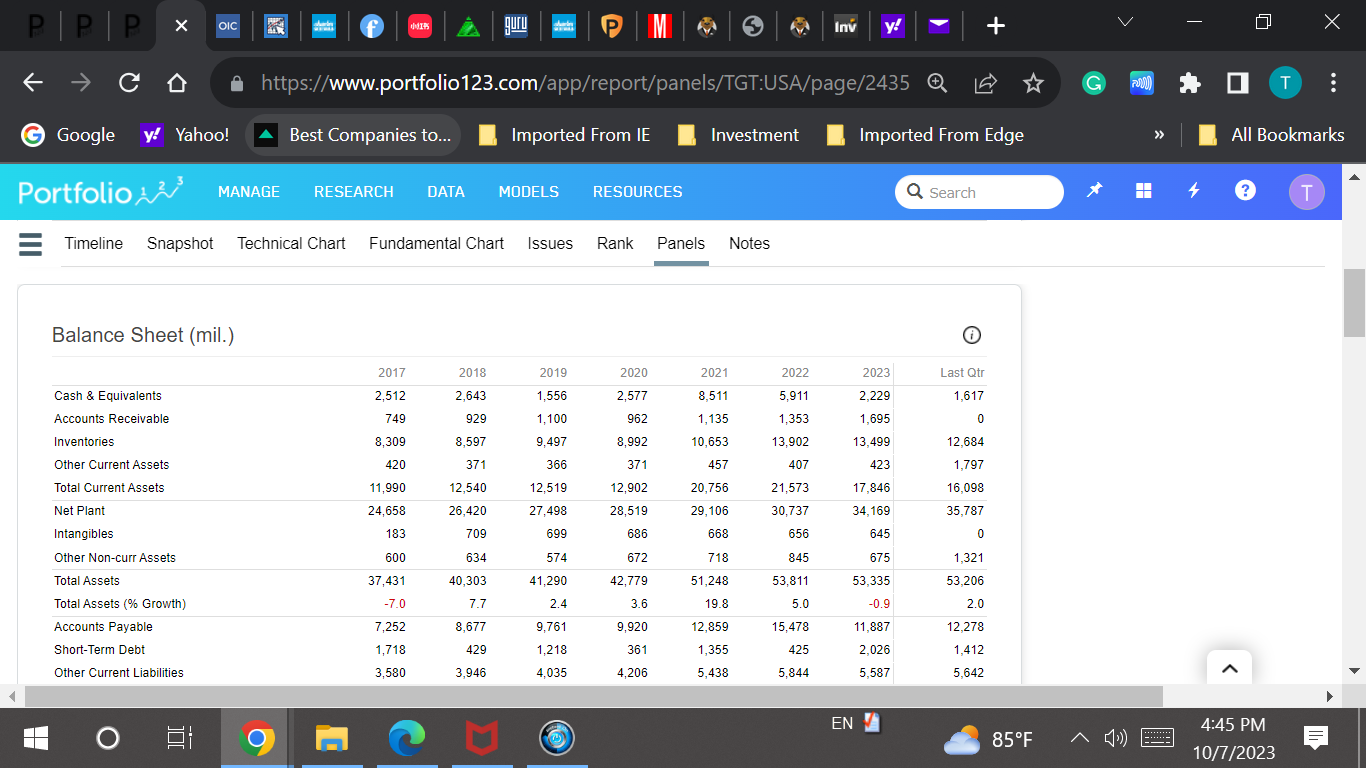
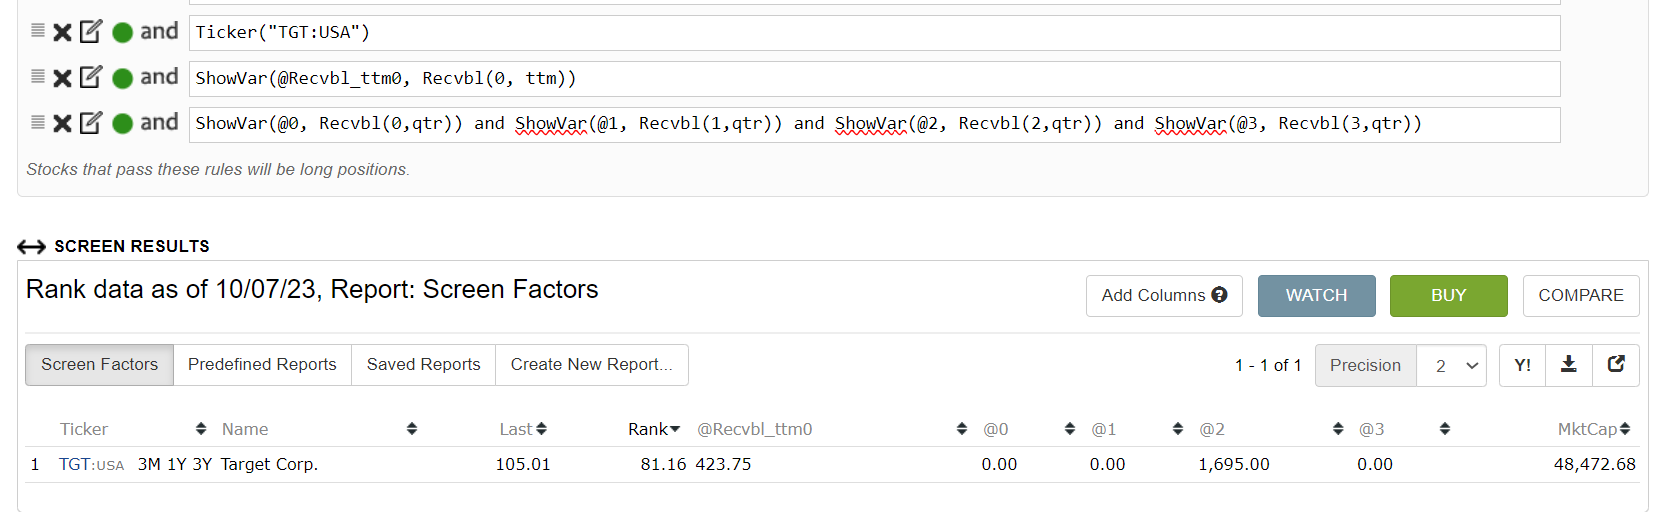
I also tried to test it out with TGT ticket symbol for Target, a very large company which should have its Financial Statements properly disclosed. Yet, the RecvblChg (0, ANN) showed NA when clearly there is a change in Accounts Receivable between 2022 and 2023. Furthermore, the InvtyChg does not remotely come close to the change in Inventory between 2022 and 2023 on the TGT’s Annual Report.
I am beginning to lose my confidence in the numbers that Portflio123 produces for us to rely on for any investment decision-making. How about you?
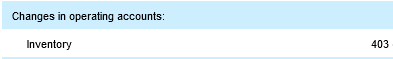
Conventional accounting practices always count inventory changes as positive when inventory decreases, and inventory changes as negative when they increase. Target is a good case in point: its inventory was 13,902 million last fiscal year and 13,499 million this fiscal year, so the inventory change is positive 403 million.
FactSet defines ff_wkcap_chg (OtherWCChg) as follows:
Represents the total change in working capital due to increase or decrease in assets, liabilities, and other adjustments to working capital.
It includes:
Increase/decrease in Accounts Payable
Increase/decrease in Income Taxes Payable
Increase/decrease in Other Accruals
Increase/decrease in Receivables
Increase/decrease in Inventory
Increase/decrease in Net Change in Other Assets & Liabilities
I hope this answers your questions. If not, please feel free to follow up.
Sorry, you are right about the 2022-2023 Annual InvtyChg. I forgot to change TTM to ANN.
But I don’t understand why 2022-2023 Annual RecvblChg of TGT is NA when there is clearly numbers for both years on the TGT’s Annual Report?
I also do not understand why an Increase in Accounts Receivable represents a positive cash flow on the Cash Flow Statement. I don’t think the books would balance if one treats it that way. Can you explain further what you mean?
In the Standard & Poor’s Compustat® User’s Guide, it clearly states that a Decrease in A/R is a positive increase to cash flow and an Increase in A/R is Negative and will decrease the cash flow. Why would Portfolio123 defines it in the opposite manner?
My earlier reply was incorrect. An increase in Accts Receivable is negative in the cash flow statement, so RecvblPY - RecvblA = RecvblChgA. I apologize for the error: I misread a couple of statements. I deleted the mistake in my earlier post.
And now I have to go back to my initial question which is according to Portfolio123’s definition, why for InvtyChg, it is negative for increases and positive for decreases, but for RecvblChg, it is positive for increases and negative for decreases. This is defined in their Full Description of the formula. Is the Full Description wrong or is the formula wrong, or may be both are wrong?
In the case of TGT, the A/R balance is definitely wrong and should be 0 in both 2022 and 2023 according to the TGT’s Annual Report. Now I have to wonder how many other company’s A/R balances are wrong as well. Furthermore, that will affect all the ratios calculated using A/R balances. That’s my concern. (I did check Walmart, and
their A/R balance is properly picked up by Portfolio123, but the RecvbleChg is not the difference between the 2 years. So now I am wondering what is the proper formula for RecvbleChg.)
I can only assume that FactSet calculates the receivables from other items in the balance sheet or elsewhere in the financial statements. Both FactSet and Compustat give accounts receivables numbers for Target but not the cash flow statement’s change in accounts receivable. I can’t really tell you why. On other websites (Seeking Alpha, Fidelity), the same is the case: the balance sheet shows the receivables but the cash flow statement does not.
Here is FactSet’s calculation of the change in accounts receivables on the cash flow statement:
For Banks
Represents the change in working capital due to increase or decrease in outstanding balance due from customers or any purchases made on credit other than loans and advances.
It includes:
Net change in allowance for doubtful accounts
Net change in tax receivables
Net change in receivables and prepayments, when combined and cannot be separated
For Commercial, Insurance and Other Financial Companies
Represents change in working capital due to increase or decrease in receivables for the given period.
It includes:
Net change from claims
Change in accounts receivable and accrued income combined
Increase /decrease in receivables and prepayments combined
Decrease (increase) in tax refund receivables
As you can see, it’s not so simple as just comparing the figures in the balance sheet.
Our documentation for RecvblChg appears to be incorrect. I will fix it soon. Thanks for bringing it to our attention.
Please also @yuvaltaylor check this situation with TGT:USA, how ttm figures are calculated when when qtr numbers are missing/zeros. An average for ttm includes also zeros which I believe does not make sense. P123 would need to distinguish if the zero is a missing value or it is a real zero.
The documentation for RecvblChg has been corrected. We are considering what, if anything, to do about quarterly zeros and TTM figures for balance sheet items.
Below is what the data looks like for Recvbl for TGT straight out of the FactSet database
As you can see starting in Q2 of 2013 they began reporting it once a year. Not sure what the 2013-10-31 value of 76 is, looks like an error. Also not sure why TGT Recvbl were much higher before 2013.
In any case our TTM formula does an average, and since 0 is a valid number (not N/A), we end up with a RecvblTTM that is 1/4 of the annual value. In addition RecvblQ is only right 1 out of 4 quarters
If TTM is what you need here’s a work-around until we figure out the best way to handle these
The above will return the annual value if there are exactly three 0’s in the interim values. This will obviously not work very well during the transition TGT did to reporting once a year.
We also need to investigate if there are other balance sheet line items that behave like this. (pretty much sure there are)
Thank You
PS. there are around 50 companies in the US All Listed Stocks universe that have this Recvbl problem.
Yep, many other balance sheet items behave like this. Only around 50 stocks are affected for a particular date (give or take depending on the line item). For these, the TTM and Q are basically unusable , only annuals ok to use.
Around 50% of the balance sheet items are affected. It affects all regions. We’ll investigate further and come up with a fix.