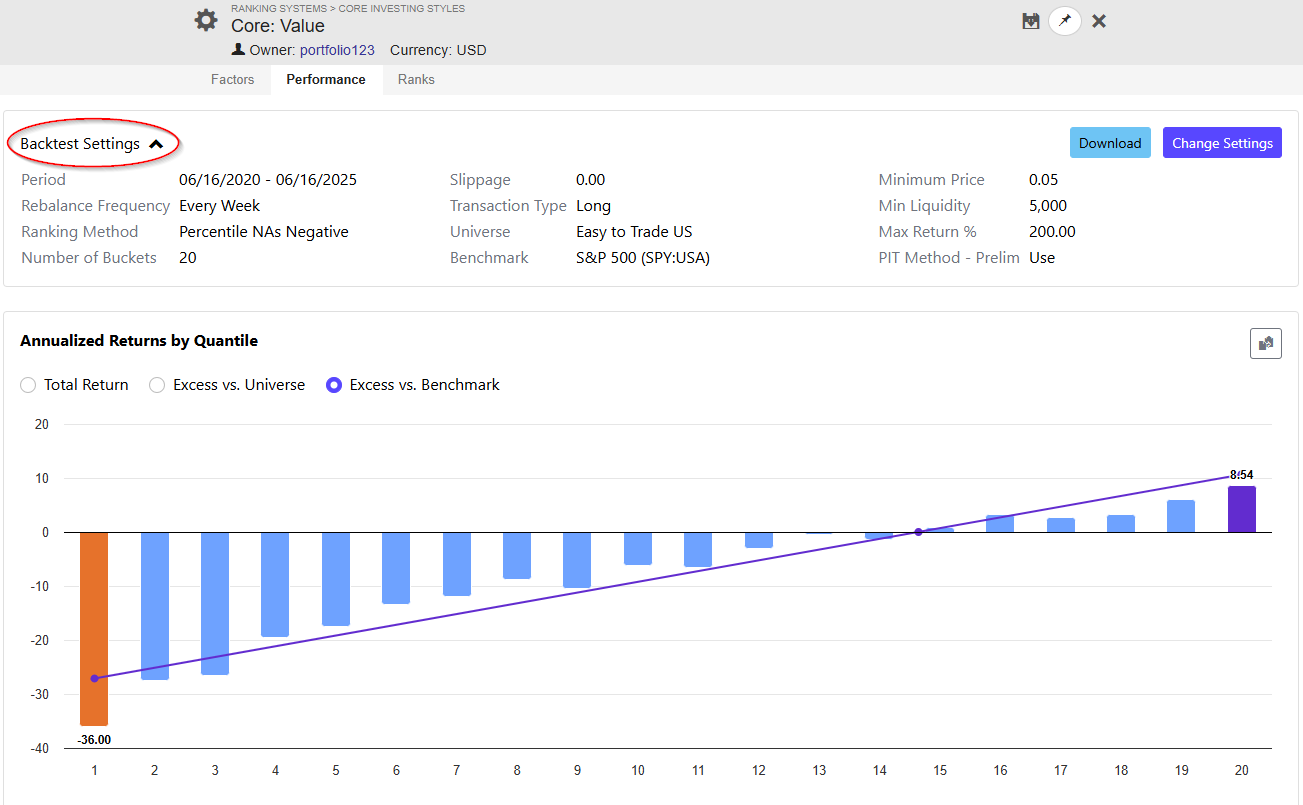
I know this is a dumb question, but very new to portfolio123 and all the old tutorial videos have a graphic more like this. With the lowest bucket on the left hand side. And the highest ranking stocks on the right hand side. Now all I see are bucket numbers. Which is which?
Bucket 1 contains the lowest-ranked stocks
So this was a test of Core-Value if I recall. Is this saying that the worst values stocks did better?
Just make sure your factor ranking is set to 'Higher values'. If that's the case, then yes