I tried looking over some of the Designer Models, to see how they had done in real life vs simulation. Unfortunately, only a few publish the results of the simulation.
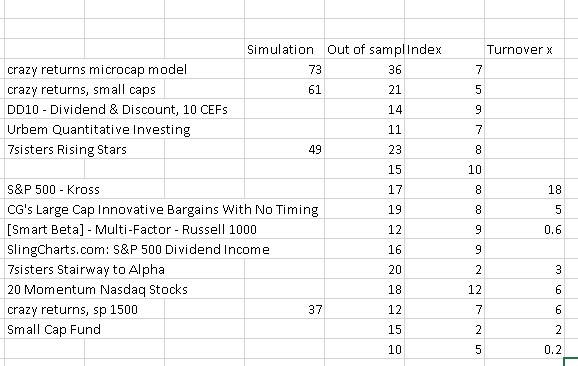
I sorted them by the ones that had done the best in the last three years, high sharp ratio and publication date. These are the models I looked at:
What I note is that very few do much better than the index, with some exceptions, and most seem to achieve up to half of what followed from the backtest.
Is this the experience of most of us, that we have to reckon with around half?
Is it an idea that in DM, the seller must provide more information about the simulation, such as is done by Yuval Taylor and Seven Sisters? Or that more information is provided than that in the Simulation tab.
I think a degradation of about 50% of alpha (not of absolute performance) is to be expected going from simulation to live. This can vary a great deal depending on how optimized the backtesting is. If it’s barely optimized, the degradation should be slight; if it’s truly overoptimized, the degradation can be a lot greater than 100% (i.e. a strong backtest will underperform the benchmark out of sample). Because simulated results can be extremely misleading, it’s not necessarily in anyone’s best interest to specify them. A model is better judged on out-of-sample performance, on the designer’s track record, and, if available, what factors the designer is using.
Here’s a quote from “Is There a Replication Crisis in Finance?” by Jensen, Kelly, and Pedersen, a paper I wrote about here:
Post-publication performance. McLean and Pontiff (2016) find that US factor returns
“are 26% lower out-of-sample and 58% lower post-publication.”8 Our Bayesian framework
shows that, given a prior belief of zero alpha but an OLS alpha (ˆα) that is positive, then
our posterior belief about alpha lies somewhere between zero and ˆα. Hence, a positive
but attenuated post-publication alpha is the expected outcome based on Bayesian learning,
rather than a sign of non-reproducibility. Further, when comparing factors cross-sectionally,
the prediction of the Bayesian framework is that higher pre-publication alphas, if real, should
be associated with higher post-publication alphas on average. And that is what we find. We
present new and significant cross-sectional evidence that factors with higher in-sample alpha
generally have higher out-of-sample alpha. The attenuation in the data is somewhat stronger
than predicted by our Bayesian model. We conclude that factor research demonstrates
external validity in the time series, but there appears to be some decay of the strongest
factors that could be due to arbitrage or data mining.9
Thank you for the link and quote from the paper. The paper covers several topics of interest, I think.
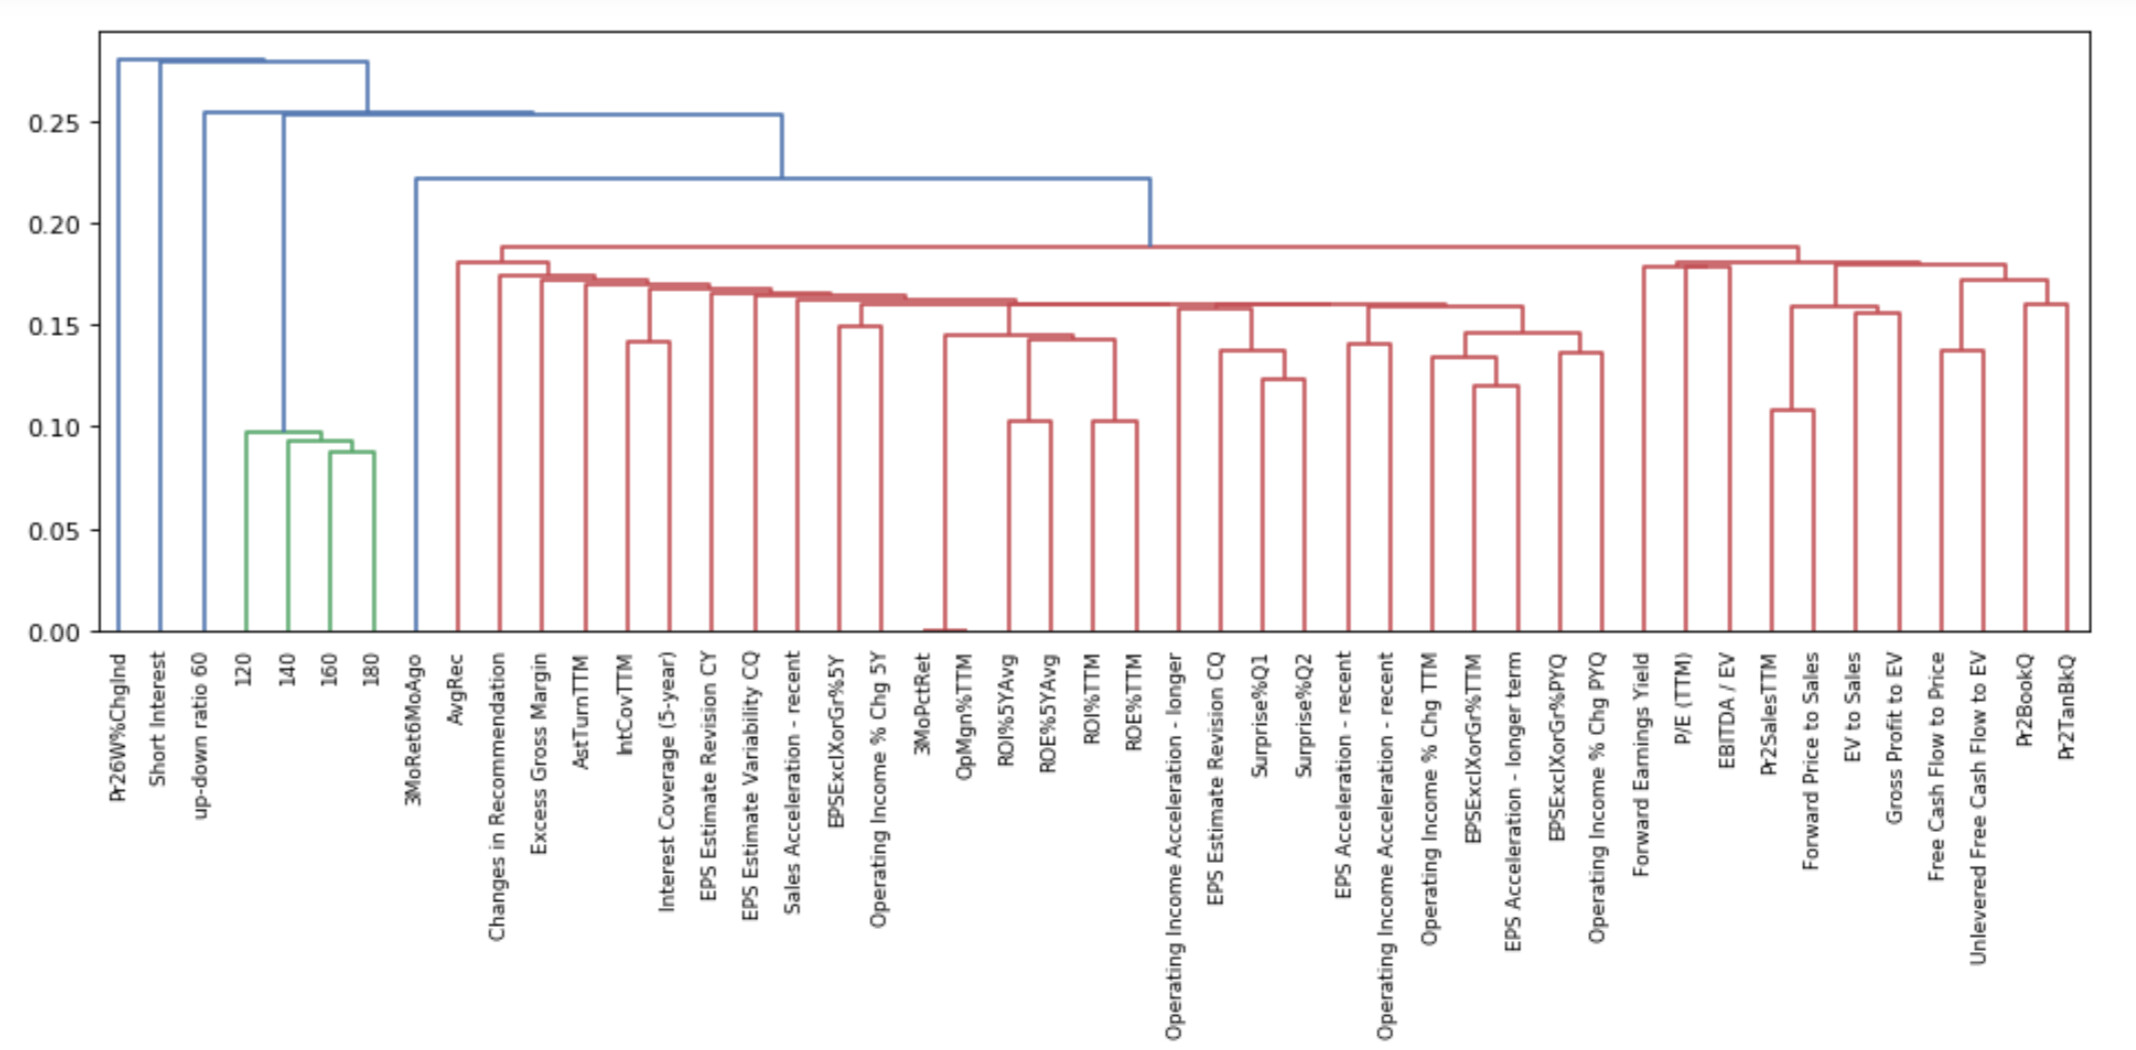
I am sure you notice the paper discussed clustering of factors. I happened to be doing a little clustering of the factors in the Core P123 Ranking system when I read the paper.
This data is raw, uncorrected and unfinished. I do not know if this was something you found interesting in the paper but I thought I would screenshot the dendrogram and share it before I closed the Jupyter Notebook. I think the names of the factors are the same as those used in the P123 Ranking system and perhaps you can make them out in this screenshot. As you can see (I hope), it did cluster all of the value factors at the right–along with “forward earnings yield.” There are some other grouping that seem to make sense whether one would call them a cluster or not:
Fascinating work, Jim. Thanks for sharing. (Forward earnings yield is a value factor.) How did you go about doing the clustering? It seems like you did a better job than the paper’s authors.
I used P123’s Core Combined ranking system with one factor turned on at a time in the screener. I used the Easy to trade US Universe without modification. I arbitrarily chose 100 stocks in the screener. I ran the screen and downloaded the daily pricing data and entered it into an Excel csv file. I kept the date on the first download as the index and named the column head. Repeated this with the next factor until I had the initial set of factors above.
This data is only up until the end of 2014. I then uploaded the file into a Python program. Scikit-learn has a good one that is open-source. The above is from PyPortfolioOpt which I think just uses Scikit-learn’s hierarchical clustering program (or its code) within their program.
I just started with this yesterday. But I think there may be more functionality in the Scikit-learn version for any P123 members looking to use a program. For an example of functionality, I think Scikit-learn program could be tweaked such that value factors have their own color making it more obvious that they form a cluster with the Scikit-learn program. There is other functionality (with more control of the defaults) in the Scikit-learn program. I have not used it yet.
Also, Scikit-learn has been around for a while and will support its program into the future. I had problems with compatibility of the latest version of numpy with PyPortfolioOpt for anyone trying to use (or troubleshoot) this program.
Here is the specific link to hierarchical clustering: Hierarchical clustering. Everyone always talks about “Ward” linkage being so great while "single’ linkage always seems to perform better in the papers.
I think the above data uses “single linkage.” As you probably know, hierarchical clustering uses correlation distance data and does not directly use the correlations to form the clusters. That can be done in a few different ways and that is what this is referring to.
BTW, I agree that correlation with other factors should not prevent one from adding a factor to a ranking system. I am only interested in how the correlation information can be used once a factor is added. Thank you for your post on that subject (in another thread).
I know you have posted about using correlation data previously. Can you expand on how you use correlation data?
Also Korr, you have asked/suggested that P123 use the covariance matrix. I wonder how you use that data or how you think it could be used.
At the moment I'm not using any correlation data in my day-to-day investing process. I use correlation data primarily for determining goodness-of-fit for regressions. For example, if I'm trying to come up with a formula for transaction cost and I'm taking into account volatility, amount traded divided by median daily dollar volume, and spread as a percentage of price, I'll see which of those correlates best with the observed trading cost (and in this case I'd use rank correlation) and perhaps weight the factors accordingly. As far as using correlation data for clustering, that interests me both for factor grouping and for industry grouping, and your suggestions will no doubt be helpful if I go down either of those roads.
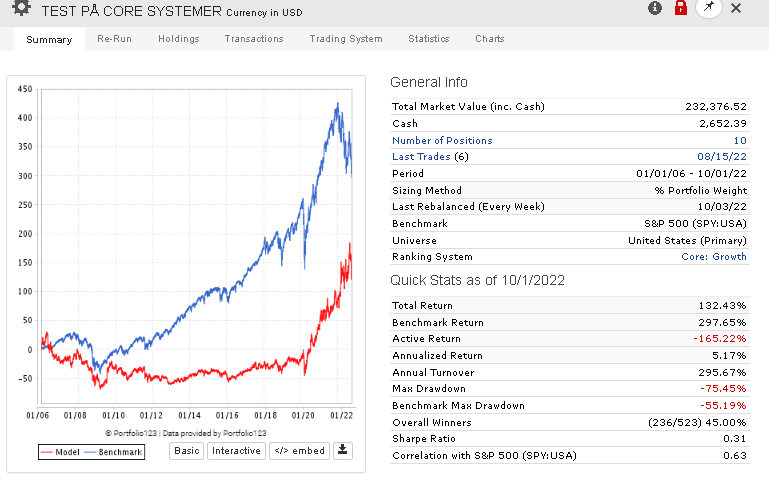
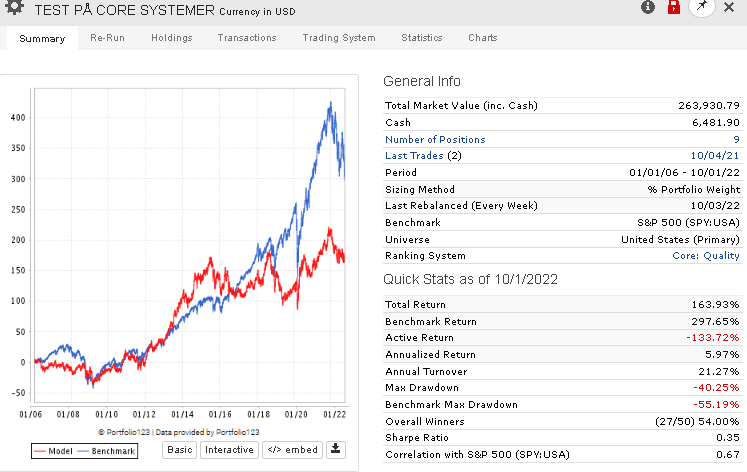
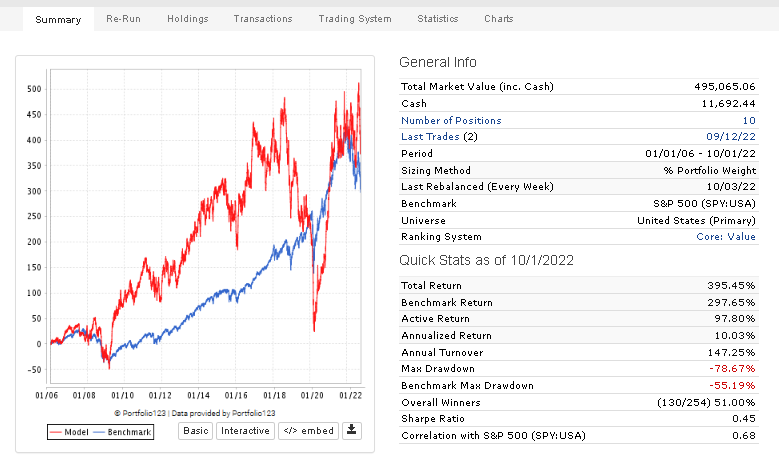
Based on the conversation above, and the gap that are between a backtest and out of sample, is it time for the Core systems to be updated?
I think all of them have such low returns against most universes, that a deviation in out-of-sample indicates that they should hardly be used in a live trading system.
All the knowledge that the thread above shows, and generally in the forum, indicates that there is a good basis for creating new good core systems, which us who still are beginners at this, can start with.
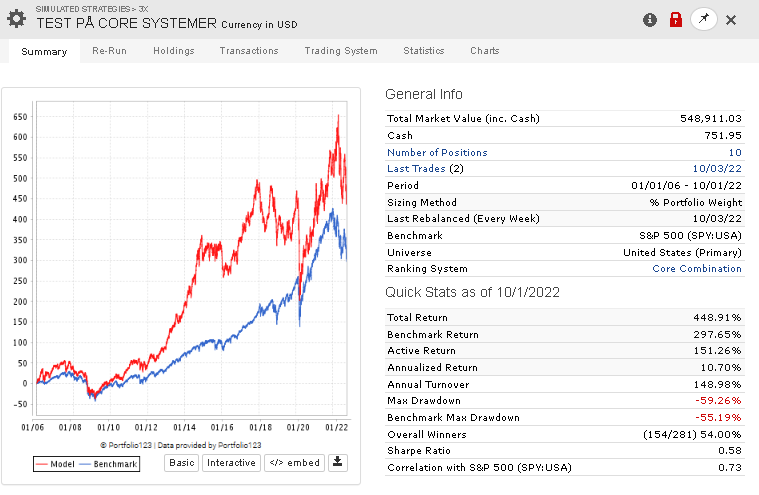
Under is a raw test on a large universe with a price and volume control rule.
Could you explain more of what your first post is saying, especially the table? I assume (<- dangerous word) that the list on the left are names of the different Designer Models. But here are some questions:
(1) What are the numbers in the columns “Simulation” and “Out of Sample” mean? Are those CAGR in percent? Number of months in the simulation and out-of-sample period?
(2) What do the numbers in the column labeled “Index” mean?
(3) What do the numbers for “Out of sample” and “Index” represent for the blank entry between “7sisters Rising Stars” and “S&P 500 - Kross” ?
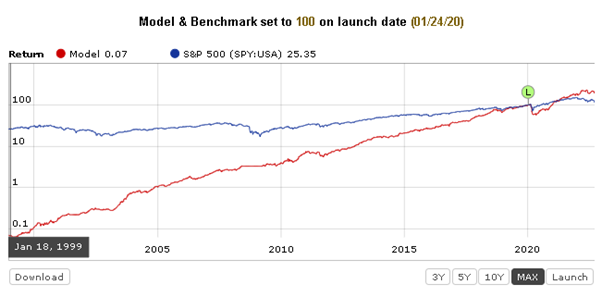
As for your second post, what you show is what I discovered when I first joined P123, that, with the exception of Core:Sentiment", the core systems didn’t produce returns better than the S&P500. But after discussions on this forum, I learned that the Core systems are not meant to used as-is for investing, but instead are simply starting points for newbies like me to use as a guide. Is that how the P123 owners / developers see it?
Yes. Nobody here would ever recommend using only one or two of the core systems for investing. The core combination, however, is a different case. It actually works as is in Europe, and it used to work well in the US too. I wrote about this here.
To questions 1 and 2: This is the percent return (GAGC) in the simulation, and then out of sample return for the portfolio and return on the benchmark index.
To question number 3: the problem with these two strategies is, and others, is that there is no information given about the return of the simulation. It is therefore not possible to see how the strategy has done out of sample vs simulation.
To the last, yes I agree. I also discovered reasonably quickly that the core systems weren’t working, but they have in the past. I think it would help a lot of new members if they got a better system to start with. I’ve also read a number of posts where it’s clear that people gave up p123 at times, before coming back. So my hypothesis is that the knowledge here, is more than enough to maintain some core systems, so that frustration is less for new members. And why not? It’s a selling argument in itself that you get excess to some base systems that at least work in a backtest. Look at Zacks, Alphascore and the systems Quantitative Research Providers - Investars Ranks
I do also agree with Yuval, I had also never used a single system, but have a multifactor approach.
I recently used the factors in the Core Combined system as a broad range of factors without any selection bias—at least no selection bias on my part.
No selection bias and no recency bias: you did not develop the factors a super-long time ago but it wasn’t yesterday either. And it serves as a control: a comparison of the algorithm I wanted to try to a more equal weighting of the factors.
I used your factors to try to develop an algorithm for selecting and weighting factors using data up until 2014 and then looking at the out-of-sample results (2015 until now).
The Core Combined ranking system serves as a good range of factors for this purpose. And it is a good example of the type of factors someone new to P123 could use and develop further.
Anyway, I found the Core Combined system useful recently.
Also I read your blog on the subject. You said people can improve on the Core Combined system by adding new factors. I would simply add that algorithms to determine which factors to use and how to weight the factors that one decides to use can work too (based on my little study). I am not sure that I agree that one has to develop a lot of unique or esoteric factors to be successful at P123 (a good thing I think).
That is all to say the I have found the Core Combined Ranking system useful recently. Thank you for making it available.