James, I think you had a special interest in pairs trading. But the course also goes into detail about momentum trading.
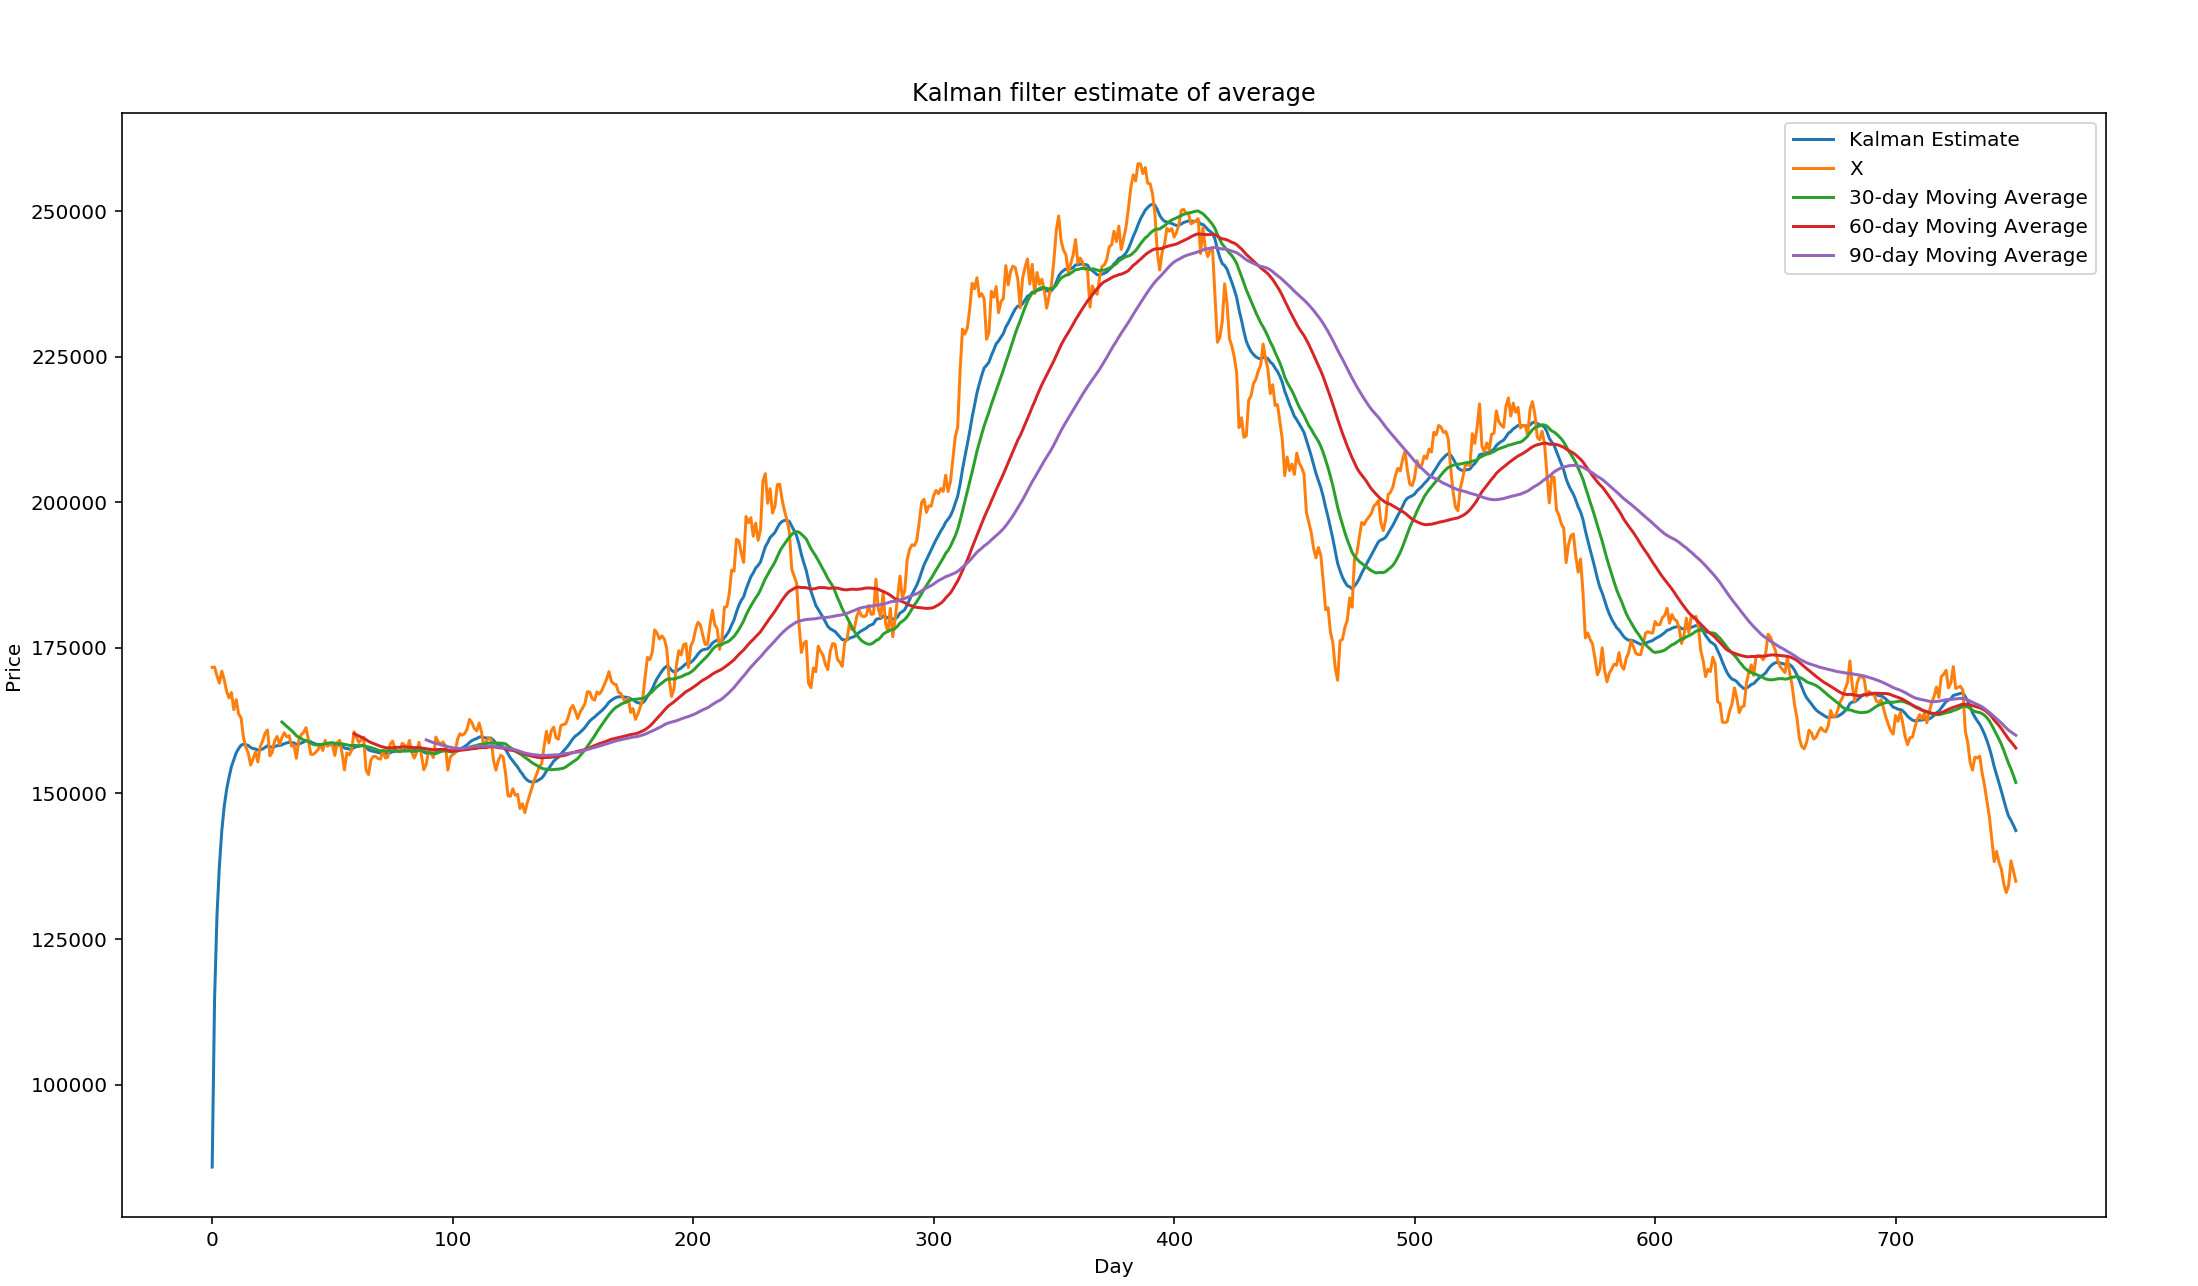
They CLEARLY prefer Kalman filters over moving averages. Turns out the code for this is not too bad and I provide all of the code for the image below at the end of this post. I will have to spend a little more time looking into exactly how they use Kalman filters now that I can do some of the code.
As I was playing with this (x =sim values) to see if Kalman Filters could get me in and out of one of my volatile sims at opportune times. Looks like the crossover of the Kalman (blue) and the 60 day moving average (red) might have worked over the last 3-or-so years for this sim.
This is the first thing I looked at with Kalman filters and this crossover is probably not the best (if it is useful at all).
My question is whether anyone has used Kalman Filters—or any method including moving average crossovers—to get in and out of their ports. Actually, I would be interested in any comments.
Comparing 50 day EMA to 200 day SMA seems to work pretty well for S&P500 indexing in backtest. Haven’t tried with many other securities. The beauty of 50 day EMA is it gets you out and in ahead of 50 day SMA. I think this may work if a lot of people are relying on 50 day SMA.
Personally I am suspicious of moving average tracking systems really working with repetition though because it’s dependent on what the market considers entry and exit points.
I set up the following ETF sim with weekly rebalance. If you make it biweekly then the 5 offset changes to 10 in the sell rule.
Jeff, you don’t need this complicated sell rule. Just put “1” as a sell rule and you will get a better return. AR = 11.9% from Jan-1999. As it is, your sell rule does not do anything, because it does not specify what to sell when this rule is true.
The sell rule forces a position change when the difference between ema(50) and sma(200) changes from positive to negative or vice versa compared to a week (5 days) ago. It might not be obvious but it does work. I get you can put 1, but I didn’t want to switch out every week, but now that I think about it that would probably work better as you would reinvest dividends weekly. You could use ema(40) as well.
This is all truly helpful and I am looking at incorporating all of these ideas.
A few additional thoughts:
Can you get a moving average of the PORT without Python? I guess that is equivalent to asking whether you can make a custom series for a port. Especially for the port in my example, a moving average of a benchmark may not be as good. Probably would not work in fact.
To some extent I was just playing with the Kalman Filter but it does seem like it is good for reducing the noise of a 5 stock port if you are going to use moving average crossovers. A 5 stock port will have a lot of noise. I would rather just use the 5 stock port itself (with a Kalman Filter) than have to move to a 25 stock port to reduce the noise, for example.
Bottom line on a Kalman Filter: it just reduces the noise. Probably no need to know anything else about it, I think. And no need to use it if noise is not a problem.
This has the potential to reducing the whip-saws for some situations, I think.
I modified some of the code to smooth the moving averages by using the Kalman estimates for the moving averages (just the changes):
Selling is easy but getting back in is impossible:
Ema(50,0,#Equity)<Sma(200,0,#Equity)
Problem is now your portfolio has sold everything after that sell rule and the portfolio is no longer changing. I don’t know if you can run a parallel simulation and reference that?
An easier way to do this is if Portfolio123 has buy and sell or hedge rules in Book simulations per individual assets. Also could be done through variable asset weighting based on a formula. Then the simulation continues but the book manages how much to invest in a simulation.
Thank you Jeff. I did not know that or I had forgotten it.
I do remember–a couple years back–trying to find a simple and reliable way to get automatic entry and exit signals. Thank you for reminding me of the different ways of trying to do this—in case I don’t just stick with Python on this.
I am considering an early exit: for example, when the Kalman estimate crosses the 30 day moving average. And a more conservative entry: when the Kalman estimate crosses the 60 day moving average or when it remains above the 60 day after an exit and re-crosses the 30 day moving average.
It seem like something similar to this will get me out at a good time and prevent some of the whip-saws (while still getting me back in plenty early). But I will test it out-of-sample. I will see how this would have done in 2008 for example.