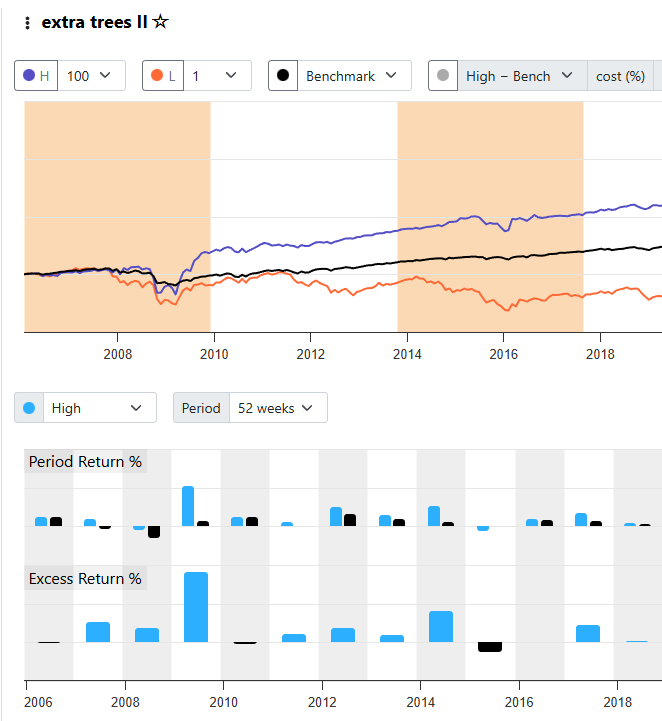
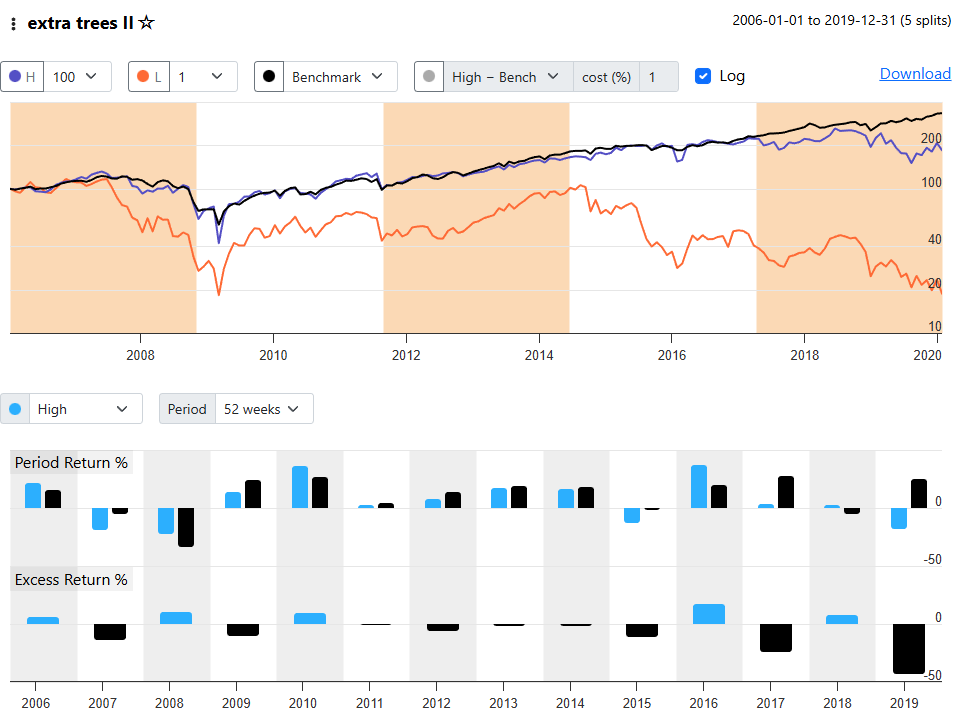
I was curious to see if the returns for my S&P 1500 AI model changed much if I changed the end date for Dataset Period. The start date for both was 2006-01-01. The original end date was 2025-04-19. I changed this to 2019-12-31 and re-ran. The results were dramatically worse.
The original produced this (I snipped the screenshot to only display the same time period used in the data edited version)
tree based models are extremely fragile and difficult to make robust, just the nature of how the splits work. a slightly different split in an early tree will change all the future boosted trees.
This is extra trees so the trees are not chronological/sequential like with gradient boosting machine models, but they are actually pretty random as the name extra random would imply. Here the massive change in training probably fleshed out the fact some of the features are not as good or general as intended. You excluded a bear market in 2022. By excluding that you probably changed the way the model avoids losses since those large losses help sway the behavior as they are large errors. Not completely sure what else is at play here and there could be a randomness aspect too for example. Try loading the dataset a few times and applying the exact same settings to get an idea of randomness.
What validation method and dates are being used? What are the dates for the actual training and what are the dates for validation
K-Fold validation with 5 folds. Original date range 2006-2025, second test covered 2006-2019. So I decided to run a third test this time ending 2017. Again, wildly different results from both the first and second tests. I’m surprised by the return differences seen between the 2nd and 3rd tests when comparing account equity for identical dates. The 3rd test did not include the Dec 2018 big sell off and the holdout periods were shorter due to the entire date range having been shortened (from a bit over 3 years down to a bit over 2.5 years so that may explain it.
Repeating the test and running the same settings resulted in similar performance.
Correct me if I’m wrong about this, but aren’t the equity curves displayed on the Results/Portfolio page created by piecing the Holdout periods together? So to answer your second question, isn’t K-Fold kind of a continuous training/validation process?
This model has 36 features that were imported from a ranking system I have been using with good results.
Okay, but in my actual trading I am only buying stocks ranked >= 99. What is the rationale for changing the percentile and what percentile would you suggest?
Just one stock different in that top percentile will give you wildly different results. And most of the difference in your result is over just one year... 2009.
Comparing the tests, there were actually some big differences both directionally and in magnitude.
I assume you mean the sell rule in the traditional P123 model I trade that uses the ranking system that I imported into AI? That exit is rank based. I trade 4 different traditional P123 models, and so far, no AI models.
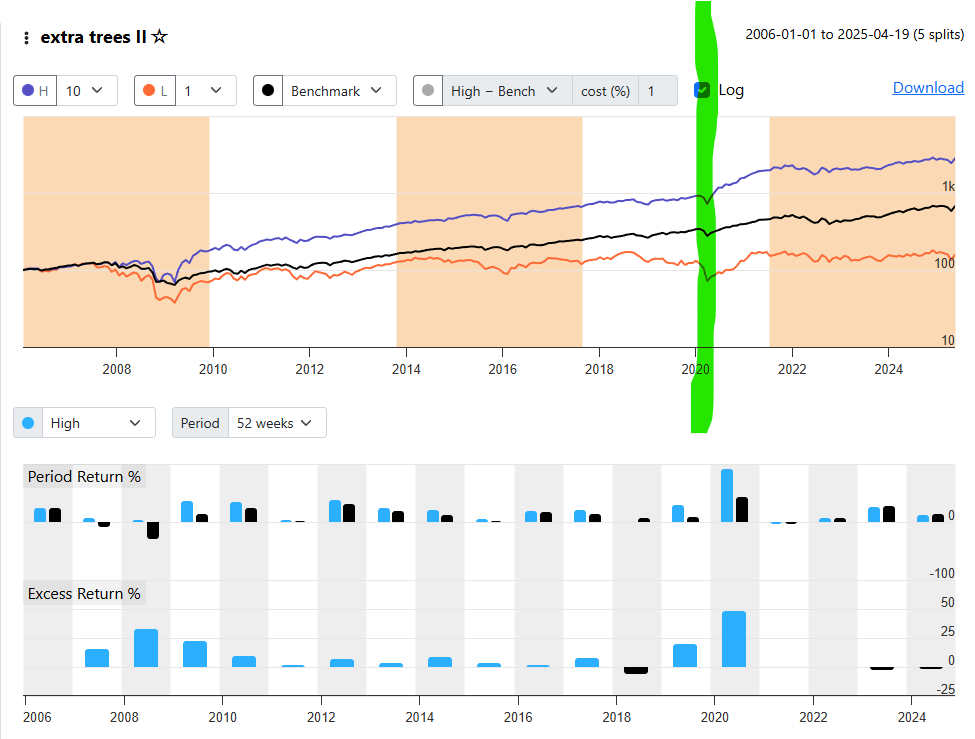
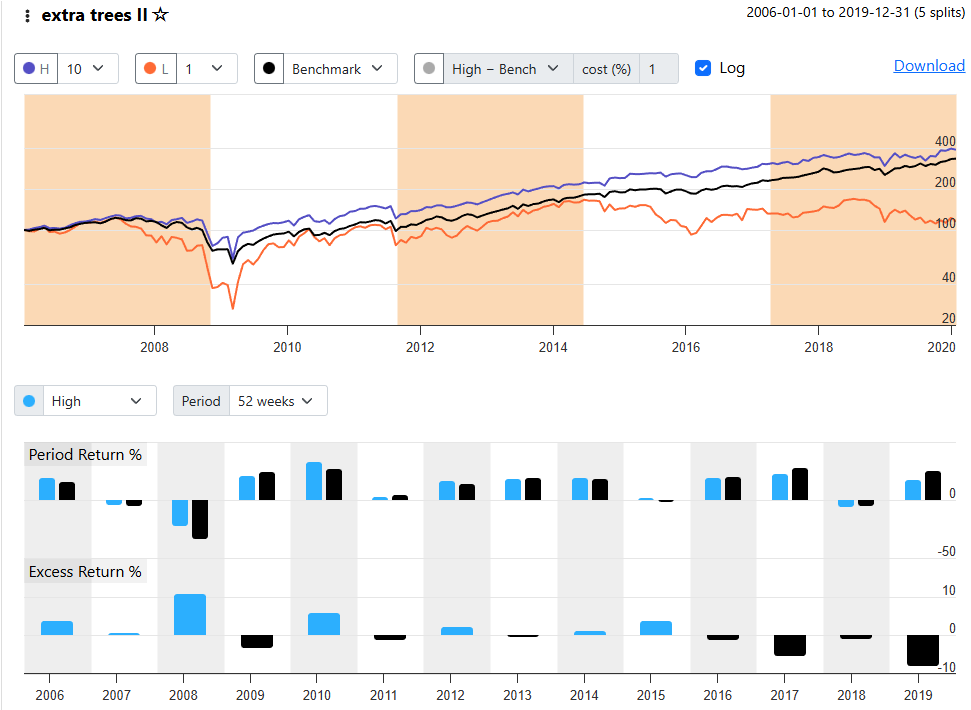
I changed the chart settings to deciles rather than percentiles so we can examine 150 stock portfolios:
Here is the original. I added the green line to mark the spot where the 2nd test ends so you can see the right hand scaling on the chart (which was cut off in the charts above):
Something I find a bit perplexing is understanding how choices about Validation method and Model choice interact. There are sooo many permutations that I find it difficult to proceed to implementation. Any suggestions are greatly appreciated.
In this case I am using the hyperparameters in the predefined Extra Trees ll model.
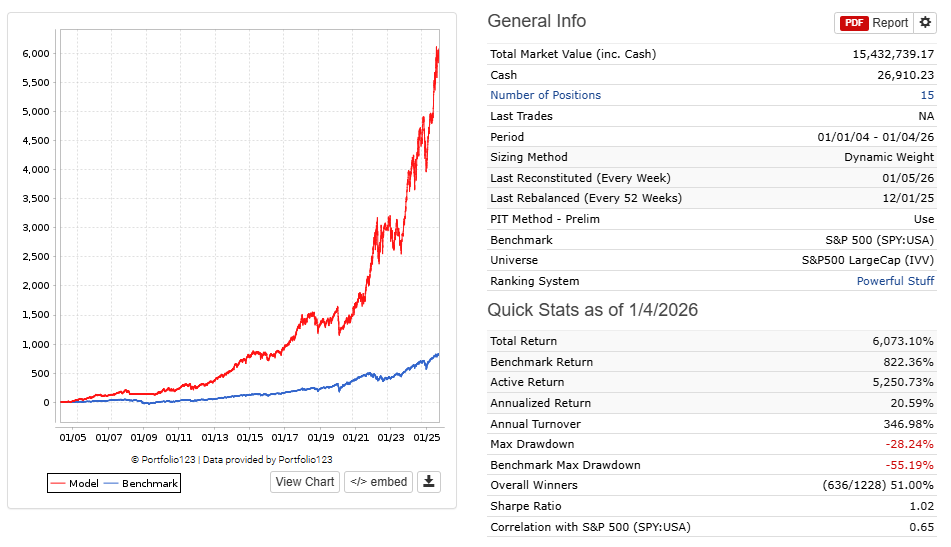
Also, fwiw, this is my traditional P123 model and it uses the ranking system I am trying to improve via AI. AI seems to have improved it, or so I thought, but am not so sure now.