Hi,
I'm having trouble reconciling the lift results and portfolio returns. You'll see a lift chart where the results predict well but the portfolio performance is mediocre. Can someone explain what's going on?
Hi,
I'm having trouble reconciling the lift results and portfolio returns. You'll see a lift chart where the results predict well but the portfolio performance is mediocre. Can someone explain what's going on?
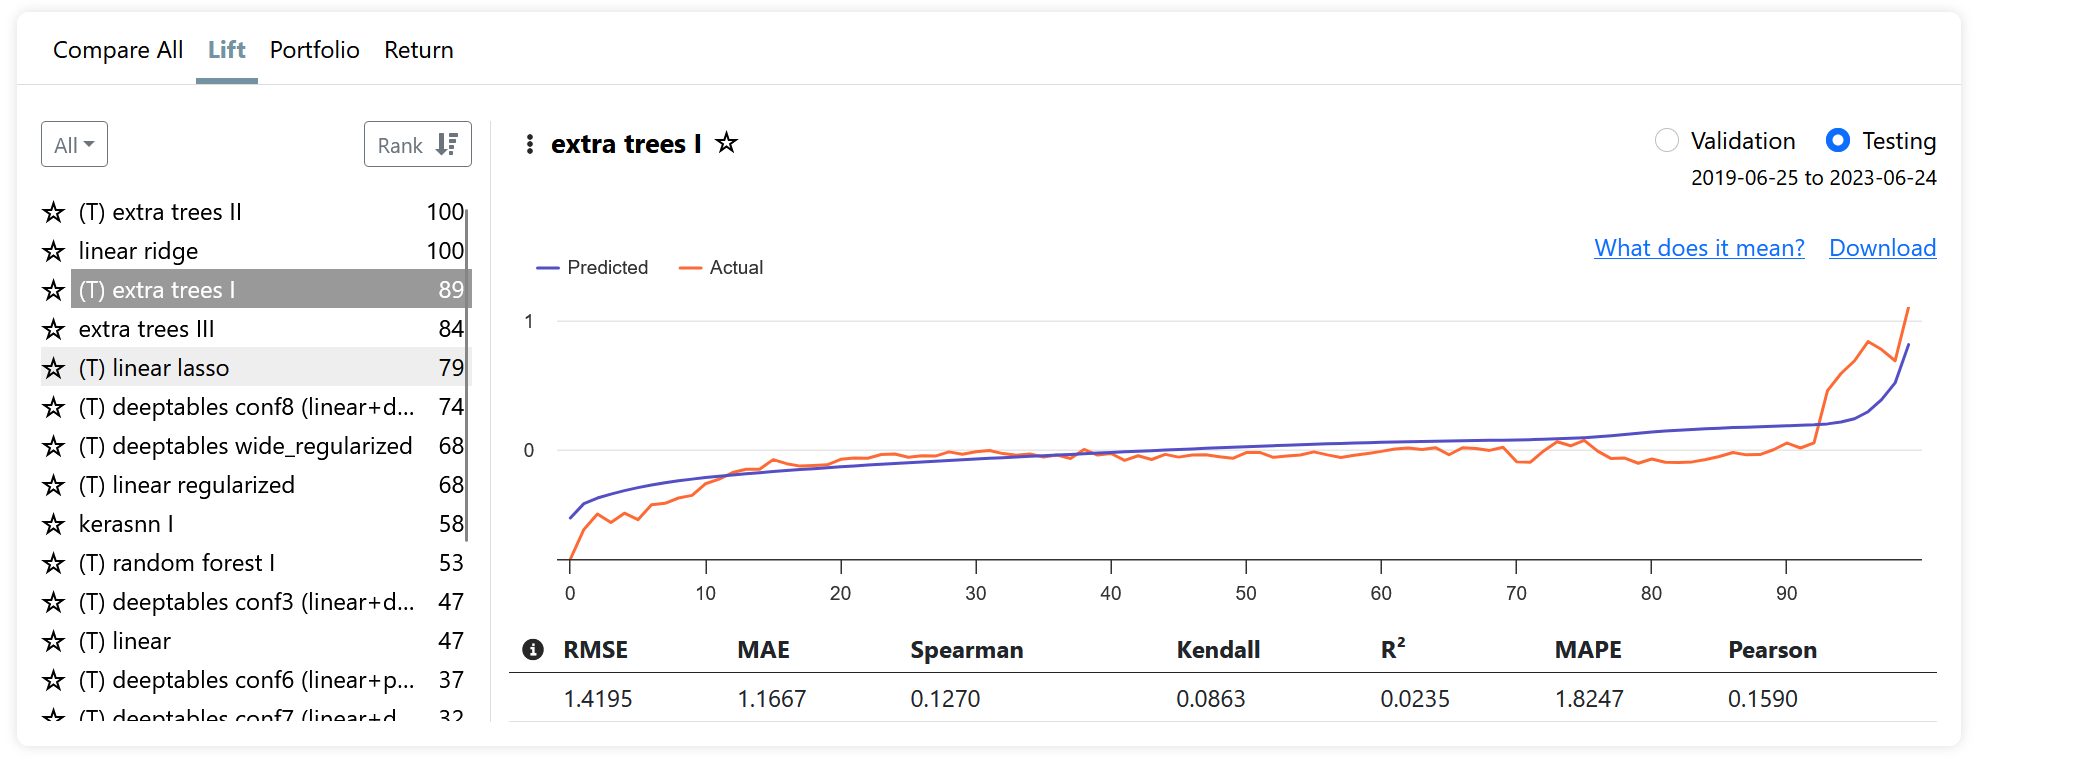
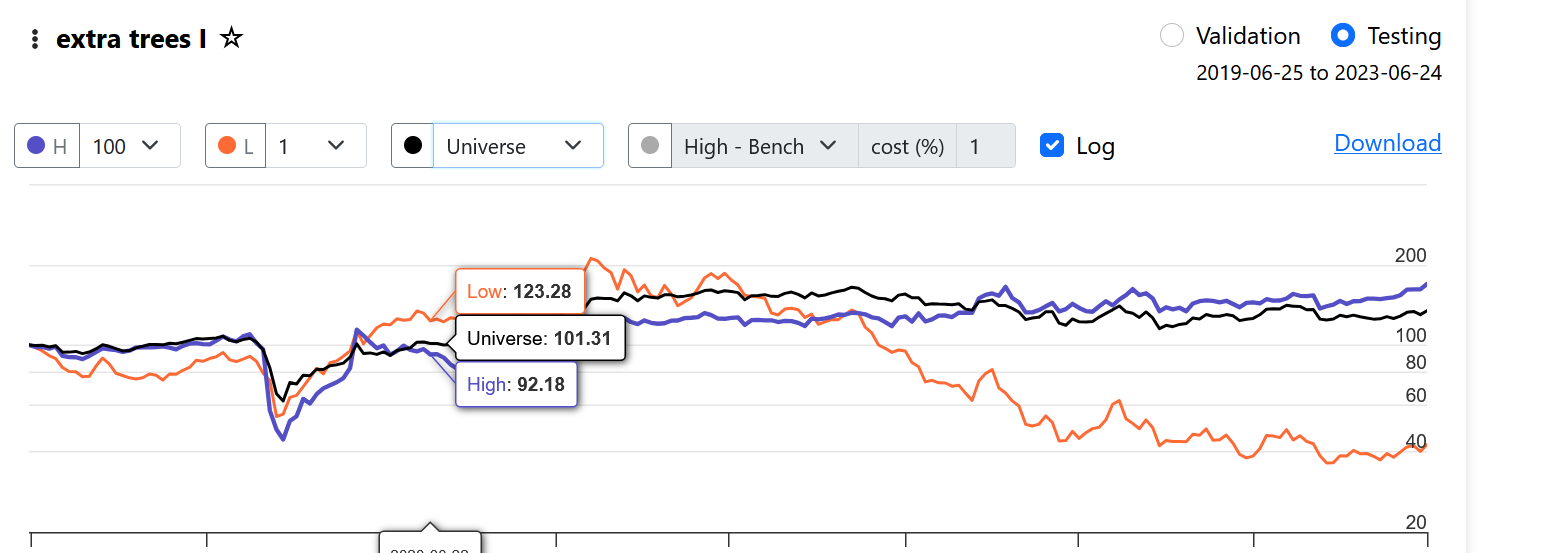
The lift chart compares percentiles of prediction to the average of their corresponding target in the percentile according to your period. For your model in particular, the tails suggest the model is predicting the 1-year future performance well. But when you look at a portfolio rebalancing weekly based on these predictions, the stocks in the 100th percentile are not performing well short term.
I might need some guidance on how to validate this. How would you go about verifying the results of that lift chart? There are many variables and potential pitfalls. I assume it involves using "add predictor" and possibly incorporating it into a screen or simulation or rank, but I want to make sure I get the dates right to avoid look-ahead bias. Thank you!
It seems you're hitting the same limitation here you raised in Can AI Factor Support 1 Year Predictions?.
We don't have a way to change the rebalance frequency currently. I agree that using a predictor is a good next step due to this limitation. Keep in mind that you wouldn't necessarily be looking at results derived from a trained model which matches exactly, but results should generally be comparable.
I'm realizing now it's related. Thank you.
If I may make a suggestion for any future work on this: modify the schema to eliminate any data leakage gaps. I've mentioned this issue before, but it's especially relevant when creating a predictor.
Ensure the training and modeling engine uses the date of the target features. This way, there's no data leakage. For any given date, use that to identify the target looking backwards and then gather the features as of the day before the start of the look-back period for the target to use to modelling purposes.
I believe this will resolve many issues. What are your thoughts?