Neither the Lasso nor Regularized linear model seem to work for me (Ridge does work). They finish within seconds and seem to generate corrupt output where no metrics like H-L etc are calculated.
Personally I think linear and logistic regression models are the foundation of any feature engineering process as the coefficient of the fit are:
a) understandable
b) of great value to eliminate predictors which aren't required (t-stats, p)
c) spot normalization issues though large coefficients
d) can detect multi colinearity through offsetting coefficients (see Variance Inflation factor / dredge in R)
On the back of this it would be great to make regression diagnostics available (and ideally the feature importance of any model).
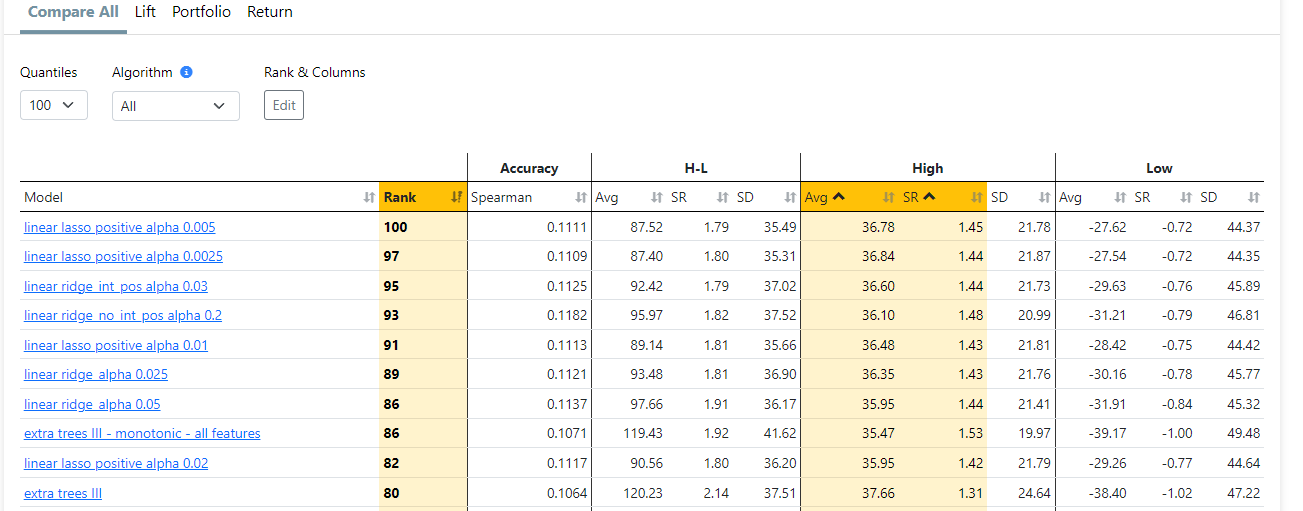
change parameter: "alpha" to 0.01 or less . Higher alpha more features have zero coeffs. When alpha = 0, the objective is equivalent to ordinary least squares (all features have non-zero coeffs).
also change -> fit_intercept": false
not sure this makes impact...
but with these settings all my linear models (lasso, ridge) works quite well... they are sometime even better than extra trees
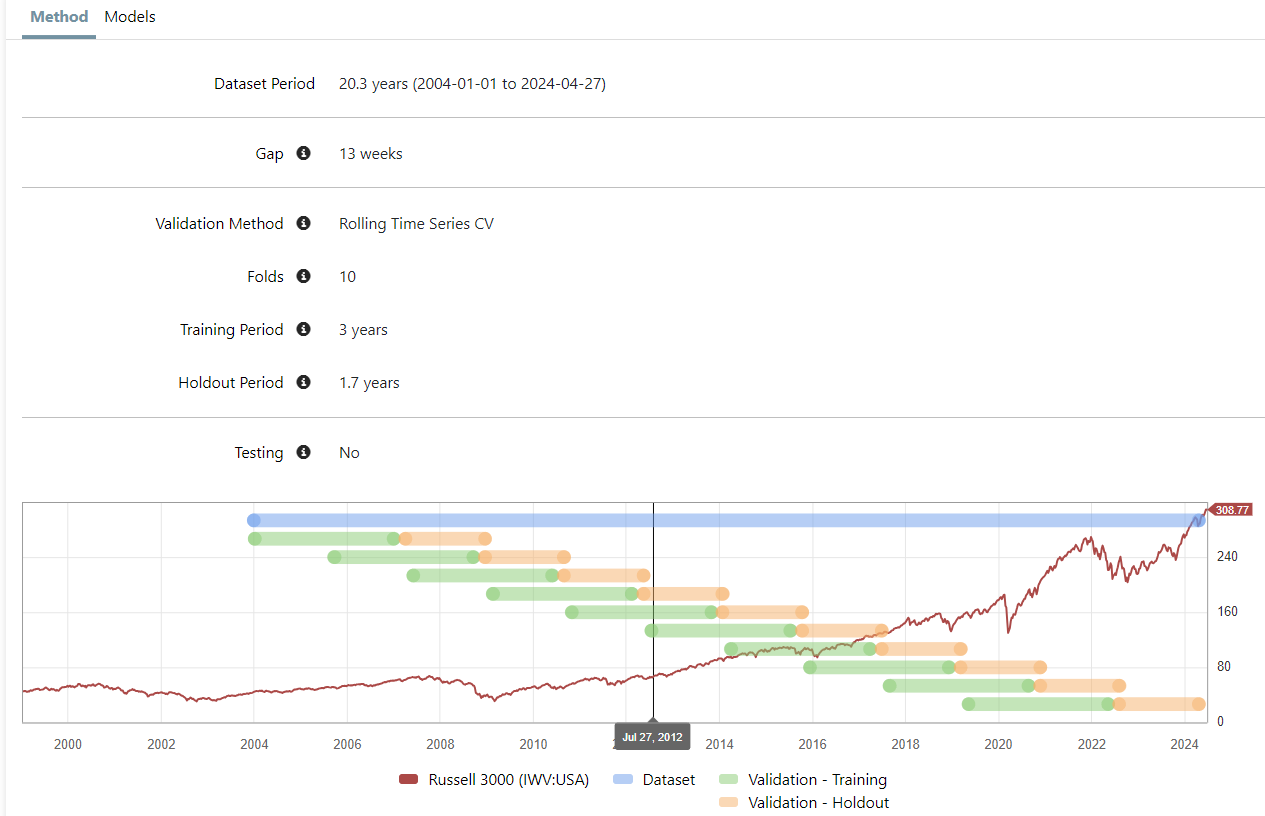
in addition , I found that lasso, ridge works well when we use Rolling Time Series CV, with relatively short training period...you may check if this is also true in your cases.
Thanks @pitmaster this indeed produced a viable output however given that I deliberately use some correlated variables I would expect lasso to arbitrarily selects some features among the highly correlated ones and reduces the coeffs of the others to 0, I.e not being "so sparse" to literally set all coeffs to 0. This should work with the default alpha value of 0.5.
Either way, I think it's imperative to see the model output to troubleshoot.
I think if the target is correctly normalized then not using an intercept is fine (mean=0).
I absolutely agree with your observation that lasso and regularized should be among the top performing models (when using proper features) and I would even go so far saying that if one of these models isn't showing positive performance anything more complex with the same features won't work OOS.
Below you can see an example output from Rulefit (only 10 rather randomly selected features).
You can now see what type of features ML models may select. In reality they are more complex (more ANDs in one rule)
The key steps in RuleFit are as follows:
fit any tree-based model (xboost, rf, ...)
extract most important rules and transform them as a binary features (0 or 1)
fit lasso regression with rules and linear features
Features are scaled using Rank. Positive 'coef' means that there is positive relation of the feature with future return. You can see that one of the features is Last Price.... it maybe related to momentum ... but it is interesting.
It is quite well documented anomaly.
But it is first time I realized that it exists...
In general RuleFit is great to discover interesting, simple to understand rules. Some users who prefer more traditional (transparent) way of investing may benefit from this methodology.
The results are interesting. Some, like id=76, seem to have an unnecessary AND term. And Return on Assets % vs SubSector, having a negative coefficient made me think. Thanks for posting about RuleFit. It's new to me.
You are right that some rules does not make sense when are extracted from of tree ... but this is automatic parsing, possible some more intelligent parsing rules are needed.
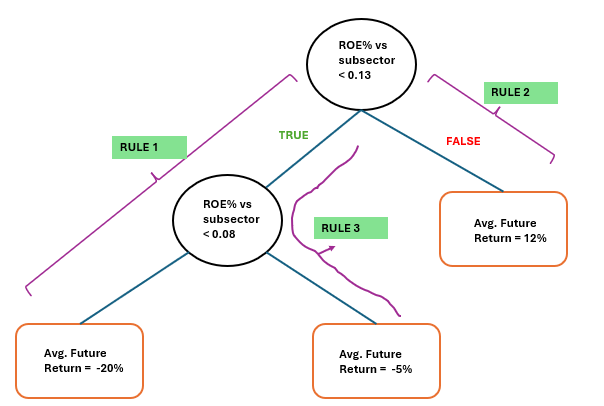
But anyway, this this rule makes sense when you look at the tree...
In the figure below, RULE 1 indicates that if ROE is lower than 0.13 and lower than 0.08 then avg. return is -20%. This rule is associated with RULE 3, which indicates that if ROE is lower than 0.13 and higher (or equal) than 0.08 (ROE is 8-13%) then avg. return is -5%
So this is “stacking” isn’t it? Using the output of a machine learning method (decision trees) as the input of another machine learning method (multivariate regression with the use of dummy variables).
So it is new but also well-established at the same time. Stacking is a well-accepted method.
One big advantage is it accounts for interactions which would require “interaction variables”if sticking to pure multivariate regression. Or more accurately, this is one way to create interaction variables.
Also so of the rule found by decision trees could be used in P123 classic I think.As buy/sell rules or Boolean logic in a ranking system.
I think Pitmaster has already said most of that in this post and an earlier post that I did not understand at the time.
Regularized linear models like lasso and ridge are linear regression models. The only difference is the loss function has an extra term to bias the results, hopefully resulting in less variance.
Regarding feature selection (your point b) and multi-collinearity (your point d), regularized regressions are prized for having both of these built in. Under lasso, non-predictive features will end up with zero coefficients. Ridge is a little different, but non-predictive features should have quite small coefficients.
These benefits are why we often see regularized regression trained on truly massive datasets with hundreds or thousands (or more) features.
Absolutely true and a great point! Principle component regression (PCR), factor analysis regression (FAR), and partial least squares (PLS) adding to the list of methods commonly used to address multi-collinearity.
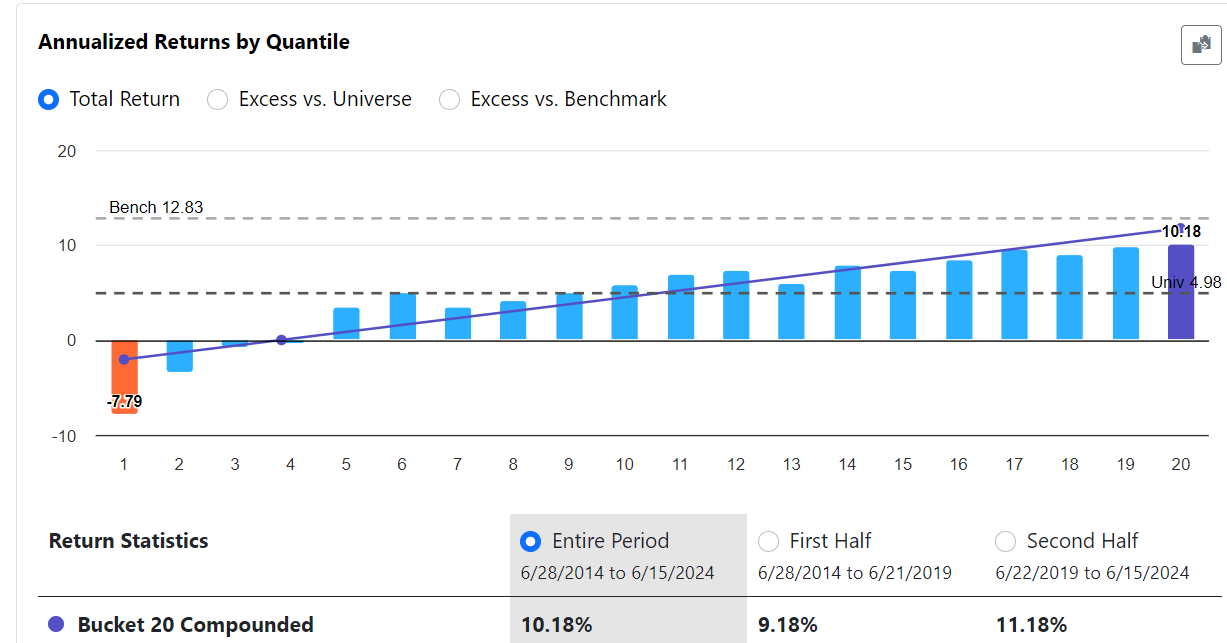
Hi @pitmaster, I did a quick rank performance test and the 1 year return (Ret1Y%Chg) is showing a positive slope. I don't understand how the RuleFit coef is showing a negative correlation. Is Rank Perf the correct way to cross-check whether RuleFit is generating the correct stats and how can it help with selecting features, especially the "linear" types? Or does RuleFit already take into account the interactions amongst factors and hence we cannot look at a single factor in isolation?
Loosely speaking, negative coef in regression equation for a binary variable would mean that:
if the rule is true, then this factor should contribute to lower predicted return
if the rule is false, then this factor should contribute to higher predicted return
Rules from Rulefit are generated randomly from many decision trees (DT), which try to find the best interactions and best split. By best split I mean e.g., 0.573 for feature X051. By best interaction, I mean that it is 'optimal' to combine X051 with X026 for highest predicted return (value : 0.539).
The difference between predicted rank returns for true/false is not significant (0.539 vs 0.504, bottom right corner). You would need to build deeper tree to get rules that offer higher return. Possibly use Random Forest algorithm to combine many deep trees. But then you lose interpretability.
I use decision trees to extract rules, usually with no more than 2-3 interactions, and use them in a linear models.
Fig 1. Output from a decision tree based on SP500 data with ~ 100 ranked factors, target is a Rank(3mRelRet).