Live vs Simulated - FactSet vs Compustat

**Originally posted this in another thread when I shouldn’t have. Moving it to its own thread.

Live vs Simulated performance has been an item of interest for me recently. I am currently trying to decide if I want to continue paying for Compustat or if a FactSet license would be sufficient. A fairly difficult question to answer as it turns out.

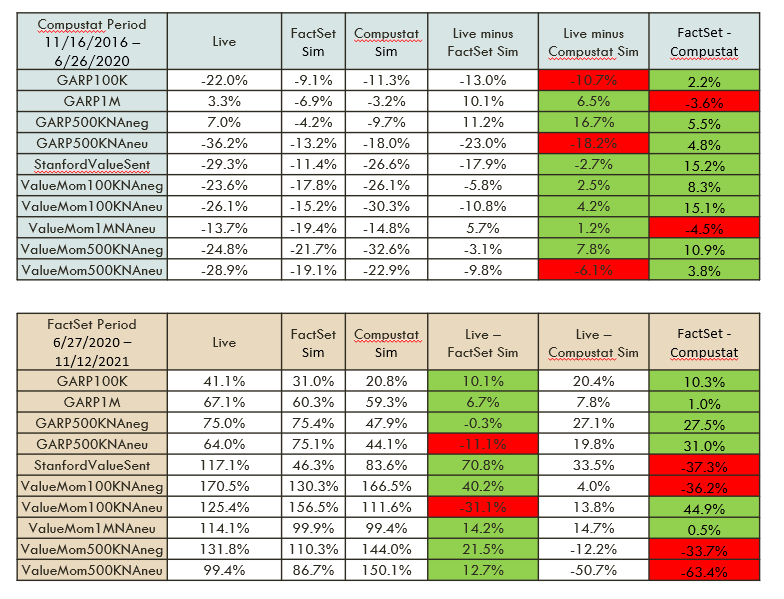
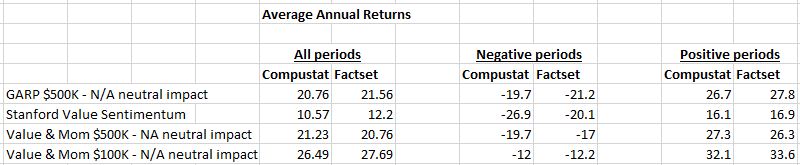
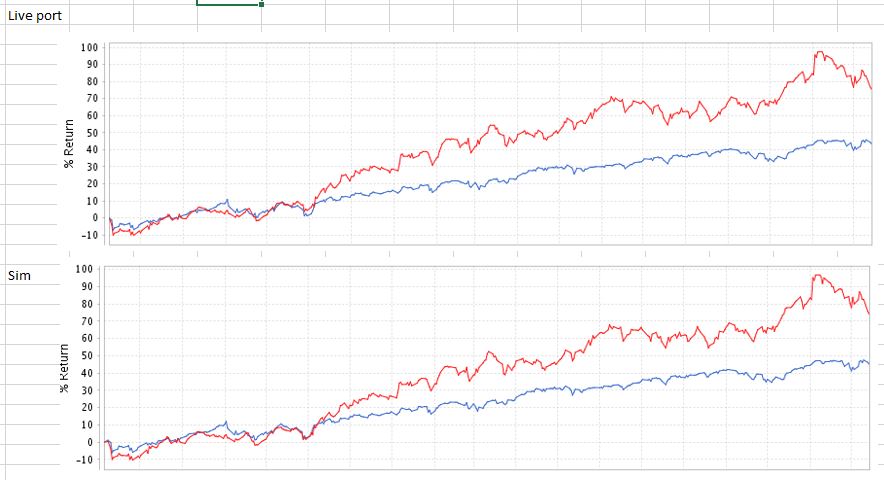
One piece of work that I did while trying to answer this question was to look at the performance of P123’s Live Portfolios versus simulated performance. We have Live performance for these strategies for the Compustat period (11/16/2016-6/26/2020) and for the FactSet period (6/26/2020 - present). I ran simulations on FactSet and Compustat for each of these periods and compared them against the Live Performance for those same periods. I have attached the results of that analysis. Note that for both periods I used Total Return over the period as the comparison metric. I used Variable Slippage and Next Close as the transaction price.

For purposes of this discussion the most important column during the Compustat period is the Live minus Compustat column, and similarly the Live minus FactSet column during the FactSet period. As you can see from the data the variance between backtested and live performance was quite significant for both time periods. However, the Live Performance tended to be better than the backtested performance unless the Ranking System used the NA Neutral setting. This was true for both periods.

Not sure exactly how to interpret this, but it does make me feel a bit better that perhaps our backtests aren’t causing us to be too overconfident.

One interesting item of note was how poorly the StanfordValueSentiment strategy performed in the FactSet backtest during FactSet time period. The Live portfolio returned 117.1% over this period while the backtest only has a return of 46.3%. Might be something that P123 staff wants to look into.

As a side note, I still haven’t decided which way to go on the Compustat vs FactSet question. Curious if anyone has any opinions on the matter.

Cheers,

Daniel


Regarding Compustat vs FactSet, let me offer my two cents.

  • FactSet has far better coverage.
  • Compustat is more P.I.T. when backtesting.
  • Compustat standardizes data much more than FactSet. For example, Compustat calculates gross profit for banks, while FactSet maintains that that metric is meaningless for banks.
  • FactSet processes earnings releases faster. Compustat prioritizes earnings releases of large companies; FactSet doesn’t.
  • FactSet covers semiannual releases much better.
  • FactSet’s RBICS classification system is, in my opinion, better than Compustat’s GICS system. For one thing, FactSet classifies each company by its largest revenue source while Compustat does not; for another, FactSet’s sector classifications simply make more sense, in my opinion.

If I were paying $12K to $15K to Compustat in order to use their data, I would definitely continue to do so. I find that comparing the two gives me valuable additional insight into the stocks that I buy and sell.

Marco,

With regard to the period after June 2020 is it still true that P123 has been taking snapshots of the fundamental data?

If the Stanford Value Sentiment model is using value factors that P123 has been taking a snapshot of since June 2020 then can the fundamental data be a source of any discrepancy between the sim and the port? How could it be?

And if not, what is left as a cause for the discrepancy? Sentiment data maybe? Maybe not be but what else then?

We were told recently that the earnings estimates data was good: HERE

That is not a small discrepancy assuming Daniel’s analysis is correct. The sim’s returns were 2.5 times greater to just state the facts. I am not sure how any rational member could just ignore that or use that data as a basis for investing their hard-earned money without a more complete understanding of what is going on. I wonder if you might consider trying to explain the cause for this if you know the answer.

If it turns out to be earnings estimates data I wonder if you might look into fixing it.

Jim

Yuval,

Thanks for your thoughts! Reading your note I would have expected a different conclusion than the one you gave. It sounds like in many cases FactSet handles things better, but I guess in your view the better PIT and standardization from Compustat outweighs the FactSet advantages? (Side note: at present I am paying for both in order to make this assessment, but I do not plan on doing that long-term.)

Thanks,

Daniel

I would be very hard-pressed to choose between them. That’s why if I didn’t work for Portfolio123, I would definitely subscribe to both. “Outweighs” is not the word I’d use–perhaps “helps balance”?

How do you subscribe to compustat? I thought the only data source offered was Factset data? Regards

I don’t plan on adding any CompuStat data unless I am sure the FactSet data is okay. I actually think the data is probably okay. P123 could document that by doing what Daniel has done here with the Designer models.

I should have noted that for the above Stanford ValueSent (6/27/202-11/12/21) live beat the sim. This is a good thing. It implies that there may not be any systematic biases favoring sims (including maybe or even probably no look-ahead bias).

As far as what we can determine using our own sims and ports:

Daniel looked at a period BEFORE SNAPSHOTS (11/16/2016 - 6/26/2020) and found that for FactSet data the sims and ports were very close with an average difference of only 2.06 (a pretty insignificant amount).

BUT the standard deviation was HUGE at 12.9%. This means that it is probably impossible for a single P123 member to ever be confident in the data by just studying his/her own sims and ports.

My point is a member cannot hope to understand the data by themselves because of the large variation in the results even over a 4 year period.

Marco,

This POSITIVE DATA FROM DANIEL comes as we get this from Yuval (P123’s product manager):
[/quote]- “Compustat is more P.I.T. when backtesting.”
[/quote]

Note that this along with better standardization of the data where the only advantage for CompuStat data mentioned by Yuval.

Yuval thinks it is worth paying $15,000 dollars per year for data that is more PIT and better standardized.

I actually think that the FactSet data is probably okay and Yuval is probably wrong about that. Marco, you are shooting yourself if the foot by not showing us that and letting Yuval make these claims without any evidence.

I think P123 could add to what Daniel has done --probably disproving what Yuval has said. I think it would be a win for everyone. Am I wrong?

BTW, anyone doing machine learning would like to know that this is not a garbage-in garbage-out situation with the data.

Maybe the smart thing to do is add CompuStat. But also ditching FactSet would be the better play for any portfolio with less than $150,000 because $15,000 represents a HUGE 10% administration cost for a $150,000 portfolio.

[color=firebrick]And even those with over a million dollars to invest may not want to put it all into P123 ports. Many millionaires would be complete fools to do as Yuval has suggested.[/color]

Marco you should do something. You are pricing yourself out of the market if you are going to tell everyone that they need to spend $15,000 to get good data and that machine learning may not be of any value with the present data.

I think you can prove that the FactSet data is okay. You should do that. Daniel has already started that for you. You could also be creative and/or proactive and use some of your own ideas to document this.

Maybe put Daniel in charge of that. He knows how to do it and has a genuinely open mind about what the result might be. You also have some in-house resources including your AI specialist who could run that data in about 15 second in whatever programming language he/she uses. Maybe take 5 minutes to give us some context: average difference, what factors gave the most difference etc. It is more a question of people’s motivations and access to the data than anything else.

Best,

Jim

We didn’t have FactSet data until 6/2020. So you can’t reach conclusions about FactSet over the last four years from this. Please reread Daniel’s tables more carefully.

You need to contact S&P and ask for a license. It runs about $15K per year. If you need a contact person, let me know.

Yuval,

You miss my point and I assume Daniel’s reason for looking at that data and showing it to us–which I appreciate very much.

But I do invite you to add additional data.

Best,

Jim

Just to clarify my position. I think it would be worth paying $15,000/year for Compustat data because two different data providers gives me much more information than one. When I choose a stock to buy I want to look at it from every angle, carefully. If it ranks highly on FactSet but not on Compustat, or ranks highly on Compustat but not on FactSet, then I’m going to buy fewer shares than if it ranks highly for both. It makes a big difference for me in terms of my confidence level to be able to look at the data from both providers.

Compustat’s standardization of the data does not make it “better.” It actually makes it worse, in my opinion. It’s TOO standardized.

FactSet has numerous advantages over Compustat, and I am very glad we switched data providers. In my opinion, users are going to be able to make more money with FactSet’s data than they could have if we’d stuck with Compustat.

  • Yuval

Just to clarify my position:

  1. The data has a lot of volatility (standard deviation) and it is not possible for a single member to know if the sims and ports are performing in a similar matter or not. I have no opinion on this because I have little data. AND probably I can never get a fully informed opinion on this in a reasonable time on my own.

  2. P123 has access to a lot of data and could easily replicate what Daniel has done. Ultimately addressing any concerns anyone has if the data is good. Daniel was smart to do this.

  3. Yuval, without necessarily knowing a member’s financial status, recommends paying $15,000 to improve upon FactSet’s data. He must think there is a lot to be gained Just wow!!! Yuval can spin that however he wants.

  4. Ultimately, in poker at least, if someone has the cards they are willing to show you them at the end of the hand. At the end of the day, P123 not wanting to replicate Daniel’s data and show it to us will say a lot if that ends up being the case. Speak volumes really.

Where am I wrong?

Jim

Yuval made more than $1.2-million trading stocks from Dec-2020 to Dec-2021 according to his blogs. So $15,000 is not a lot of money for him, unlike for many of us who don’t make as much.

Georg,

Just a million?

And did you take his recommendation to add CompuStat data. You must have as you can clearly afford it.

And could you add one of those winning strategies to your designer models?

Glad you are happy.

I have absolutely no idea how that is related to the good work Daniel has done or my request that P123 might expand upon that however.

Truly happy for you Georg. But is that how we decide about data here at P123? Brag about this or that and do whatever the person with the biggest (sometimes legitimate) bragging rights says we should do? No need for objective data?

Maybe we should call Joe Rogan who seems pretty confident (and made a million last year) to see what we should do about getting (and treating) COVID. Me I went to a doctor and he was happy to answer some questions. Saw some data before opting for Regeneron’s monoclonal antibodies. BTW, I had both Moderna’s vaccines (and recommend it). I was not eligible for the booster as it was not quite available yet. I do not believe this is off topic. The point is no serious person makes that type of argument (except perhaps Joe Rogan who may or may not be serious).

P123 has not acted like Joe Rogan. That was not my point.

Best,

Jim

Jim, You misread,it is not me who made the $1.2-million, it is Yuval.

Georg,

You misunderstand me about the importance of that: zero, nada, zip, IMHO.

What does that have to do with someone wanting to understand the data for what might be called a…well, you tell me what you want to call it. BUT DATA IS INVOLVED at P123.

And I do not think it is just me. Daniel can tell us why he did that. Me I am just glad he shared it.

BTW, I absolutely made $1,000,000 at P123. Are we going to start competing on how fast it was or where we started from?

Is that really your point? Really? BTW, I like Joe Rogan but sometimes he is ridiculous. Maybe I should not expect too much from a comedian.

Marco,

On a serious note that millionaire (and the management fee calculations) above is me. I made most of that fully invested in P123 ports.

But now with Yuval saying the FactSet data in not PIT every chance he gets I have $200,000 invested in ports. That would be about an 8.5% management fee if CompuStat were added. Maybe I will do that when I have more confidence in the data and make the management fee a smaller part of my investment in ports.

BTW, are you lagging CapitalIQ data now? I generally need confidence in the data if I am going to invest more in my ports–making some of this a rational cost for me.

I do not know how may millionaires you plan on marketing to. But I will not be adding CompuStat data now and I do not know which direction I will go in with FactSet data as long as your product manager keeps saying every chance he gets that the data is not PIT and will not do simple things to show us how much of a problem that is. Things like Daniel understands.

Best,

Jim

Comparing single simulations is not a good way to verify that Compustat and Factset are producing similar backtests results. A better way is to run rolling simulations that have a short holding period because as the period gets longer, it is more likely that some slight difference will cause the holdings in the two simulations to diverge even if the vendors were picking mostly the same stocks at a given point in time. Also keep in mind that the ranks from the vendors are not going to match exactly because of small differences in their data and in their factor calculations. Again, these small differences can easily lead to large differences in the simulation over time. I ran rolling sims for some of Daniel’s examples using a period of 6 months with an offset of 3 months for the last 10 years. This produces 39 samples. The average annual return for those samples is below and it shows no significant difference.


Dan,

Nice and thank you. That is very helpful. It does address my main concern in a tangential way. Also, hopefully, it addresses Daniels questions about what data he might want to use.

I have been struggling with comparison of FactSet sims versus FactSet ports. Never thinking I had the right way to look at it and recently realizing that I would never get an answer on my own with any approach using my data alone.

For data like Stanford’s Value Sentiment it is clear that the sim and the ports are going to be wildly different. Full stop.

In addition, if every time you do a comparison and the sim wins over the port, I personally, think that is a problem. Enough that I pulled all of my money out of P123 ports. And to expand on what I said above the ports I run use a lot of InList now.

People can disagree all they want but it is my money.

All of my ports underperformed the sim. Every single one by a large margin.

But Daniel’s data showed the port outperforming the sim by an absolutely huge margin. His data showed results to opposite of my data. Good to know.

So I think it is fair to say that someone can expect a huge variation in the results which is not entirely good. But with an adequate sample of ports and sims (like what can be found in the designer models if they are run as sims now) the ports and sims may do about the same (on average). Then at least there would be no systematic bias like a look-ahead bias.

Remember there is some look ahead bias and I actually appreciate that Yuval and others are now open about that. Again full stop. I am not aware that there is any debate on the facts of this.

Not looking for systematic bias given the constant drum-beat about the data not being PIT is financial malpractice in my opinion. Again people can disagree with me on that but as manager of my funds I have no motive to do such a stupid thing…

Now that the earnings estimates data are lagged I suspect P123 could look at that and find a small difference on average. An acceptable difference or no difference probably.

That would help me, possibly Daniel, I think Chris (ETFoptimize) has an opinion on this as well which he can share if he wants. Others have commented, others have not commented but I am sure a few have concerns. Some have gone away quietly.

I have asked about P123’s refund policy but decided to sort this out when my membership was automatically renewed in April I think. It comes up again this Spring.

To summarize, it would be nice to think a sim could help predict the future. But does the sim even predict the past? If you had been running a port using the same strategy as the sim in the past would your results be even remotely similar to the sim?

That answer is beginning to looking like: no, a live port would not have looked much like the sim and possibly be very different (in the short run) but long-term things may average out to about the same returns for the sim and port. Maybe, probably or in truth who actually knows?

Look at the Stanford Value Sentiment if you disagree about the volatility of the results and the complete lack of similarity between the port and the sim.

Maybe earnings estimates with FactSet data are a particular problem. Probably, in fact, but that is the data i will be using for now. Full stop. I have no plans to ask what data I can use and have to explain how much money I made at P123 to justify that. Although I am sure some members and Elizabeth Warren have an opinion on that which I cannot begin to explain.

Anyway the volatility is too great for me to say anything based on evidence I have. P123 could answer that should it decide to.

Whether you go further or not, thank your for what you have done.

Best

Jim

Hi Daniel and Jim,

I looked into the differences in the performance of the Stanford Value Sentimentum live port vs a sim starting around the time that we switched to Factset. Their results look identical if you setup the test like this:

Create the sim so that it starts on 6/6/20 since Monday 6/8/20 was a rebalance date for the live port. It rebalances every 13 weeks, so it is important that the sim starts on the live ports rebalance date. The sim has a buy rule that forces it to buy the same stocks that the live port was holding after the rebalance on that date. This is required since the sim has to start with the same holdings.
Rule was → eval(AsOfDate<=20200609,ticker(“AXAHY BANF BNPQY CLS CNXN DTEGY IBA IMKTA MFC NGHC^21 QFIN REGI RY SONY SWDBY TEO TIMB TX UBS WLKP”),1)

The sim will hold equal amounts of each stock on the start date, but the port held different amounts of each stock. This will cause some differences in the results, but didnt have much effect in this case.

The first rebalance had some stop losses triggered in the live port, but not in the sim because the sim started on a different date. So I created a sell rule to force the sale of those stocks in the sim and reran it. That added almost 5% to the sims return.
rule was → eval(AsOfDate=20200908,ticker(“BANF,AXAHY,BNPQY,MFC”),0)

Sim is public → Stanford Value Sentimentum_Factset_Tickers

Charts for dates 06/06/2020 - 12/14/2021:


It does appear to me that the most prominent characteristic of Factset vs Live returns is that there is much more differential variance in returns. With Compustat vs Live there is noticeably less differential variance. So I would be interested to understand what individual factors contributed to those differences especially in the Factset vs Live. Is it a result of the PIT issue that has been resolved the past couple months or are there other drivers? I do think it would be of great value to the user base for Portfolio123 to look into these deltas and at least understand them if they haven’t. Ultimately my goal is to be able to simulate and reproduce that simulation to some extent in real life. When you see 30%-40% deltas between sims and lives that doesn’t exactly engender confidence regardless of which way it favors.

I’ve been watching these discussions as well because I have multiple sims which I have tested extensively and have high confidence in as they are based on sound fundamentals but I am seeing divergences between sims and lives. I suspected they are too dependent on sentiment type indicators which I have since tried to make my strategies less reliant on and also to significantly reduce turnover. My supposition is that by reducing both of those my sims will be less distorted by any PIT issues.

Jeff