I’ve noticed that using a factor like EMA(21, 0 ,#Vol) seems a bit too good to be true, especially when limiting downside. Also, the results compared to MedianVol(10) or Medianvol(21) just seem off too much. What is going on here?
Is there some look-ahead bias going on or have I just spilled a big spoon of potential tasty secret sauce?
I don't see a way this technical factor could have look-ahead. Since it's a technical factor you can download the actual raw values being used if you disable the normalization and spot check yourself (you might have to use Factor Download).
Was not sure of the universe and decided to do it as a simple screen to avoid any ML model leakage.
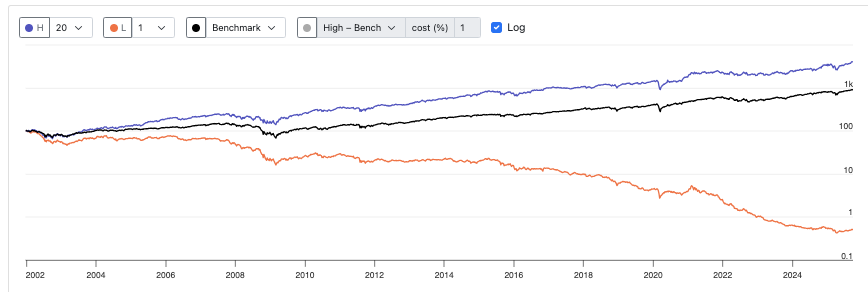
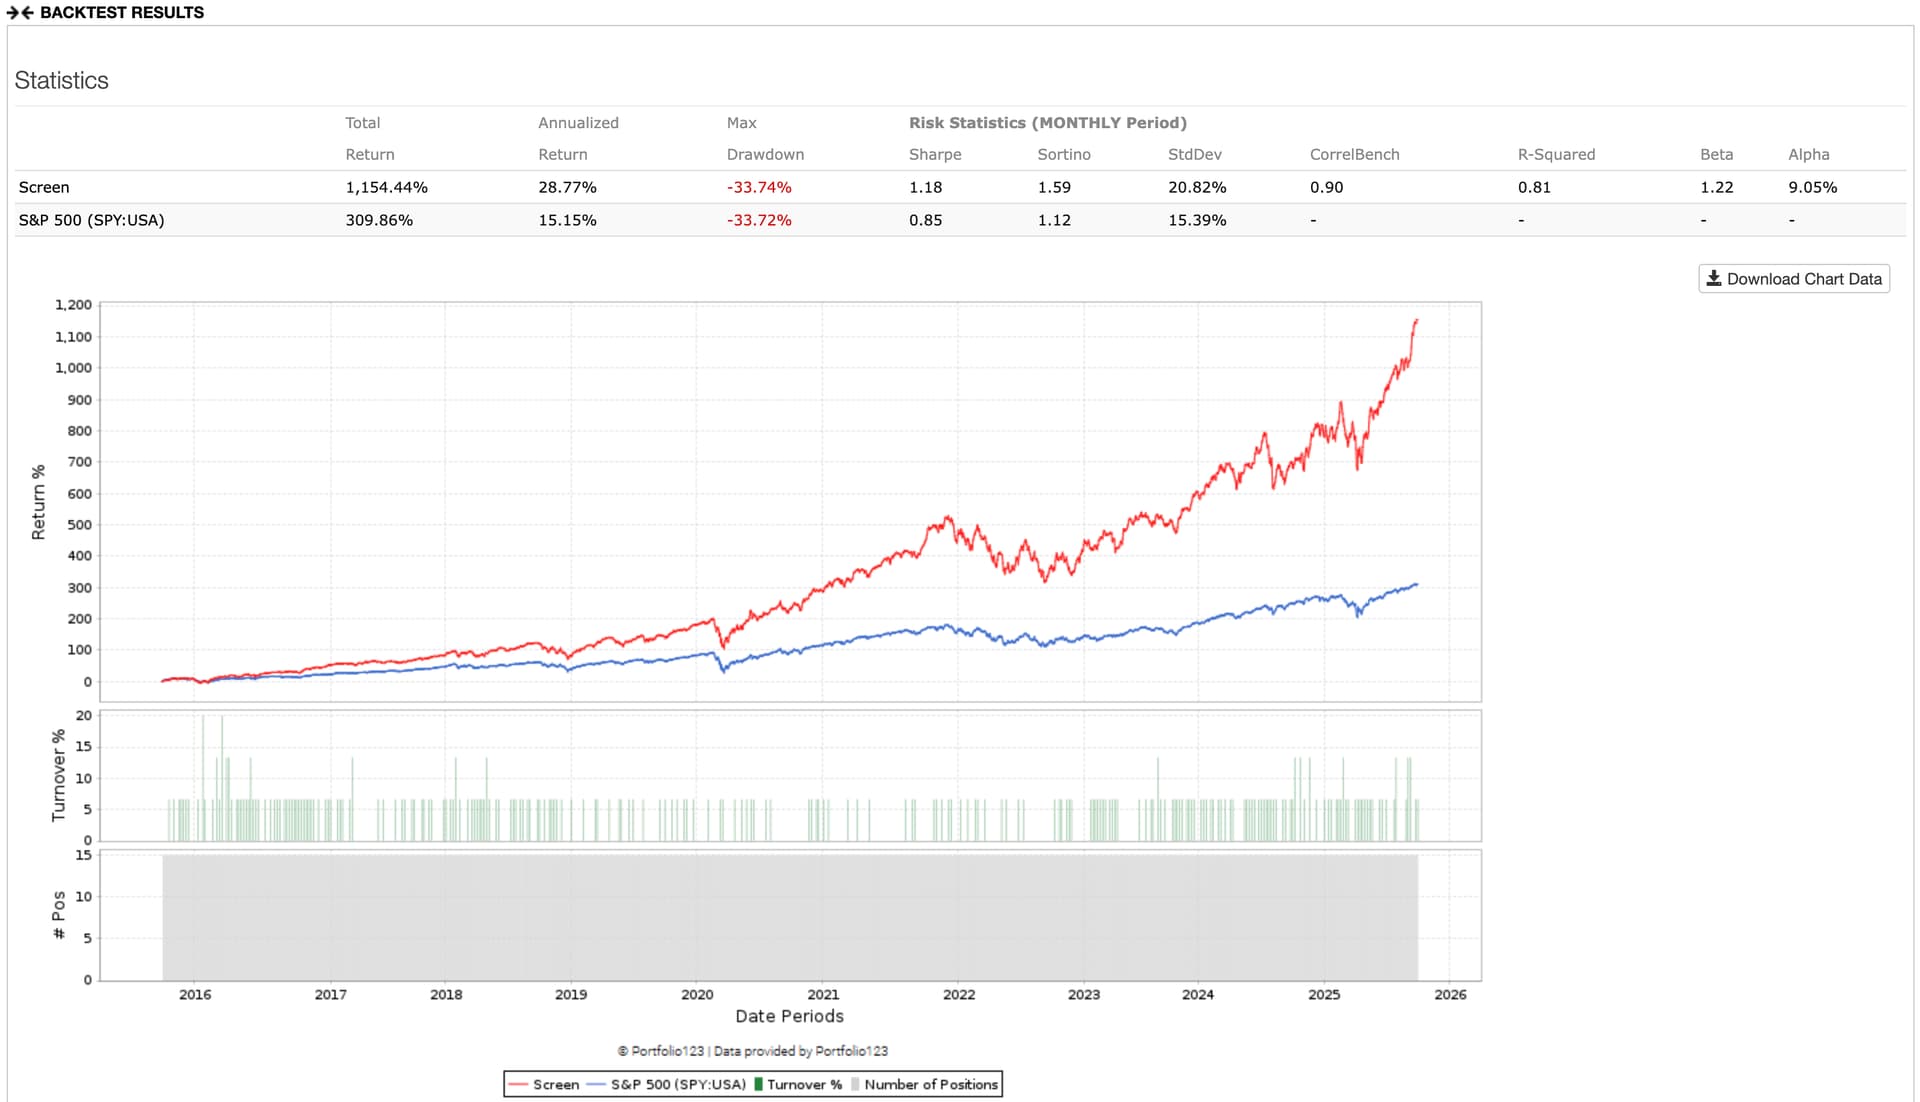
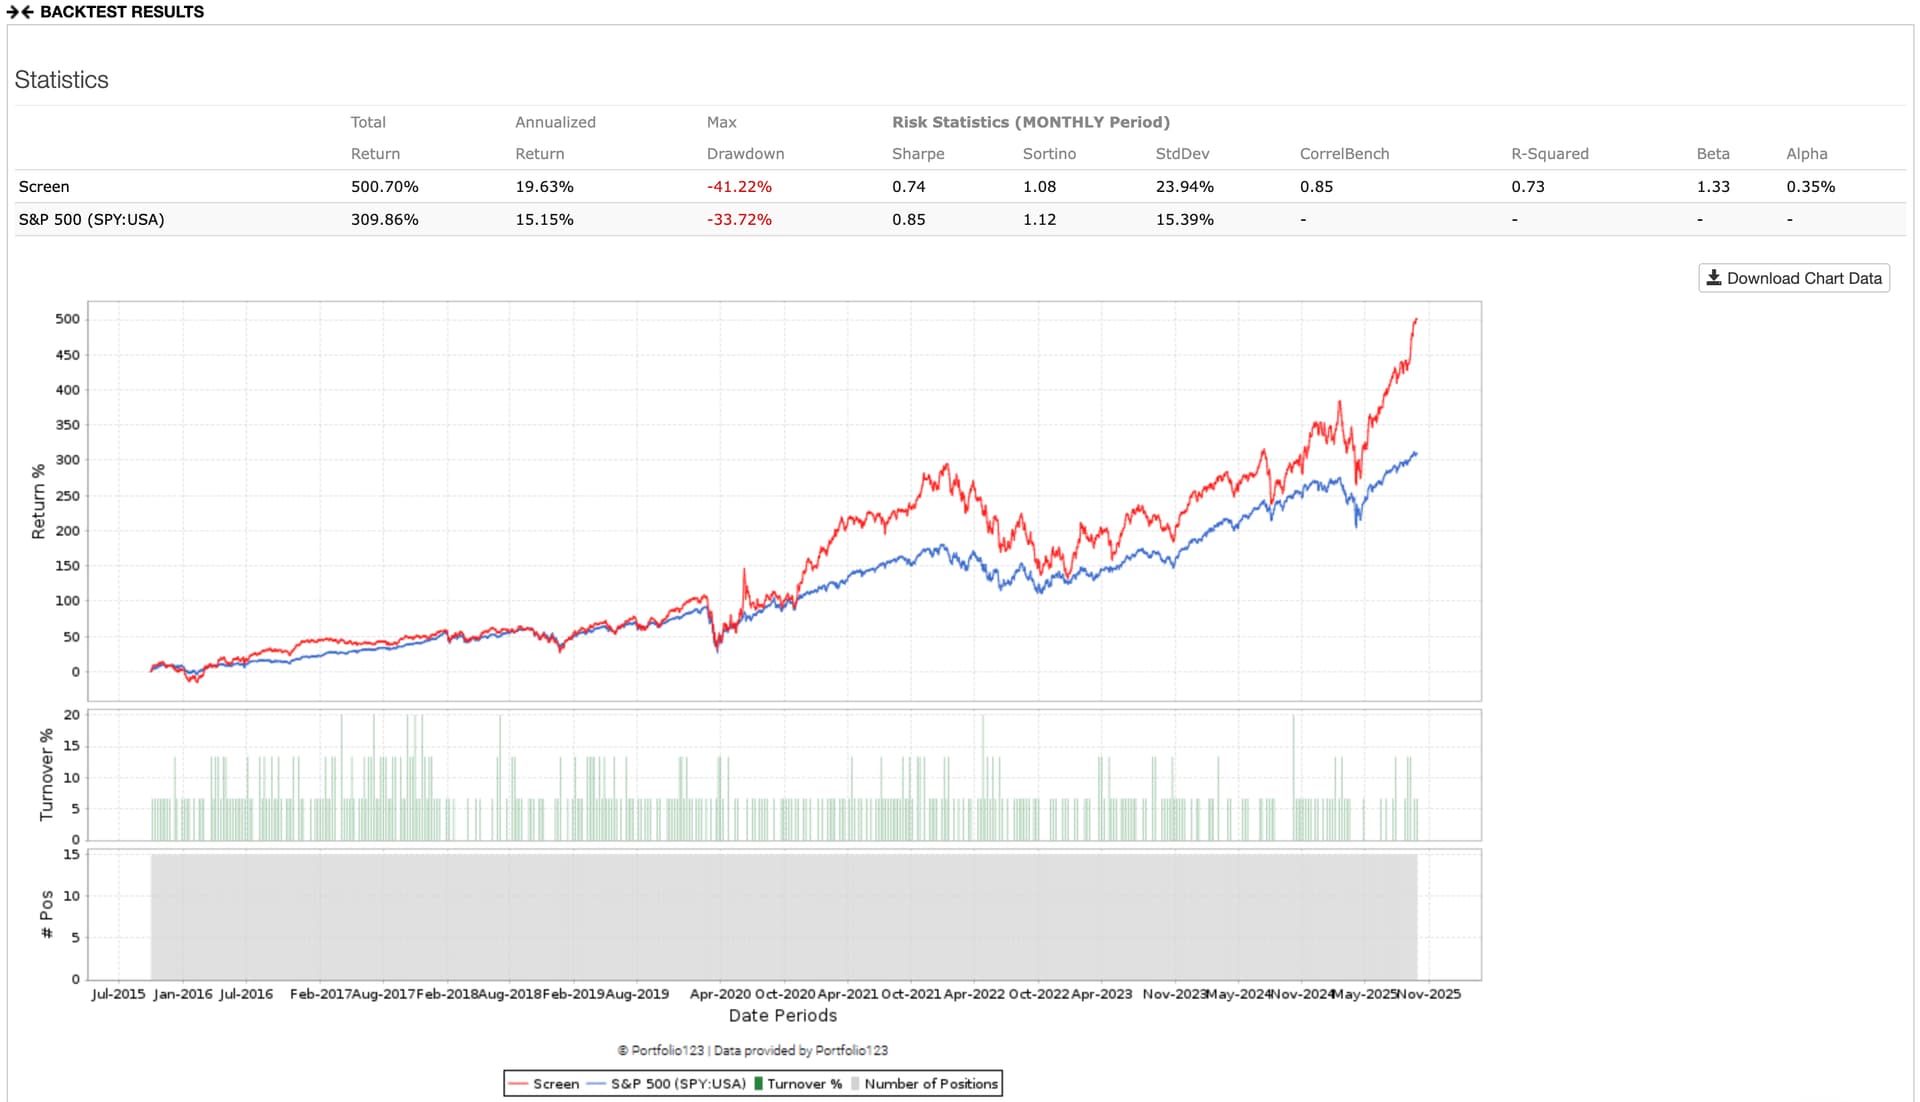
I agree that it is just not possible. Here it is a screen with EMA(21,0,#Vol) as quick rank in the SP500 universe for 15 stocks keeping slippage. I don’t think a single technical factor can do that with the SP500 (easy enough to check my screen):
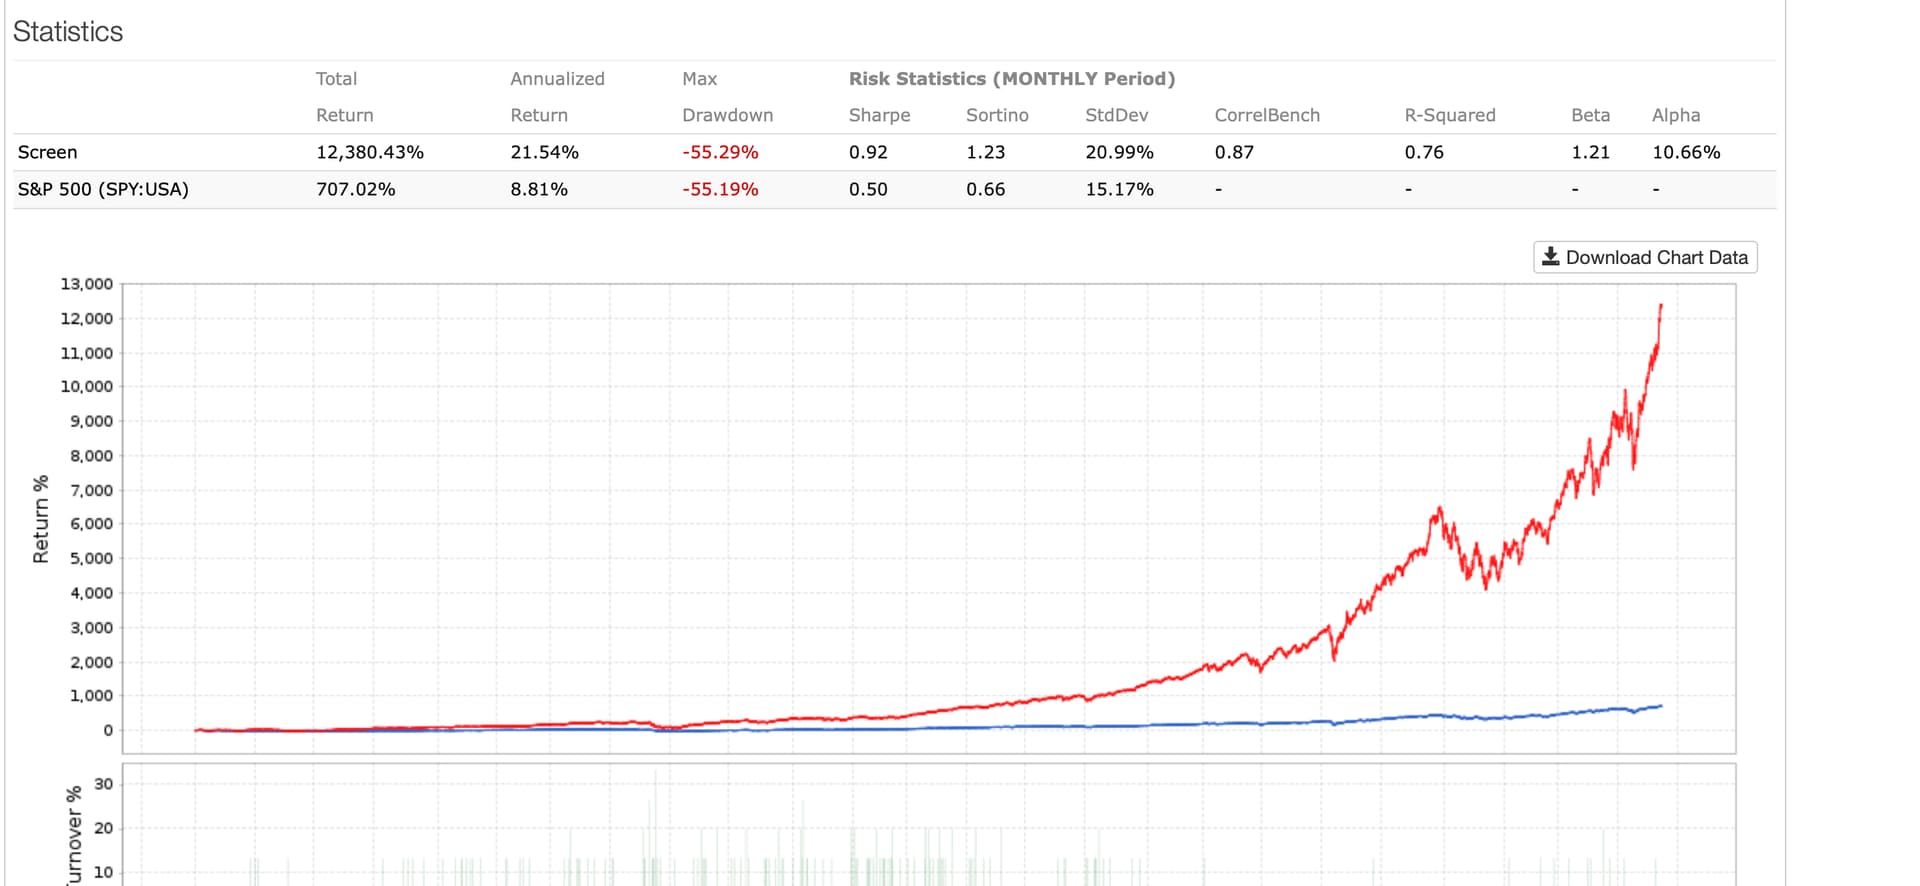
Last 10 years still seem impossible (first in the screenshots):
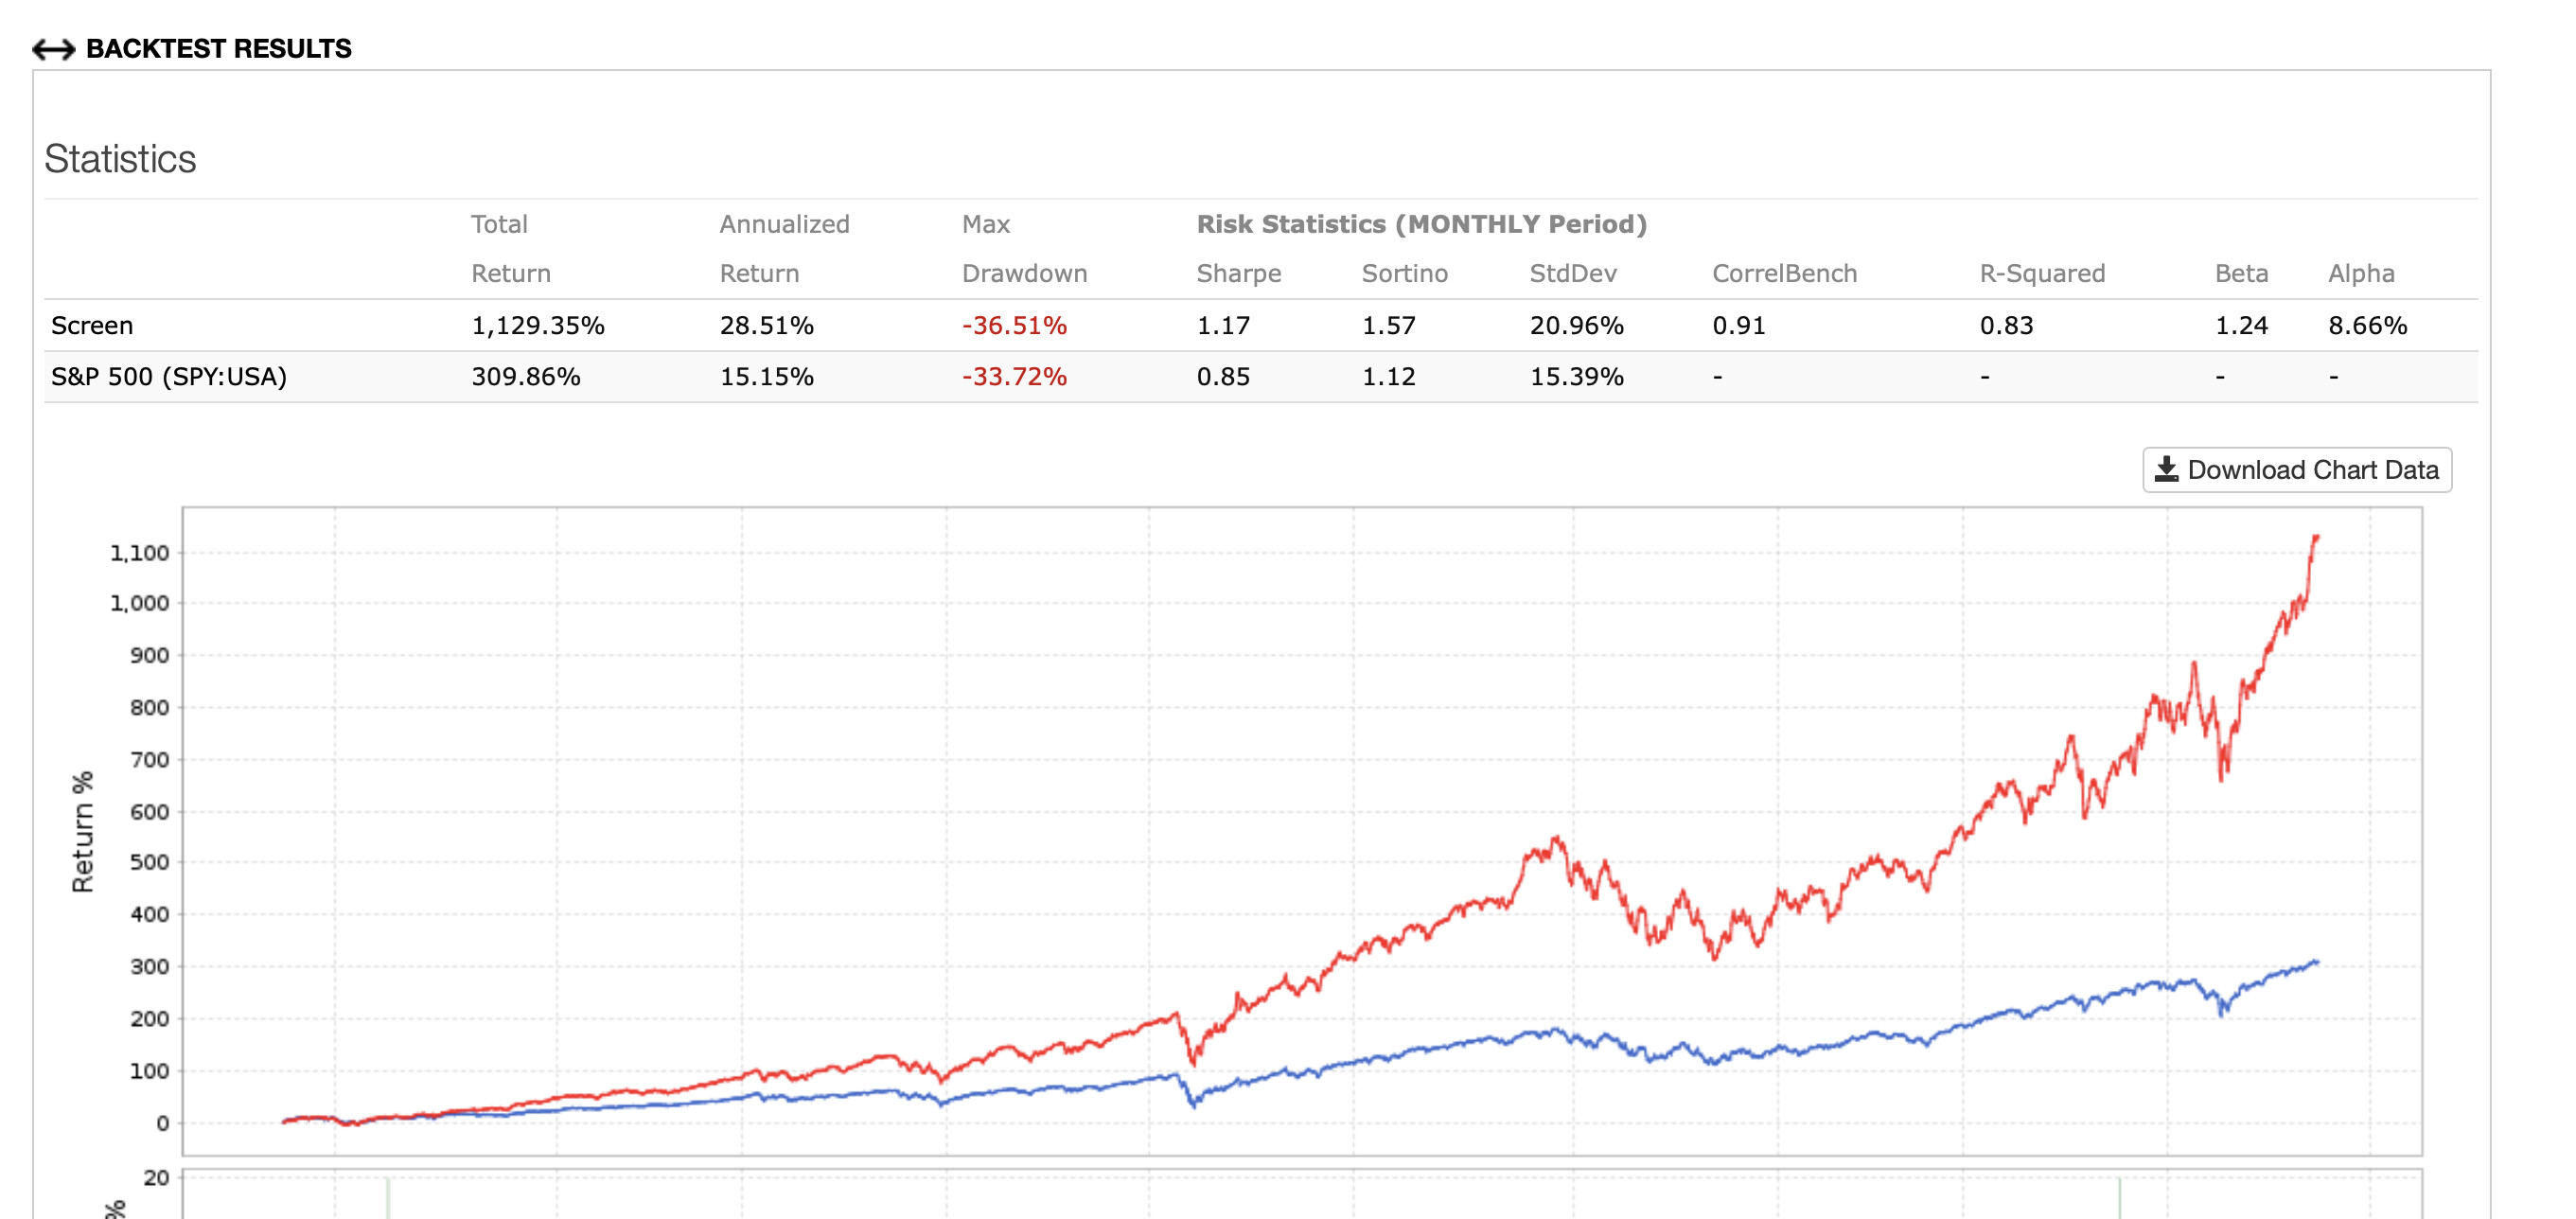
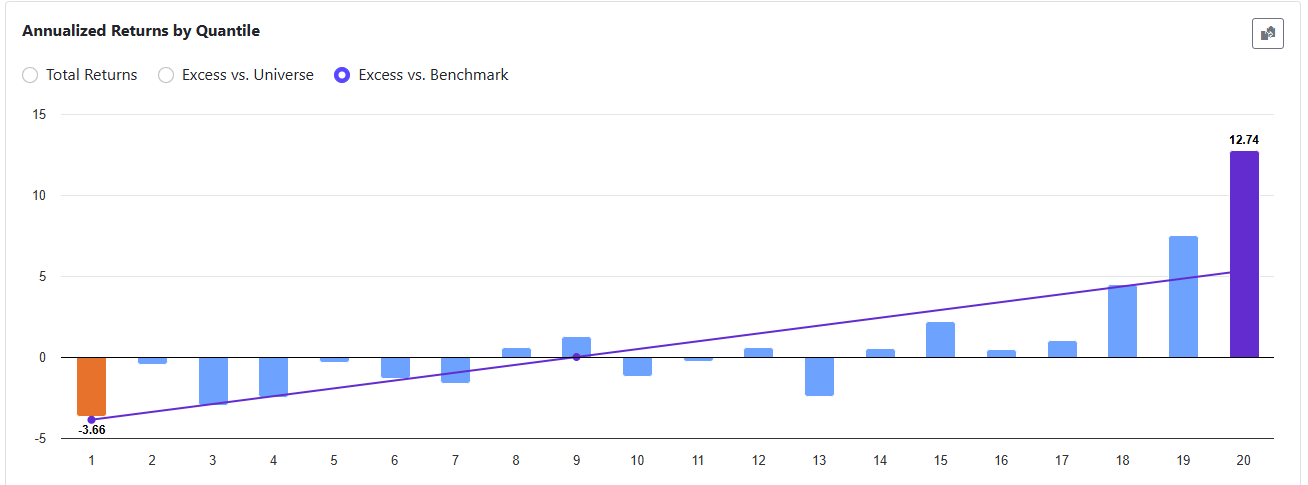
Let me provide another datapoint, to add to Jim’s, that would point to a cheating bug. If I take his same exact screen parameters, but change the quick rank to SMA(21, 5, #Vol) (introducing a 5-day lag to avoid potential snooping and using a simple moving average for simplicity), this single-factor screen still looks fantastic over the past 10 years:
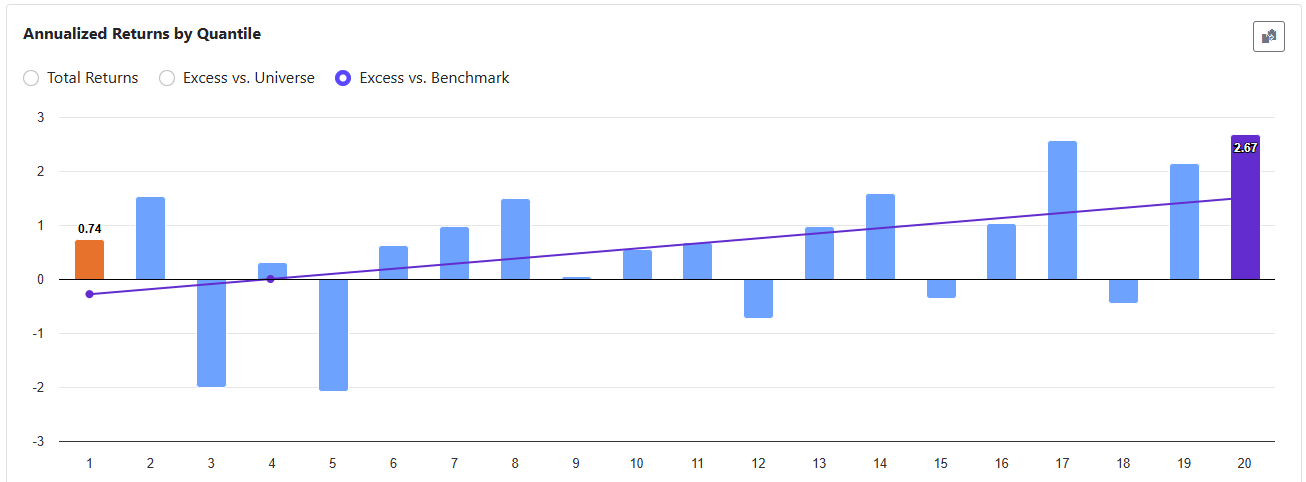
But if I now change the quick rank to AvgVol(21, 5), I would expect I should get a very similar result to SMA(21, 5, #Vol). Instead, the results are much more down to earth.
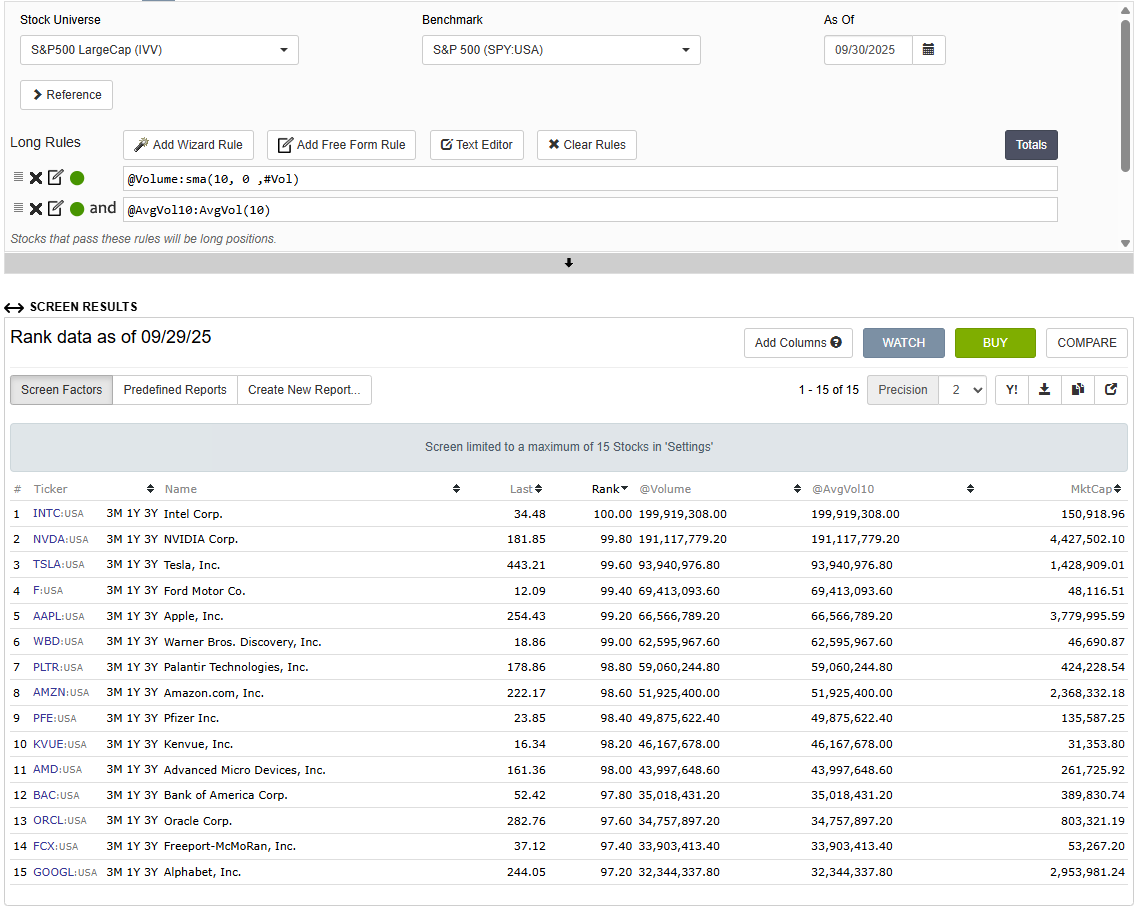
The factors “sma(10, 0 ,#Vol)” and “AvgVol(10)” gives me the same volume numbers in the screener. But if I compare the two factors in a rank test I get different results.
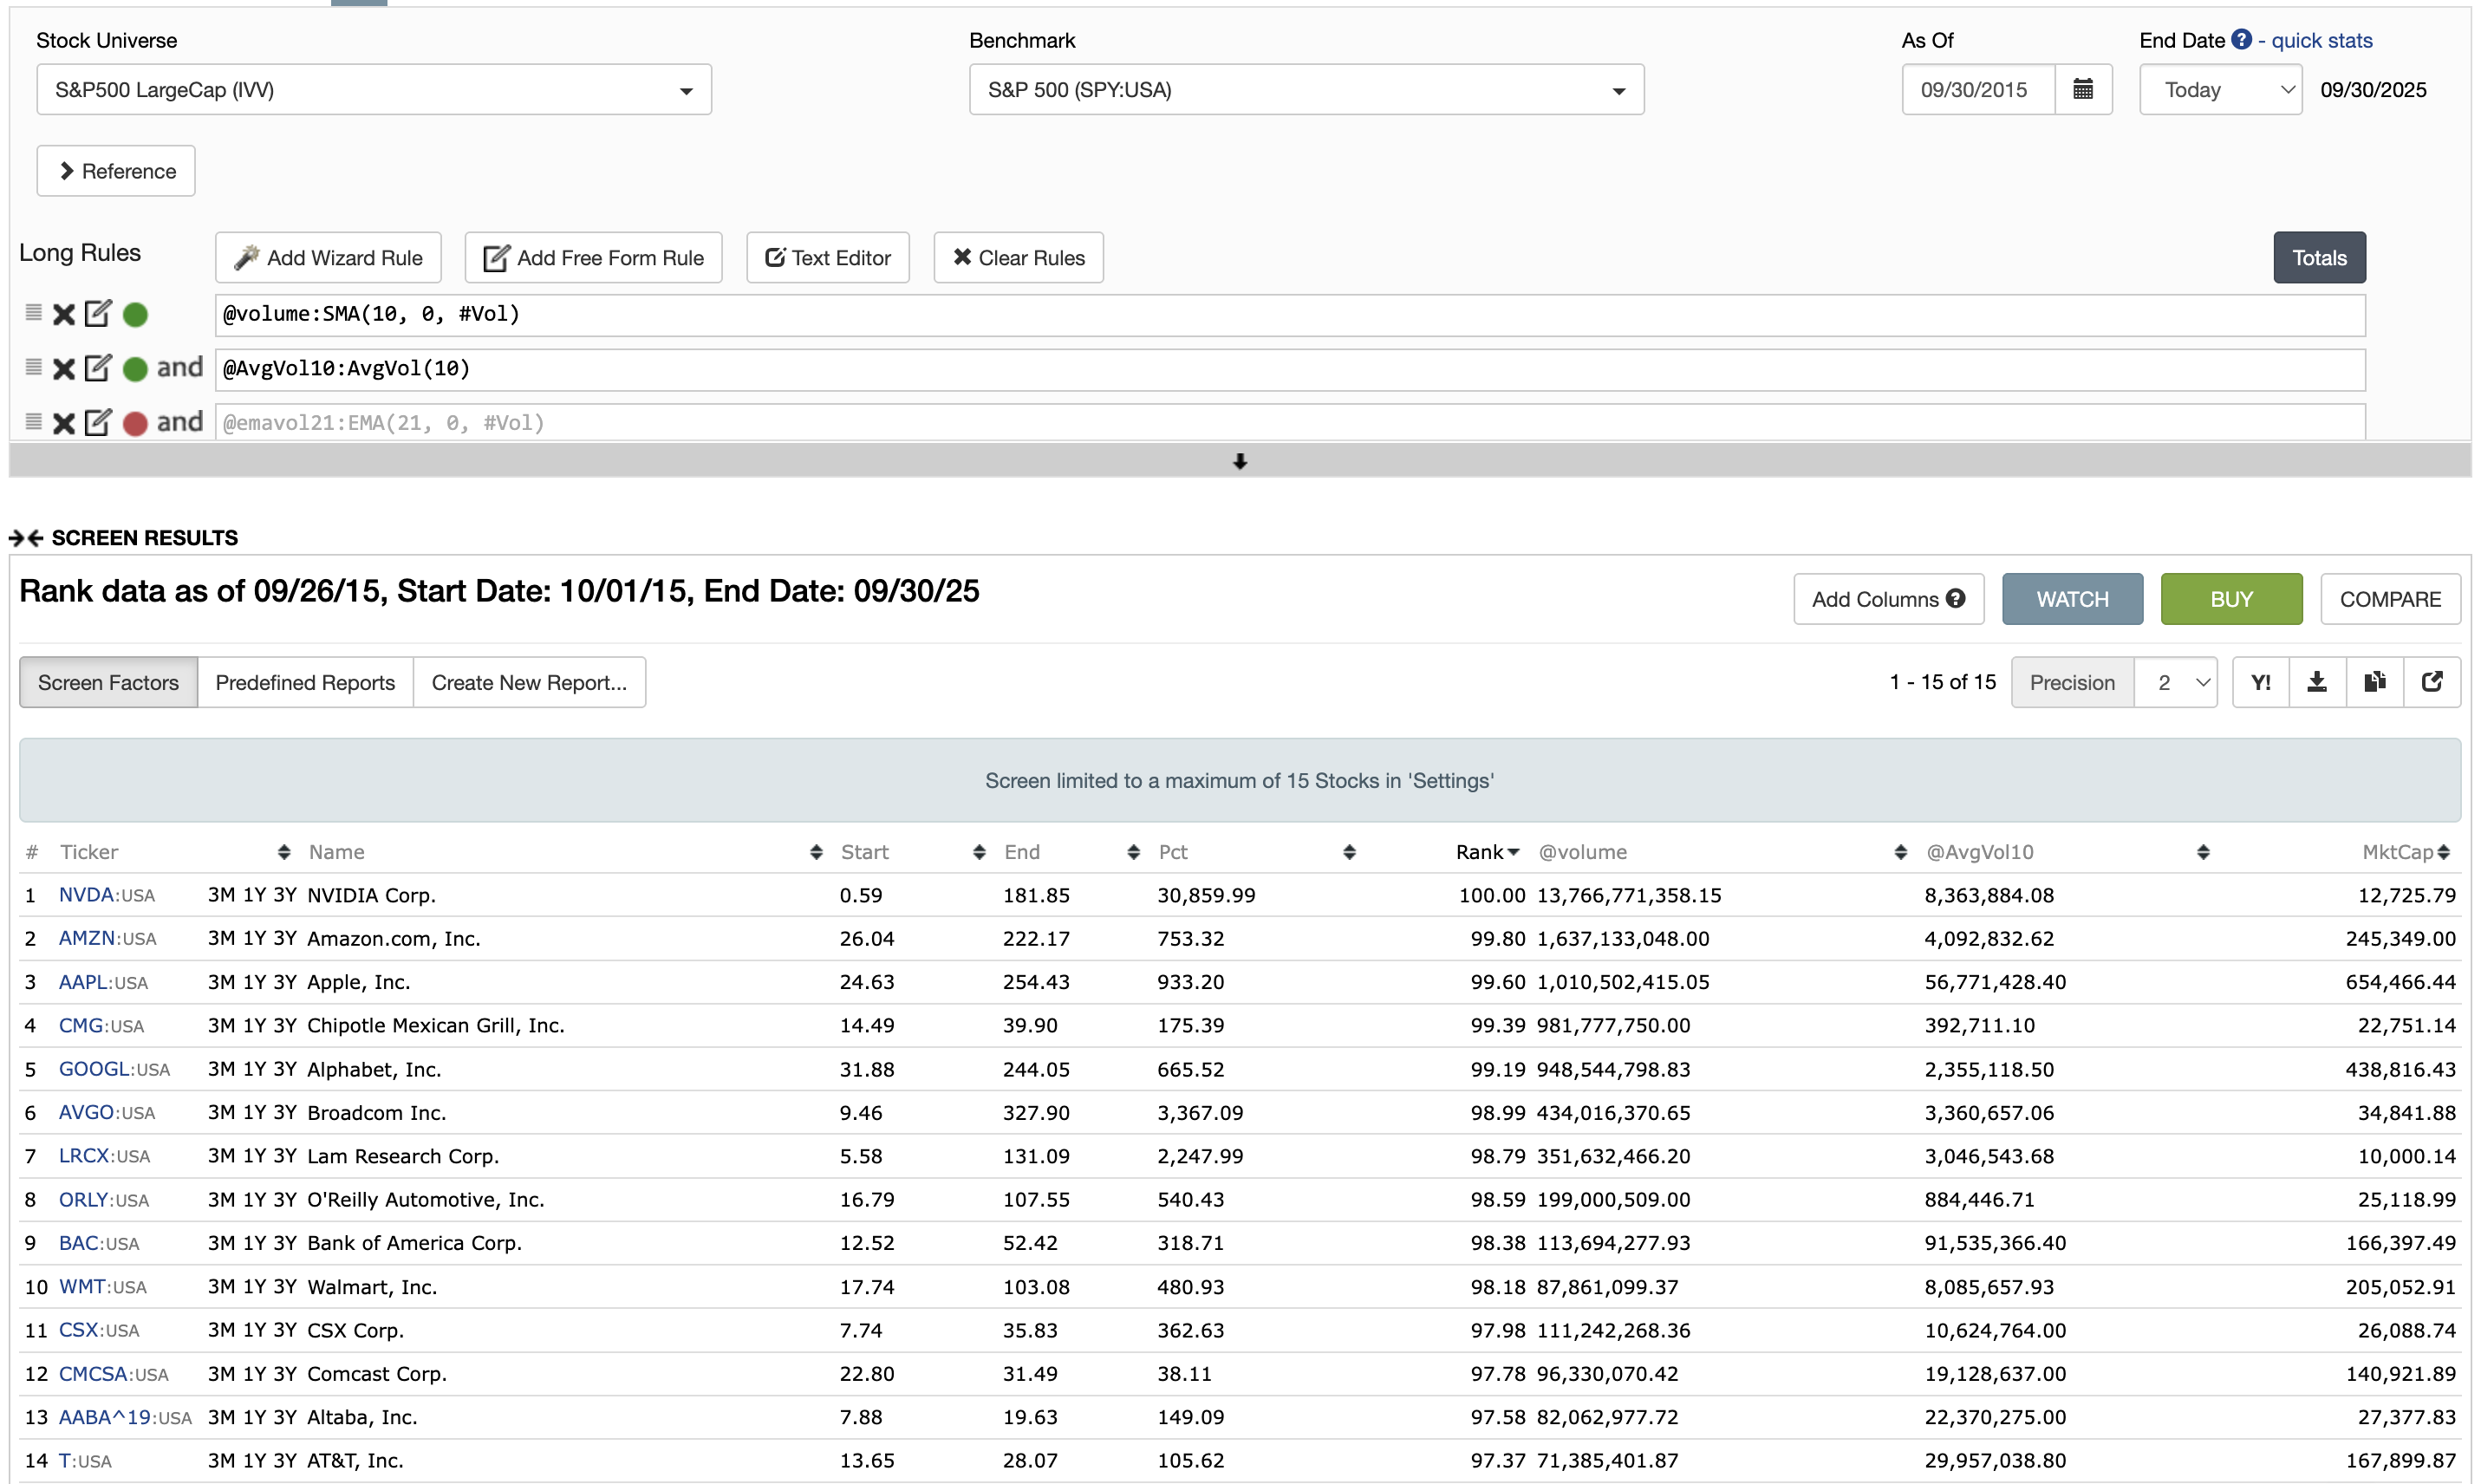
AlgoMan, if you set your screen date back to a historical date, you will see that the SMA(10, 0, #Vol) and AvgVol(10) calculations will diverge. For example, on 9/30/2015:
This is a truly fascinating bug. If I run a screen as of ten years ago today, 1,171 out of 3,727 stocks have SMA(10,0,#Vol) = AvgVol(10). The others are way off. 90% of the time, when SMA does not equal Avg, SMA is larger than Avg. I tested with FutureSplitFactor, and splits have nothing to do with it. Neither does StockID (I thought perhaps stocks with higher or lower IDs might be more susceptible to this, but no). I also tested to make sure that AvgVol(10) was accurate, and indeed it was. The median market cap of companies with a divergence between Avg and SMA was significantly higher ($1.8B) than the median market cap of companies with no divergence ($620M).
Problem found. The SMA, EMA, etc, are adjusting for Point In Time (PIT) the volume series as if it was a price series. This means it was:
Multiplying instead of dividing future splits
Adjusting for future dividends
Doing FX
Guess nobody used #Vol in moving average functions? Key lesson is important: if it seems too good to be true it's probably not right. Thanks @Victor1991
Should have a fix later today. Very sorry about this.
PS. this is not a new problem, has always been like this since we added series to MA's. Guess we never fully tested the volume option