I’m looking for s/w to plot the price of multiple stocks on a single chart. The price data should be normalized to the purchase price and, for each stock, the plot origin should start with the purchase date.
I can hack a google sheet solution but would rather spend the time elsewhere.
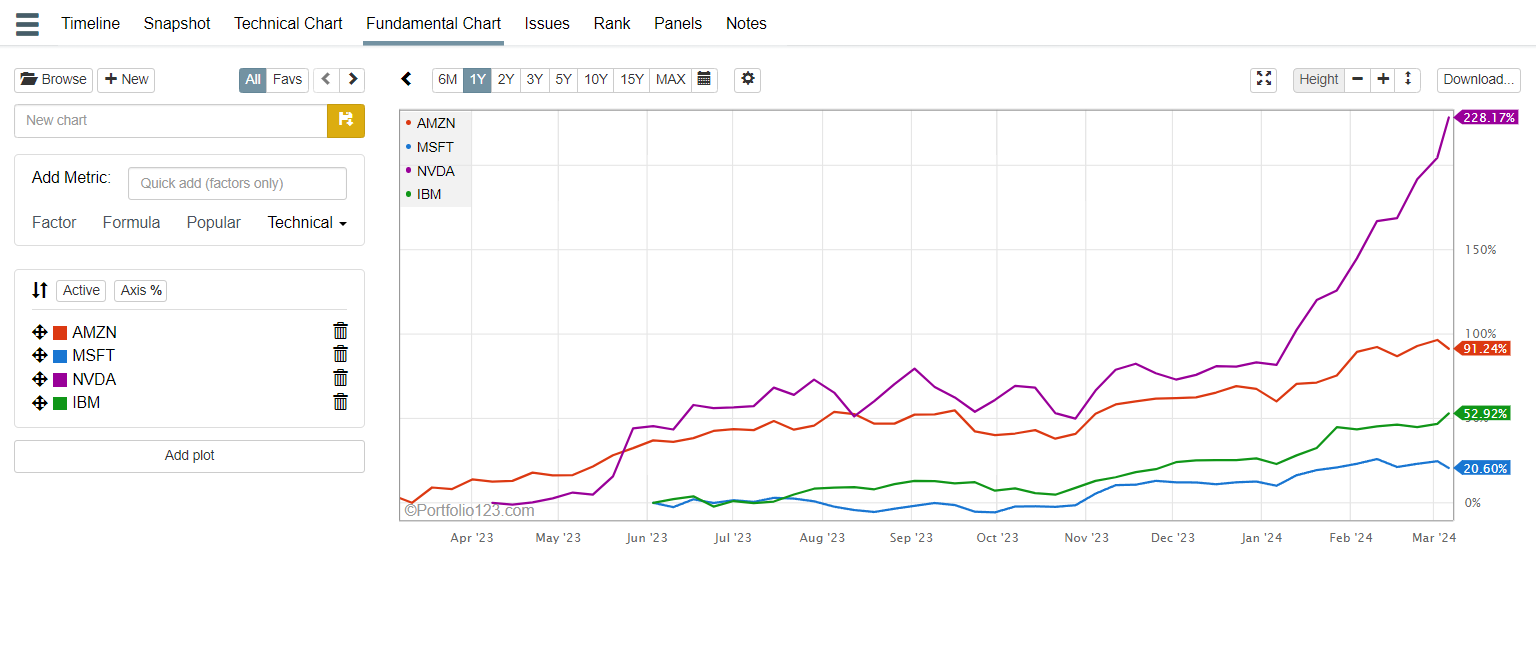
In reality watchlists are the closest thing you want. They have date added and date removed. Wouldn’t be too hard to modify the chart to use those dates.
Certainly getting closer to what I want. Now if all the curves could start at the origin. The x-axis should be days held and not actual dates.
Since this is for work outside of p123, I won’t ask p123 to modify any infrastructure. I expected something like this to exist somewhere, but I can’t seem to find it.
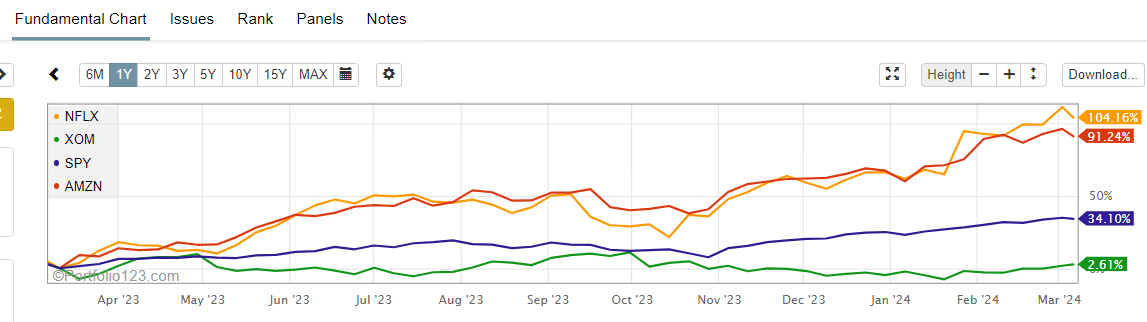
I’ll look at Fundamental charts. I rarely use it.
EDIT: On second thought maybe Marco’s solution is what I need. Thinking.