Does anyone have any experience with MOO orders? If one were to use this type of order on fairly liquid stocks (R3K or SP1500 types). would it be fair to run simulations with zero slippage and “Next Open” as the execution? Is there any real life slippage using an MOO order? Thanks.
In 2011, I analyzed slippage from market on open and market on close orders from an institutional account.
The account, which turned daily, paid ~10% slippage costs (over the published opening prices) per annum on the account equity. That equates to ~.027% cost per turn. The strategy used minimum price and $volume filters.
Please note that this was in 2011 when IB had a much larger edge over other execution venues. The execution playing field is much more level now, so I would expect that slippage costs have increased very significantly. In fact, IB took down its price improvement track record last week (due to Transaction Auditing Group). I assess that this change can be attributed to the observed decay in improvement (I would interested preserving this information if anyone can find it in the way back machine). To be fair, this was the expected result due to IB’s growth – if all participants use the best platforms and venues, then the asymmetry ceases to exists.
A more recent analysis of passive/relative order execution shows that I am on track to pay 12% per annum in slippage costs (~1.2% per turn). I imagine that this would be significantly more with more aggressive execution approaches.
//dpa
David,
Do you mean this? From their site January 1, 2018 or a day or two before (at most).
Another possible reason for not posting their numbers is they have always been poor. IB tries to spin it but the numbers end up being comparable to the FIF numbers you looked at. Any decline at all and…well you would stop thinking posting the numbers was a good marketing decision.
-Jim
Jim,
Actually IB had broken it down by month and year for the past several years, so the decay in execution advantage was easily observed.
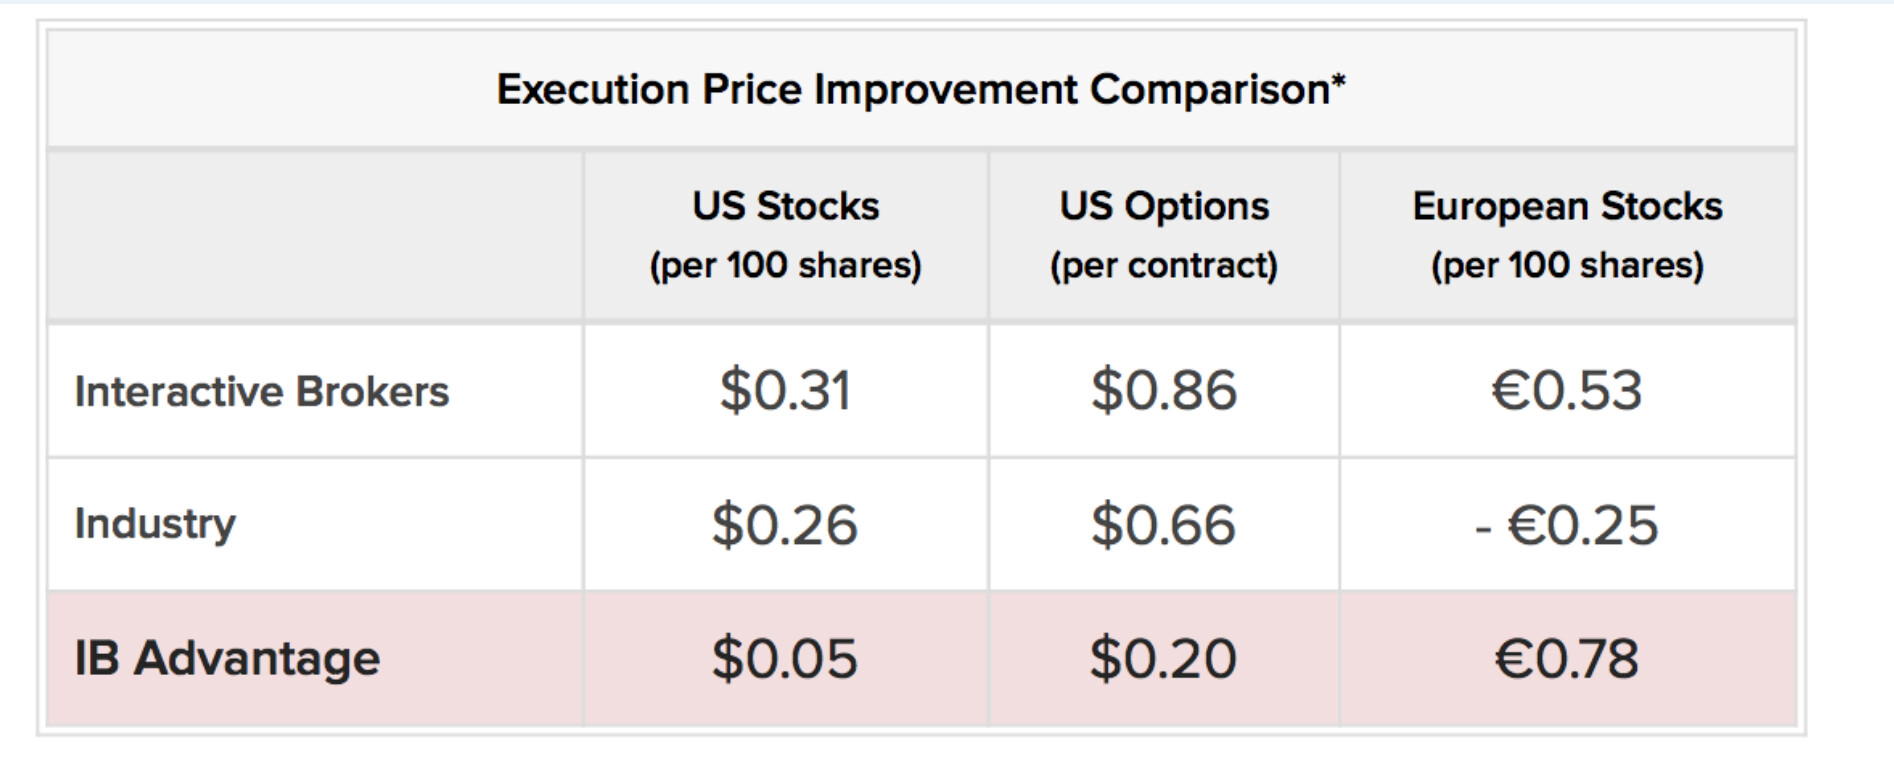
In the early 2010s, IB reported $.4-.7 price improvement per round lot (100 shares). I think the price improvement is currently in the low teens per round lot.
//dpa
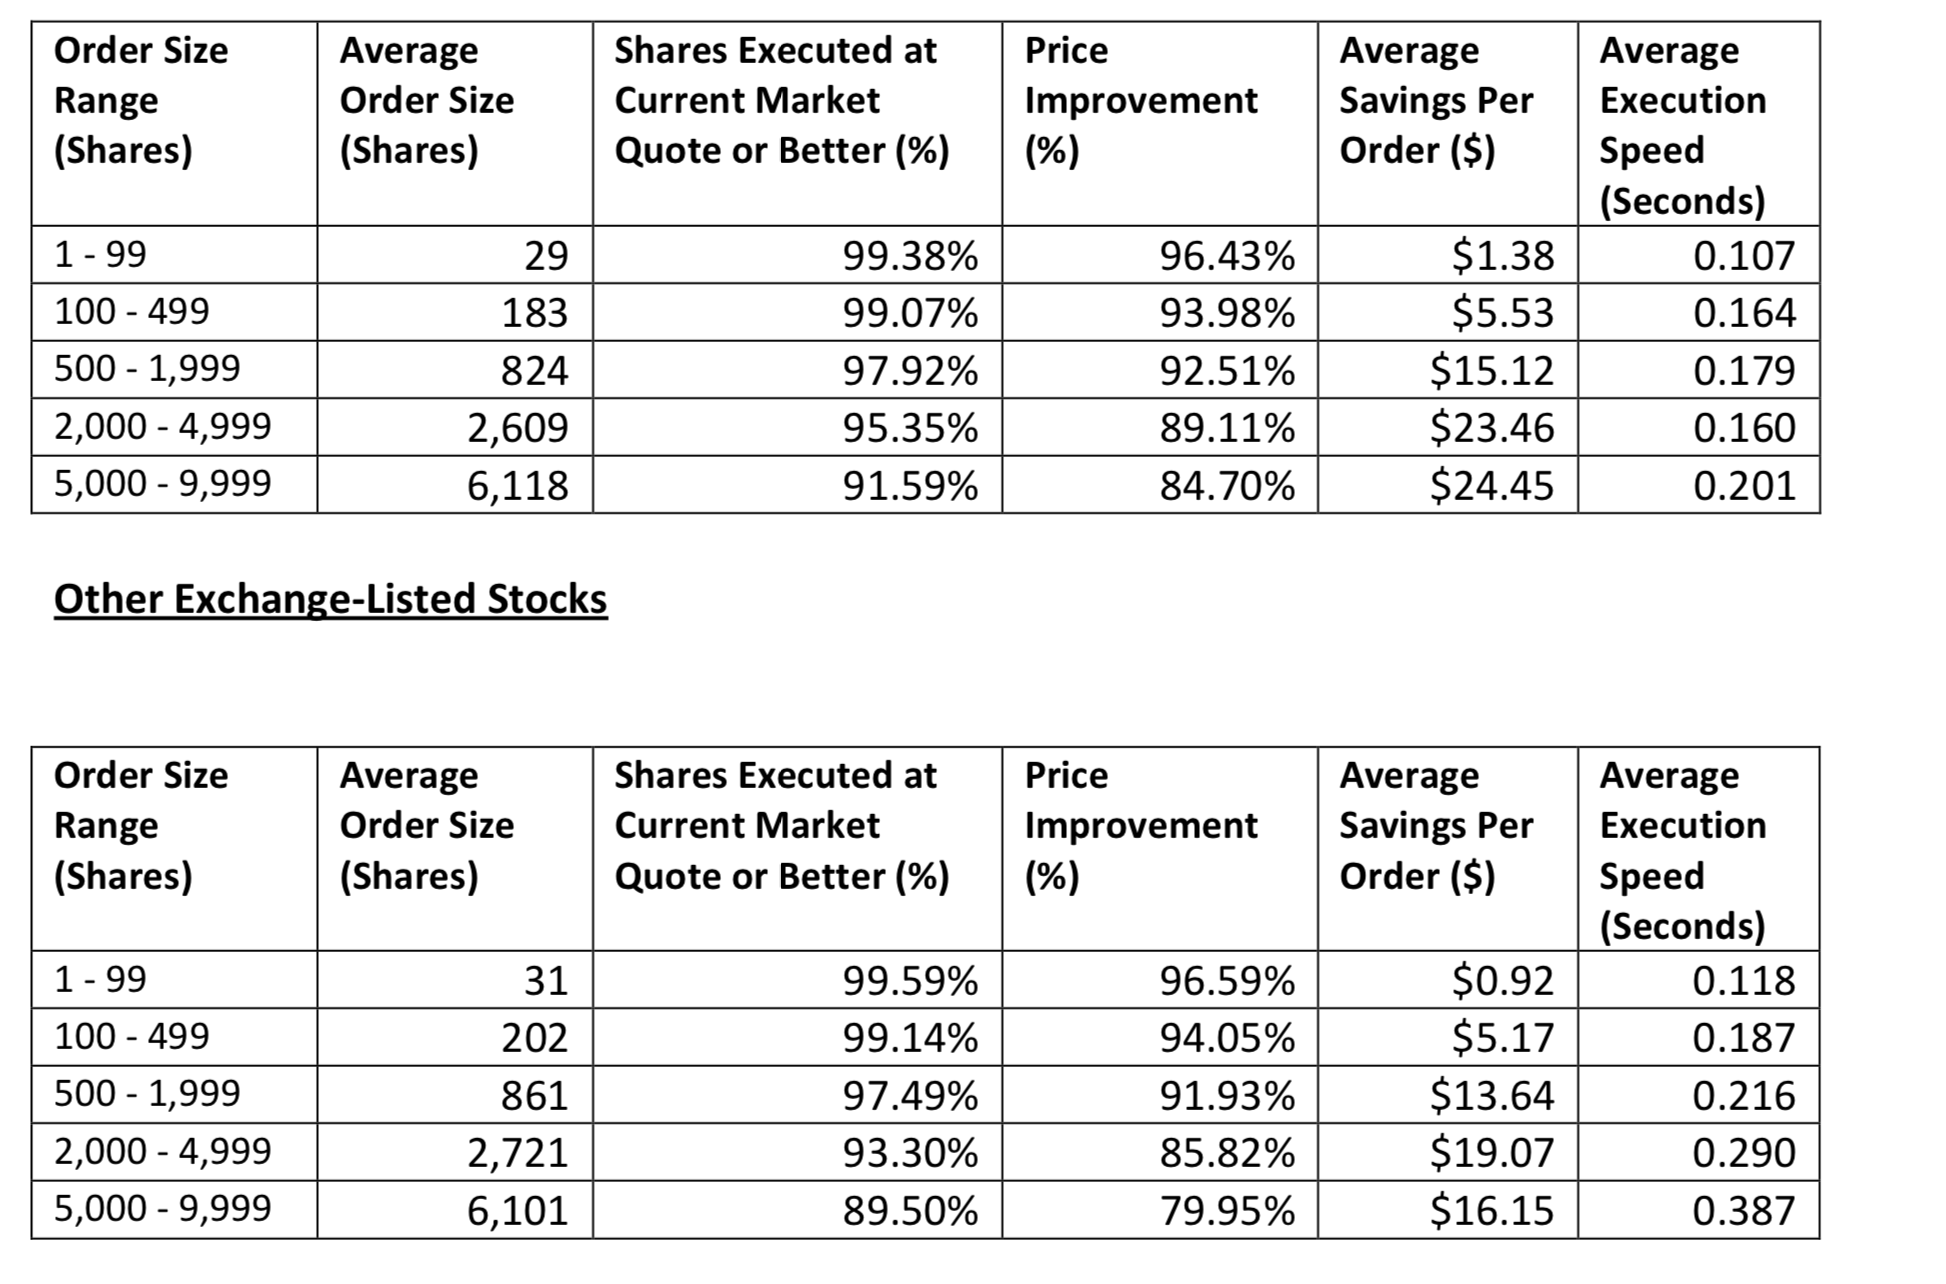
FYI. Another broker’s recent numbers. If you find these numbers interesting at all, I am pretty sure you can do the math without my commentary. These numbers are for the first quarter of this year.
-Jim
Thanks guys. Much appreciated feedback. Further research shows that MOO orders seem to get you the NYSE opening print, but that is not necessarily the actual open price from other exchanges. Slippage remains a system killer for smaller cap higher turn strategies. Thanks again for the detailed responses.
SEC rule 606 requires some disclosure of how trades are routed and who may be getting paid for routing.
You have to do a lot of digging to find some of the information at IB.
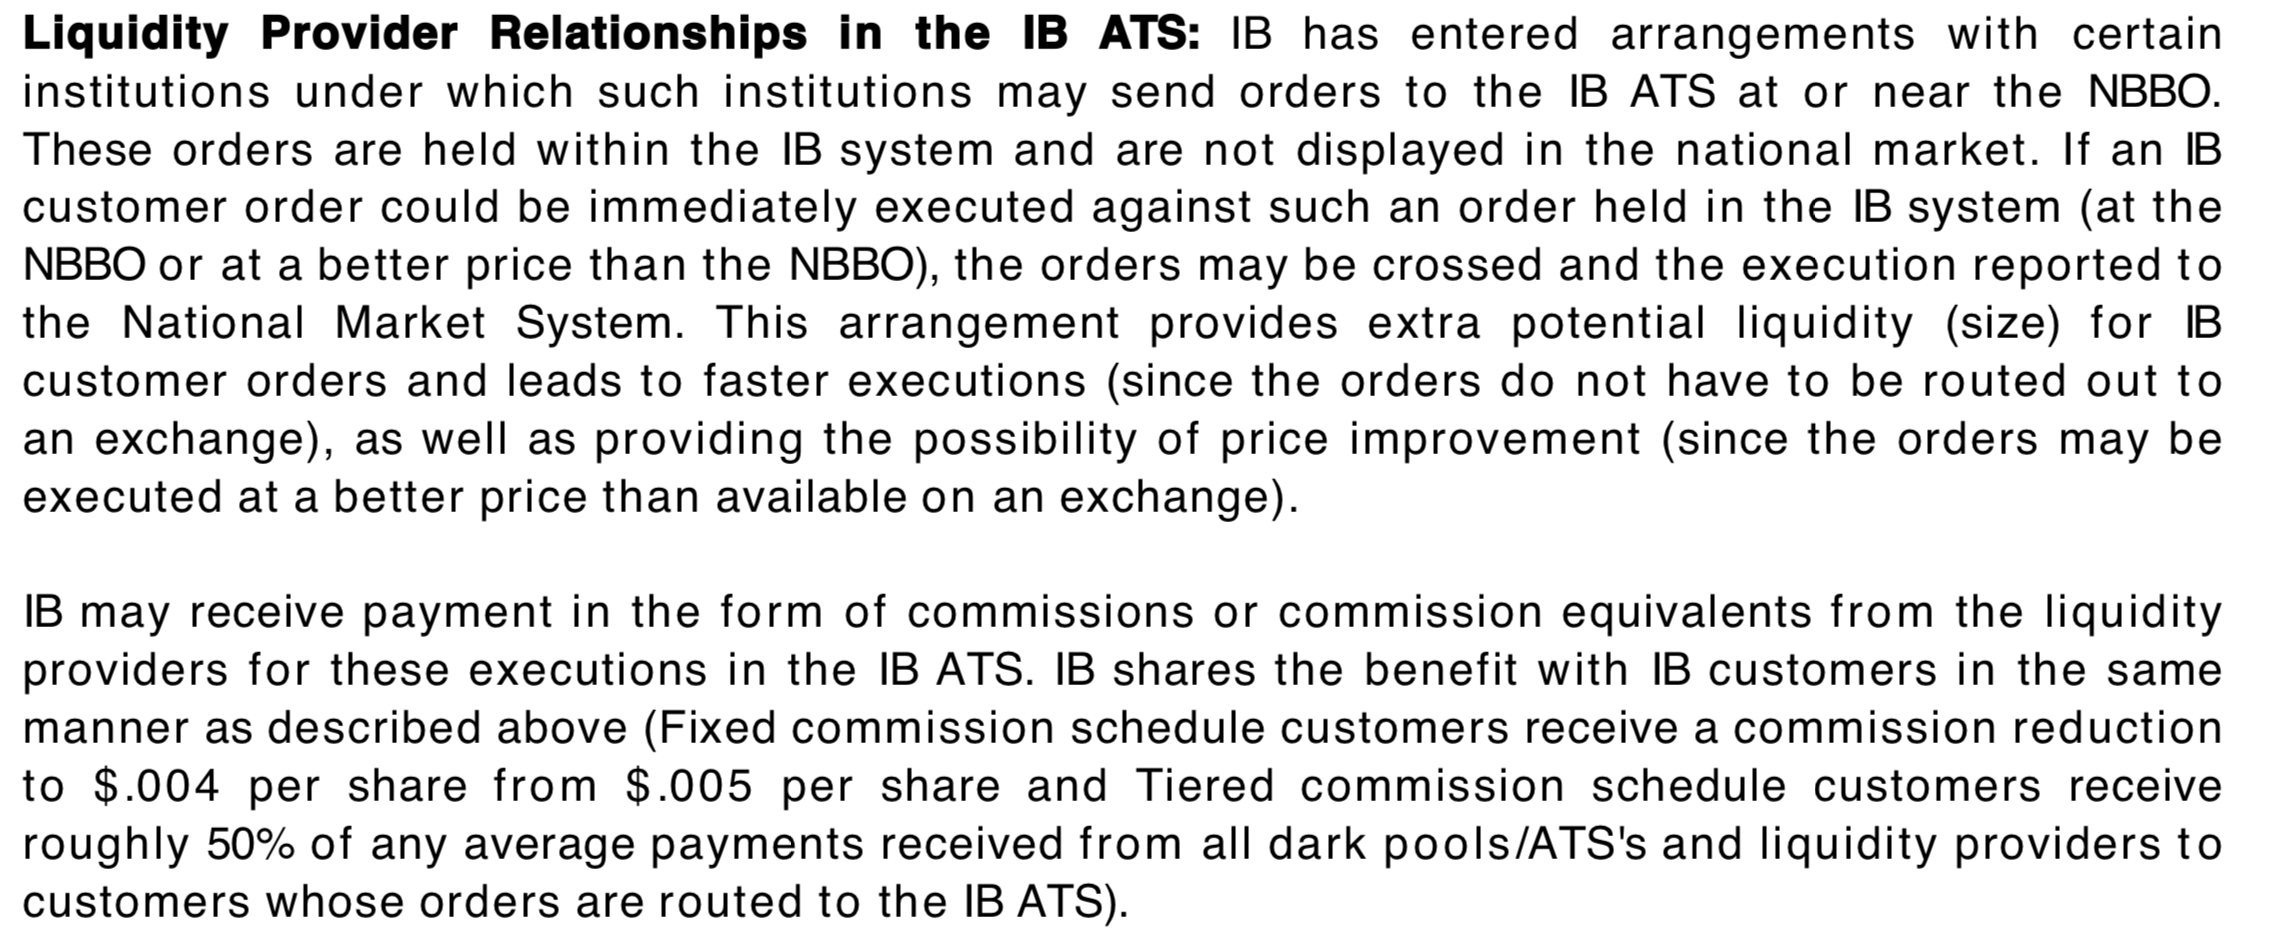
Once found, I think you need to build a timeline and perhaps hire an attorney to figure it out. See below.
Is your order executed at or near the NBBO? Your benefit being quick execution and some sharing of fee paid to IB (about 50% of this fee if you are on the tiered system). The order is crossed later?
I read that the “IB customer order could be immediately executed against such an order held…” Emphasis on “immediately executed” is mine.
Immediately suggests, to me, that any crossing occurs later. Maybe I am getting a good deal (sincerely). But really I want to participate in the cross, I think. I guess that cross trade I want could come with an algo (with no sharing in the payment here)? I pay a full commission to IB for this cross trade?
But I am honestly not sure: I am still building the timeline and I am on hold with my attorney. Even when I talk to a grammar teacher I find the language is vague: intentionally so? It does sound a little more complex than it needs to be. Why?
Me, I would probably put on the homepage: “When possible we cross your order AND give you a rebate on your commission just for using IB” If I could put it so simply. But it really is a little more complex than that I think. And probably hidden in the disclosures for a reason.
Some suggest that there is a correlation between these types of payments and how much price improvement one receives. What do you think? Why does the SEC require this type of disclosure in the first place? This is a little complex—so I do not know about this—but generally payments for routing are not allowed in Europe. Why?
If I have a point it is only that I do not know why IB has price improvement that is declining but I am hesitant to come up with a simple solution that is not supported by evidence. But no fear: I am still building that timeline and will give a full report when I understand it.
-Jim
I think there would still be slippage for sure. To determine slippage, you would need to peg your MOO price compared to yesterdays close versus a benchmark of yesterday’s close to the open price.
If your order went through at a 5% premium compared to yesterday’s close, and the market is up 1% at the open versus yesterday’s close, you can assume that at least some of this is slippage. You’d have to average this over many trades to determine how much.
But your live portfolio will not show ‘slippage’ as a function of ‘open price plus a premium’, just that the returns drop dramatically from simulation to live portfolio. Hidden slippage.
There are some semantic differences in our threads.
I define slippage as the price discrepancy between fills and the print. This is easily measured by comparing the fill price versus the expected price (e.g., open, close or volume weighted price).
I define market impact as the moving the print. Market impact is much more difficult to quantify since it invookes the uncertainty principles (i.e., how does a photon behave when it is not being observed? Likewise, what would’ve the published price been had I not traded?). For this, I advocate Kurtis’ approach — e.g., taking the average price changes over some interval before and after order submission. These average drifts are only meaningful in large samples and when compared to comparable drifts.
David,
If you mean with my posts you may be right. The fill is obvious. As far as the “print” I am not sure what you mean. I take the mid-point between the bid and the ask and compare that to my fill.
Nothing wrong with taking the last price and comparing it to the fill but this adds some noise as the last price could be at the bid or the ask or something else. It works but there is a little more noise and it takes a few more trades to get to the final answer with high confidence.
This is how Nassim Taleb defines slippage according to Wikipedia:
“Nassim Nicholas Taleb (1997) defines slippage as the difference between the average execution price and the initial midpoint of the bid and the offer for a given quantity to be executed.”
Very true.
So this is a problem dealt with in any statistics problem. If I give someone a blood pressure medicine and the pressure goes down was it the drug, a placebo effect or maybe it would have gone down anyway for reasons I do not know.
Any text book can be used to find general ways of dealing with this.
One good way: Find the midpoint of the bid/ask spread. Flip a coin. Make a trade (or not) based one your randomization (the coin flip). Measure the mid-point of the bid and the ask afterward. Record the difference. This is like recoding the blood pressure before and after giving a medication or a placebo.
Do this until you have a sample the size you want.
Run an unpaired t-test on the 2 groups. Specifically compare the difference in prices before and after the trade in the “trade” group where an actual trade was placed. Your “placebo” or control group is the group where there is no trade made. Compare the difference before and after no trade was made for this group also. Run the 2 groups—the trade group and the “placebo” (control) group–in an unpaired t-test.
The quantum mechanics analogy may not hold up here. When you look at the prices without making a trade you may be able to assume that you are not affecting the price by just looking at the price—unlike a photon in a quantum experiment.
But you make an EXCELLENT point. If you do this without a control or a placebo you could be fooled about how much impact you are having. Maybe you pick great stocks in your port that naturally increase in price during the day: with any price impact having nothing to do with the rising prices. And who knows what the dogs you are selling (but used to be great stocks) naturally do without a control group to better understand the natural tendency for these stocks in your port.
David,
You make an extremely important point here, I think. If you go from the close to the next open there is a lot of noise. So much noise that what you say is true: “only meaningful in large samples.” In fact, the sample required to draw any conclusions may be so large that in practice you will never complete your study.
On the other had if you have some interest as to how much price impact there is 1/2 hour after the trade the sample does not need to be that large in my experience. But what if you have to know at 3 hours—well you will need a larger sample than for a study of 1/2 hour after the trade. No way around that. You will just have to take this into account when you "design’ your study.
You are exactly right. You may have to comprise by measuring a shorter period than you are really interested in. Maybe measure 30 minutes or an hour and say the price impact will be less in 4 hours or the next day. But never know exactly what it is at 4 hours—you will just know a maximum or ceiling for the impact at 4 hours.
Basically I am saying your point is 100% correct on this and I have little to add to this important point.
I would DEFINITELY appreciate hearing about any better ways, problems with my method and where I may have deviated from convention terminology. I certainly want to be speaking the same language no matter what techniques we each choose to get a handle on this.
-Jim
We trade VWAP working several hours into the close. What typically happens is that whatever price discrepancy between our average price and the close on one side of the trade is almost exactly offset by the discrepancy between our average price and the close on the other side of the trade. If our buys have better average prices than the close, our sells typically have worse average prices by nearly the same magnitude. And vice versa.
It is rare for us to see more than a 2 basis point (0.02%) difference in the total net slippage (as defined by our fills vs the final print) across all our buys and sells, and that can be plus or minus.
As a result, I build ports using next day’s close. I assume variable slippage just to be conservative, but in reality even a 0.1% slippage per trade is grossly overstated in my experience.
Parker,
I am sure this works great for large caps.
For some stocks measuring the print AFTER the trade could throw the results off. There will be some price impact that keeps prices elevated for a buy or depressed for a sell for a while after the trade.
Price impact, that David alludes to, has a temporary and “permanent” component. The temporary component decays exponentially and may not last long. The “permanent” effect has a small residual at even 20 days—but clearly lasts through the day. This price impact—both the temporary and the permanent— as well as the BID/ASK spread are what causes slippage.
To be sure that this price impact is not causing misleading results for small caps one would want to compare the fill to the print BEFORE the trade.
What your results prove is that 2 basis points of the temporary price impact you create with your trades is gone by the end of the day.
Using the opening price for the print would prevent any potential problems from price impact.
Also any measures of your trades against the VWAP for the day can cause similar problems. Your trades have an effect on the VWAP!
Probably all just theoretical. Glad your slippage is such a small factor!
BTW, have your tried placing a trade on-the-close to see if some of that 2 basis point improvement in price remains?
-Jim
And most of our holdings are Russell 1000-ish.
Have not tried using market on close orders. For one, they’d be awfully large. The benefit of using VWAP on larger orders is to diminish the potential market impact you speak of. Second, we are pleased with the slippage as is.