Market Timing

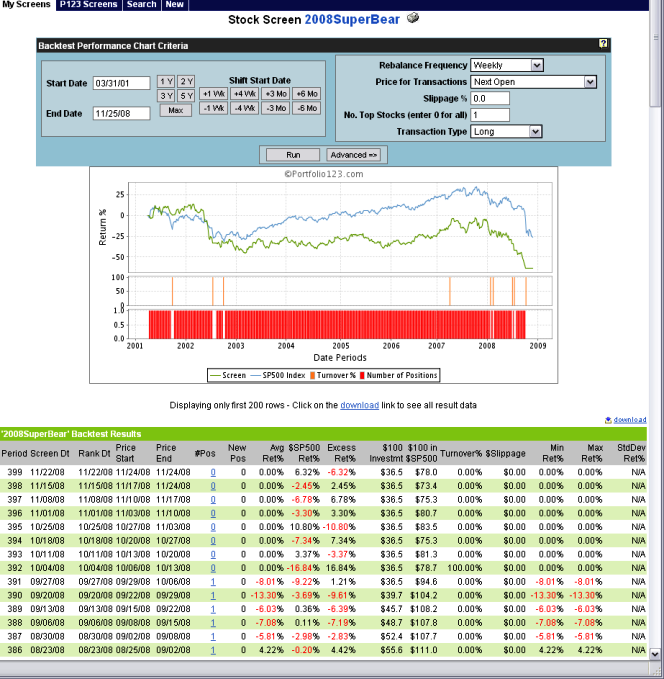
Since I am convinced that I can’t determine the market direction, I am trying to develop Sims/Ports that, in effect, do that for me. I have tried to develop Sims/Ports that use various market timing approaches to try and limit my max drawdown without reducing my annual gains very much. This is sure a lot easier than me trying to determine which way the market is going. I have been using 3 variations of market timing (that I have discussed in previous posts) in most of my ports. They are:

  1. Buy Rule; BenchClose(0) > sma(15,0,#Bench) or sma(15,0,#Bench) > sma(50,0,#bench)
    Sell Rule; Rank < 101, and I set “Allow Sold Stocks to be Re-bought at current Rebalance” to Yes.
    In some Ports I use the Sell Rule; (15,0,#bench) and sma(15,0,#bench) < sma(50,0,#bench), and I set “Allow Sold Stocks to be Re-bought at current Rebalance” to No.

  2. Buy Rules; BenchClose(0) / BenchClose(5) > 1 or BenchClose(0) / BenchClose(10) > .98:
    Sell Rules; BenchClose(0) / BenchClose(5) < >97
    I use a variation of Number of Bars and % in some Ports. This approach caused the most rotation out of and back into the market.

  3. Buy Rule; Pr4W%ChgInd > -2 & Pr4WRel%ChgInd > 0
    Sell Rule; Pr4W%ChgInd < -2 or Pr4WRel%ChgInd < 0
    I use a variation or % values in some Ports. These Ports never went fully out of the market (although their Sims did occasionally). They just rotated from one industry to another.

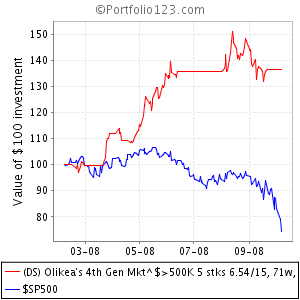
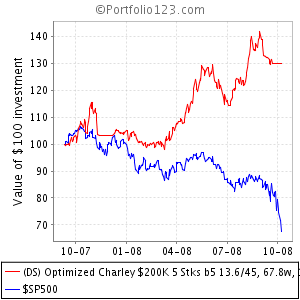
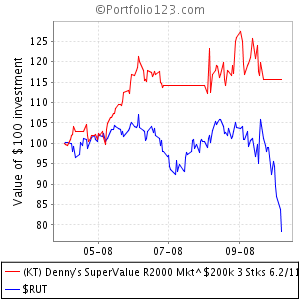
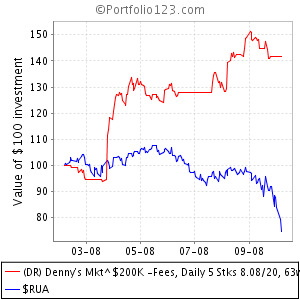
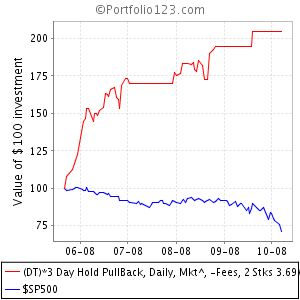
Since July ’07 the Ports that use the above rules have gradually moved out of, and back into the market. I have been as high as 80% in cash in August and January, and nearly fully invested in October and December. I am currently about 90% re-invested as of my buys last week and this morning. A few of the Ports were whipsawed in the October-November timeframe. Overall, the sum of my market timing Ports had a max drawdown of 16.4% on January 22nd, while the Russell 2000 had a max drawdown of 24.8% on March 10th. So I have beaten the benchmark of the type of stocks I buy by about 8%. I consider myself a relative aggressive trader and I have a fairly high tolerance for drawdown. 16.4% is significantly less that I have experienced in the past during >10% market corrections. So I am happy with that.

The Sims of these Ports imply that I will only lose a few % of the annual gain relative to Sims without the market timing rules. I will have to wait until we have had a run-up over a significant period of time to see if I haven’t actually hurt the annual gain very much.

Although I don’t try to determine if we have seen the bottom yet, it looks like my Ports are telling me that we have!

Denny :sunglasses:

Denny - very interesting.

Do you have any science in selecting which of the 3 you apply to a port or is it a case of try a few variations in the back testing and see which works best?

I guess the real question is ‘is there anything to choose between them’ when you take curve fitting out of the equation?

I for one will be doing a bit of back testing to see how much pain such rules would have saved me over the last few months.

Thanks again, I for one have missed the normal level of insightful postings over the course of the last few weeks. Hopefully the bottom is in sight and we will all be returned to a state of optimism and increased community participation.

Denny,
My Sincere thanks to your contribution to this board.Using some of yours buy &sell rules you did save me few dollars.I’m very thankfull for sharing your work with us

I am not Denny. He can and does speak for himself.

Since I have done some work in the past with market timing, I see a lot of wisdom in Denny’s use of 3 timing mechanisms. All timers get periods of whipsaw, but if one uses 3 then it is unlikely this will happen to all 3 at the same time. That smooths the ride a bit. Look at it this way: using 3 timers helps one hedge when the market is turning. The faster timer will be in and out quickly but open to many whipsaws, while the slower timer will whipsaw less but will usually be a bit “late” on exits and entries.

It is very important to remember that Denny is using timing in a different way than most timing services. Those services seek to outperform by being very aggressive. Being aggressive is fine in back testing, but aggressive timers often fail in real life. However, Denny is not trying to be aggressive in the use of timing. Rather than using timing to increase returns (which is very difficult to do), Denny is using it to reduce both gains and drawdowns (hopefully reducing drawdowns more than reducing gains).

Brian

Denny:
Is there any way we can use “sma(15,0,#Bench)” for sector, i.e. instead #Bench (most time is SP for me), can we use sector SMA ? thanks.

Hongwei Hui

Andrew,

Brian is right on in his answer above. In addition, the specific approach that I use in a Port is tied to the aggressiveness of the other buy and sell rules of the Port. For the more aggressive Ports I use a more aggressive timing approach. One of the things I like about the above timing approaches is that they are not “all in or all out” at the same time like most timers.

Hongwei Hui,

The closest we have to an industry equivalent to “sma(15,0,#Bench)” Is to use “Pr4W%ChgInd” which gives the 4 week % change of the industry, or “Pr4WRel%ChgInd” which gives the 4 week relative change of the industry to the S&P500. See my third example above.

All,

Let me give you an example of how I develop and test for a Market timing set of rules. I want to compare the difference of the return of my Benchmark with and without timing rules so I set up Sims to buy a random set of stocks and the only rules I use are for liquidity and market timing.

I normally trade stocks in the Russell 2000 universe so I use the PRussell2000 for my Benchmark in Step 1 of the Sim. I set the Sim to buy 100 stocks, no fees, and rebalancing weekly.

In Step 2 of the Sim I use the PRussell2000 as the universe, and use the Random Ranking System. This will cause the Sim to randomly buy 100 stocks every week, but only stocks in the PRussell2000 universe.

For buy rules I only have a minimum liquidity rule and the market timing rule.
For the Sell rule I have only the Markey timing rule.
I run the test over the full time period.

See this Sim for an example of how I set this up. In this Sim, the benchmark had a total return over the 7 years of data of 56.5% and a max drawdown of 38%, while the Market timing Sim had a total return of 123% and a max drawdown of 24%. See the Sim’s Charts page. Double the total return with a 14% lower drawdown.

One of the more interesting things about this market timing approach is that it was out of the market before 9/11/2001. Also, it greatly reduced the drawdown during the recession of 2001-2003. However, this specific approach didn’t do anything to improve the recent corrections.

This is the approach I use to evaluate timing independent of other buy and sell rules. Once I am satisfied with an approach that works (on past data) I will add the rules to my other Sims.

Denny :sunglasses:

PS: I had a misprint in my post that I started this thread with. In the first example the alternate sell rule should have been: BenchClose(0) < sma(15,0,#Bench) and sma(15,0,#Bench) < sma(50,0,#bench).

All,

I have been a proponent of market timing on the Forum for over a year. This enables us to follow automatic Trading Systems that are successful at getting out of the market and back in based on discrete buy/sell rules. Recently there has been an increase in the discussions about timing on this Forum. I thought that these discussions would have a greater level of credibility if there were some examples of actual Ports that are successfully using timing. The below charts are from the 5 of my 8 timing ports that I am following and have a minimum of 6 months of out-of-sample data. Three of these ports are rebalanced weekly and two of them are rebalanced daily. It has been very comforting to be automatically out of the market during much of the volatility of the last 6 months.

Denny :sunglasses:


Olikea's 4th Gen Mkt $500K 5 stks.png


Optimized Charley $200K 5 Stks.png


SuperValue R2000 Mkt^ $200k.png


Denny's Mkt^ $200K -Fees, Daily 5 Stks.png


3 Day Hold PullBack, Daily, Mkt^, -Fees, 2 Stks.png

Denny:

Thanks for the update. And after a bit of background, I have a question for you.

I remember giving your timing hedge ideas a thorough study some time ago. I decided not to go with them because they appeared to slightly reduce returns over the long term. Although my account is down considerably at present, I do not feel bad about my choice. I expect it will all even out over the long term (5-10 years). This assumes that I do not panic and bail out at the bottom as the majority of investors tend to do. I have not yet had an urge to bail out so I expect I will be able to ride this without falling off.

Once the dust settles from the current crisis and after the market has got well into its eventual rebound, I may reconsider your timing hedge approach. At most I think I would only hedge 50% of my account. I am not happy about draw downs but what really burns me up is missing out on rallies, especially rebound rallies.

This brings me to my question. How long a lag do your timing rules have for getting back into the market? Given that the market dive has been steeper than anything we can test with P123 current data, do you have an idea on whether your timing rules will be “timely” at signaling a re-entry to the market? Depending on the length of the moving average combined with the steepness and depth of the decline, I wonder if there will be a longer than normal lag for the entry signals. Or do you expect to forgo the initial rebound bounce?

Thanks again for sharing the charts. I appreciate seeing that the timing hedge rules have worked as designed. I may well put such rules into practice when I get to retirement age. Stability will become a key consideration then.

Regards,
Brian

Dear Denny,

Thank you for sharing innovative market timing rules with members, as a professional trader I would like to ask how to place percentage trail stop market order with broker for any long position to close automatically during the bear market and/or company’s bad news by using technical indicators ?

Regards,

Isam

Brian,

The first Port above uses this short term buy rule:

sma(5,0,#bench) > sma(10,5,#bench) * 0.98 or BenchClose(0) > sma(5,0,#bench) * 0.99

As you can see, the second part of this rule will buy back in when the current bench close is greater than -1% of the last 5 days average. If the market rebounds quickly, this rule will buy in only 1 or 2 days. So you won’t miss much of the rebound.

The 4th port above uses this longer term buy rule:

benchclose(0) > sma(15,0,#bench) or sma(15,0,#bench) > sma(50,0,#bench)

Using this rule it would normally take about 7 days of “normal” market increases to buy back in.
If the market fell off rapidly over the previous 3 weeks (like it did recently), and then came back gradually it could take several weeks to buy back in. and conversely, if the market fell slowly over the last 3 weeks and then increased rapidly, the rule could buy back in after only a couple of days. It would always buy back in before the benchmark got back to the high of the last 3 weeks.

All of my market timing systems use these or other relatively short term timing rules. I don’t like to be out of the market much at all, much less during the rebound.

Isam,

I have no idea how you can automatic trade a stock at your broker based on a technical indicator of a benchmark. You might be able to give your personal broker a set of rules and get him to analyze them daily, and execute market trades based on them for you. However, you would probably have to pay him a much higher commission!

Denny :sunglasses:

Denny:

Thanks for the two detailed examples.

After the current rebound has had enough time to get on the buy side of the market timing rules, I might add these (or similar) to my tool box. Perhaps 50% with timing and 50% always in? I’m not sure yet.

Regards,
Brian

Dear Denny & All,

Sorry for late response, normally long positions will be closed either from P123 rebalance sell recommendations OR from percentage trail stop orders placed for the new bought stocks (in order to close positions during the market corrections and/or company’s bad news).

My question for real trades how to determine the percentage of trail stop for different stocks (pls. provide example) ?

Best Regards,

Isam

Hi,
A common method for trailing stops is to set them as some percent of the Average Daily True range. So you calculate the avg daily true range as a percent of the stock price, then take a multiple of that: 2, 2.5, 3 depending on your timeframe for the trade, then set a trailing stop with your broker for that percent.

For example, the ATR(20) for IBM today is 5.623 and IBM’s current price is 90.04, so 5.623/90.04 = .062. So if I wanted to use a 2 ATR trailing stop I would set a trailing stop with the broker for 12%. I don’t think the brokers I use allow fractional percents. I have used such stops in the past but have had more success with other methods of risk control: hedging, smaller position size, profit taking.

You can test such trailing stops in P123 with a rule such as GainPct < -2*ATRN(20,0), but understand that this rule is only tested against the price at the time of rebalancing, unlike the broker order which would be continually evaluated - so in P123 with a weekly rebalance sim, the price could drop below your stop during the week but P123 would only sell it if it was still below your stop at the end of the week. You can at least update rebalancing to daily to better test a trailing stop but this can have a significant effect on the sim due to other buy/sell rules.

In general, in my testing I haven’t seen a significant advantage of using trailing stops based on volatility vs. a set percent which can easily be tested in P123 (subject to the limitations mentioned)… but then in general I don’t see a significant advantage for trailing stops in my testing. I do see a significant advantage for the type of market timing rules that are the subject of this thread.

FYI, ATR is available not only in P123 but in other tools such as stockcharts.com which is free. I use this for establishing position sizing - another method of risk control.

Don

Dear Don & All,

Thanks for your feedback, I would like to highlight the following:

  1. what are important market timing buy/sell rules other than those provided by Mr. Denny ?
  2. I agree with you market timing rules are very important, but in addition, I thing placing FLEXIBLE trail stop orders important to accommodate any market corrections / company’s bad news ? unless the market timining sell rules will alert sell recommendation earlier than placed trail stop orders ?
  3. What is FYI ?
  4. You mentioned “FYI, ATR is available not only in P123 but in other tools such as stockcharts.com which is free. I use this for establishing position sizing - another method of risk control”
    WOULD U PLS. GIVE EXAMPLE FOR RISK CONTROL ?

Best Regards,

Isam

FYI is For Your Information

Hi,

    1. I don’t have anything better than what has already been discussed in these forums, especially by Denny and Olikea, but this guy is pretty good: www.decisionmoose.com. This site has also been mentioned previously
  1. Not sure what the question is.
  2. I’ve found the volatile stocks can be more profitable so while I use a formula that establishes a position size to reduce the risk of the position in the more volatile stocks, I don’t try to make all trades equal risk.

(Current Balance * Target allocation * SQRT(Average volatility/stock volatility))/stock price

So for example:
With a trading account current balance of $10000, target allocation = 10% of account (10 stocks), average volatility of my last 50 stock purchases = 6% and volatility of the stock I am about to purchase = 9% and stock price of $5 gives:

10000*.1*SQRT(.06/.09)/5 = 163.3

So I would trade 163 shares at $5 = $815. which could be considered equivalent to trading $1222 of a stock with average volatility. Trading this stock as a straight 10% allocation the way P123 ports and sims would, could be considered equivalent to trading $1500 of a stock with average volatility.

This is my own formula. Typically I think that volatility is used to establish position sizes with equal risk. I think this is discussed by Van Tharp in his books.

Don

All:

Here is a simple timing rule that skips most of the Oct-Nov 2008 turmoil, so far, and has little effect on prior years.

benchclose(0) / benchclose(30) > .9

I use it as a buy rule in addition to other timing rules in backtesting sims.

I have found the screener to be usefull in seeing and better understanding how a benchmark actually functions as suggested in Marc Gerstein’s blog - Regime Switching Strategies (Part 2): Market-Timing Logic.

An example is the above rule in the SuperBear screen. Using one stock in backtesting, rather than the 0 default, greatly speeds things up and probably uses less resources. Below is the backtest result showing graphically when the rule is operative. Note the position column showing 0 positions after September 2008.

Glenn Fagerlin


2008SuperBear.bmp (1.29 MB)

Glenn,
Thank you for sharing

Interesting position sizing concept, Don.

Where do you get the average volatility and stock volatility values?

Hi,
I get the 20 day average true range from stockcharts.com. I save all my trades in a spreadsheet with this value, so I can take an average of my last 50 -100 trades to calculate the average volatility of the stocks I trade.

Don