I am surprised that more people aren’t interested in “merger arbitrage”, in my mind a concept matched only by “value investing” in terms of credibility.
My aim is not just to market but also to educate about the approach to merger arbitrage, a strategy used by Warren Buffett in the past.
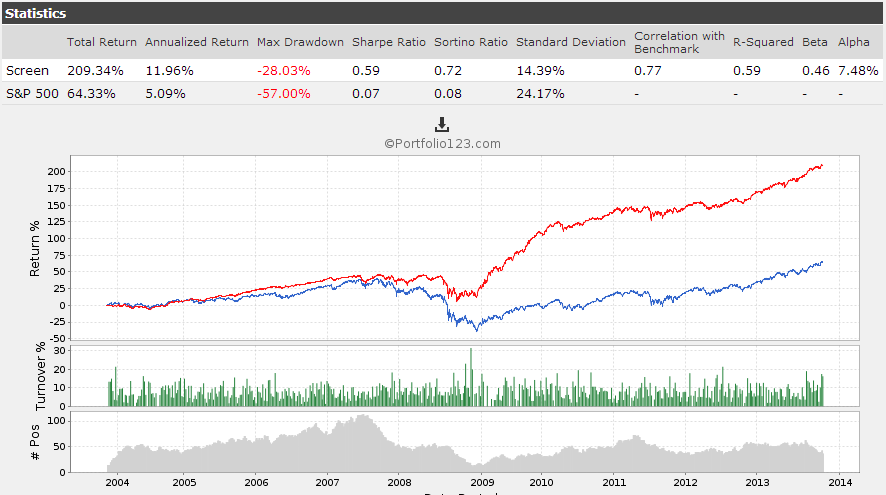
I have also decided to make my basic Merger Arbitrage Screen publicly available. Although there is no logic beyond it than to find reasonably liquid stocks in takeover, a backtest of this screen (see attatchment) shows it has both better risk and return metrics than the S&P 500. It seems like a “no brainer” strategy to me!
Oliver,
thanks for your presentation.
I am a subscriber to your model, so I know what you are talking about [;)]
What strikes me though, is the discrepancy between results of the model until 2008 (not spectacular) and then gong forward (very good). Could be that “merger-frenzy” has really picked-up after 2008. This is another example that the markets change and we never know for sure what lies ahead.
Wern
Presumably you are referring to the performance of the screen backtest above (the R2G model outperforms prior to 2008)?
I think one thing you can see visually from the graph is that there are a lot of cash mergers. In my experimentation with M&A I ran simulations with mainly cash mergers, and it is interesting as you get a “straight line” as the stock rises steadily in value until the takeover. However, it would theoretically produce a return somewhere inbetween a cash deposit (less risky) and an equities investment (more risky). That I see after 2008, perhaps representing a change of preference for stock deals vs cash?
This screen seems good, IMO, to get similar returns to the market minus the downside volatility both in bear markets and in bull. However, minus the period of 2007 - 2009, I do not see consistent out-performance as a broad strategy. If you take the returns from 2010 to current I believe this broad strategy does not generate alpha (although I believe you could generate very high alpha using a ranking system and picking the best of the best). I see the merger arbitrage as something for folks looking to lower risk by potentially decreasing drawdown and increasing Sortino and Sharpe. It may lead to future out-performance but that’s not how I see the advantage of this model - which is why many might not initally grab at it.
This is a low-risk model that shines best in bear markets. I do think this is a good strategy to round out a book, for low-risk investors and probably bigger funds who are more concerned about risk than are many of the model subscribers here who focus on high alpha, lower liquidity and focused 5 stock models at the moment.
Thanks for continuing to offer us much diversification of underlying model tactics.
Not in an explicit way, however, it is possible to infer who are having cash mergers because companies will have a very steady stock price - typically slowly rising until the merger date. This means they will exhibit an unusually low “average true range”. So if you pick the merger opportunities with the lowest average true range, you will pick up the cash deals.
Note the annualised return is a cash-like 5.07%, with a max drawdown of (an also cash-like) -7.08%. The strategy shown has no logic beyond simply picking up the deals - this is why the risk-adjusted return isn’t particularly exciting. The skill is in determining which deals are more likely to go through - if a deal falls apart it is likely the stock price of the target company will retract significantly. You exchange a high probability of a small gain for a low probability of a large loss. This is part of the reason why I think allocating ~10% in a portfolio (10 positions) is a reasonable amount. Any more and then you will end up with the chance of significant drawdowns.
From what I can see, there are a lot of very good r2gs out there that have not much Subs. https://www.portfolio123.com/app/r2g/summary/1044372 is one example wich I do not get at all?
Good model, but not much Subs…
I think it is too high turnover. I have noticed that subscribers are quite concerned about trading costs, positions, turnover and liquidity all play a factor in whether they are willing to subscribe. If they annualised return is sufficiently high, they will put up with high turnover etc. Vice versa, if the turnover is low, liquidity is good, they will subscribe to a system with lower annualised performance.
I think the problem the portfolio you showed is there are other portfolios with similiar performance at much less turnover, or better liquidity. However, it does have strong out of sample performance, and I think on the whole subscribers underweight the importance of out of sample.
I think there is also survivorship bias (although I could be wrong) as stocks are based off a ‘master list’ which is not PIT. How is the list changed going forward?
This port has a R-squared of 0.8 to the R2G russel3000 port, by my calculation. There are a lot of other similarities too. So, to some degree, the model designer’s ports are in competition with each other.