Momentum and hierarchical risk parity (HRP)

All,

I have some evidence that would suggest hierarchical risk parity (HRP) improves returns (and reduces risk) for securities selected on the basis of momentum (ETFs in this case).

That makes some sense if one believes in the Kelly criteria and diversifying ones bets. But one could also support this idea with mean-variance optimization.

I am beginning to think this forum is not the place to discuss machine learning in detail. Not yet anyway but I truly appreciated Marco’s efforts to change this. Thank you Marco. So to just summarize:

An optimal Kelly bet is μ/σ^2. So assuming momentum might continue, selecting a momentum asset hopes to improve μ. The denominator (σ^2) can be addressed by using hierarchical risk parity.

And hierarchical risk parity also serves to diversify those bets. The truth is μ is hard to predict going forward. Fortunately, hierarchical risk parity is not so sensitive to the predicted μ while HRP serves to diversify those unpredictable bets.

So HRP is a prefect compliment to any real-world discussion on how to “place your bets” in the stock market using the Kelly criterion. But to be clear, I am not looking for “Optimal Kelly” which would produce the theoretical maximum returns (I can only wish). In fact, I am saying one can never find optimal Kelly because one can never really know μ going forward.

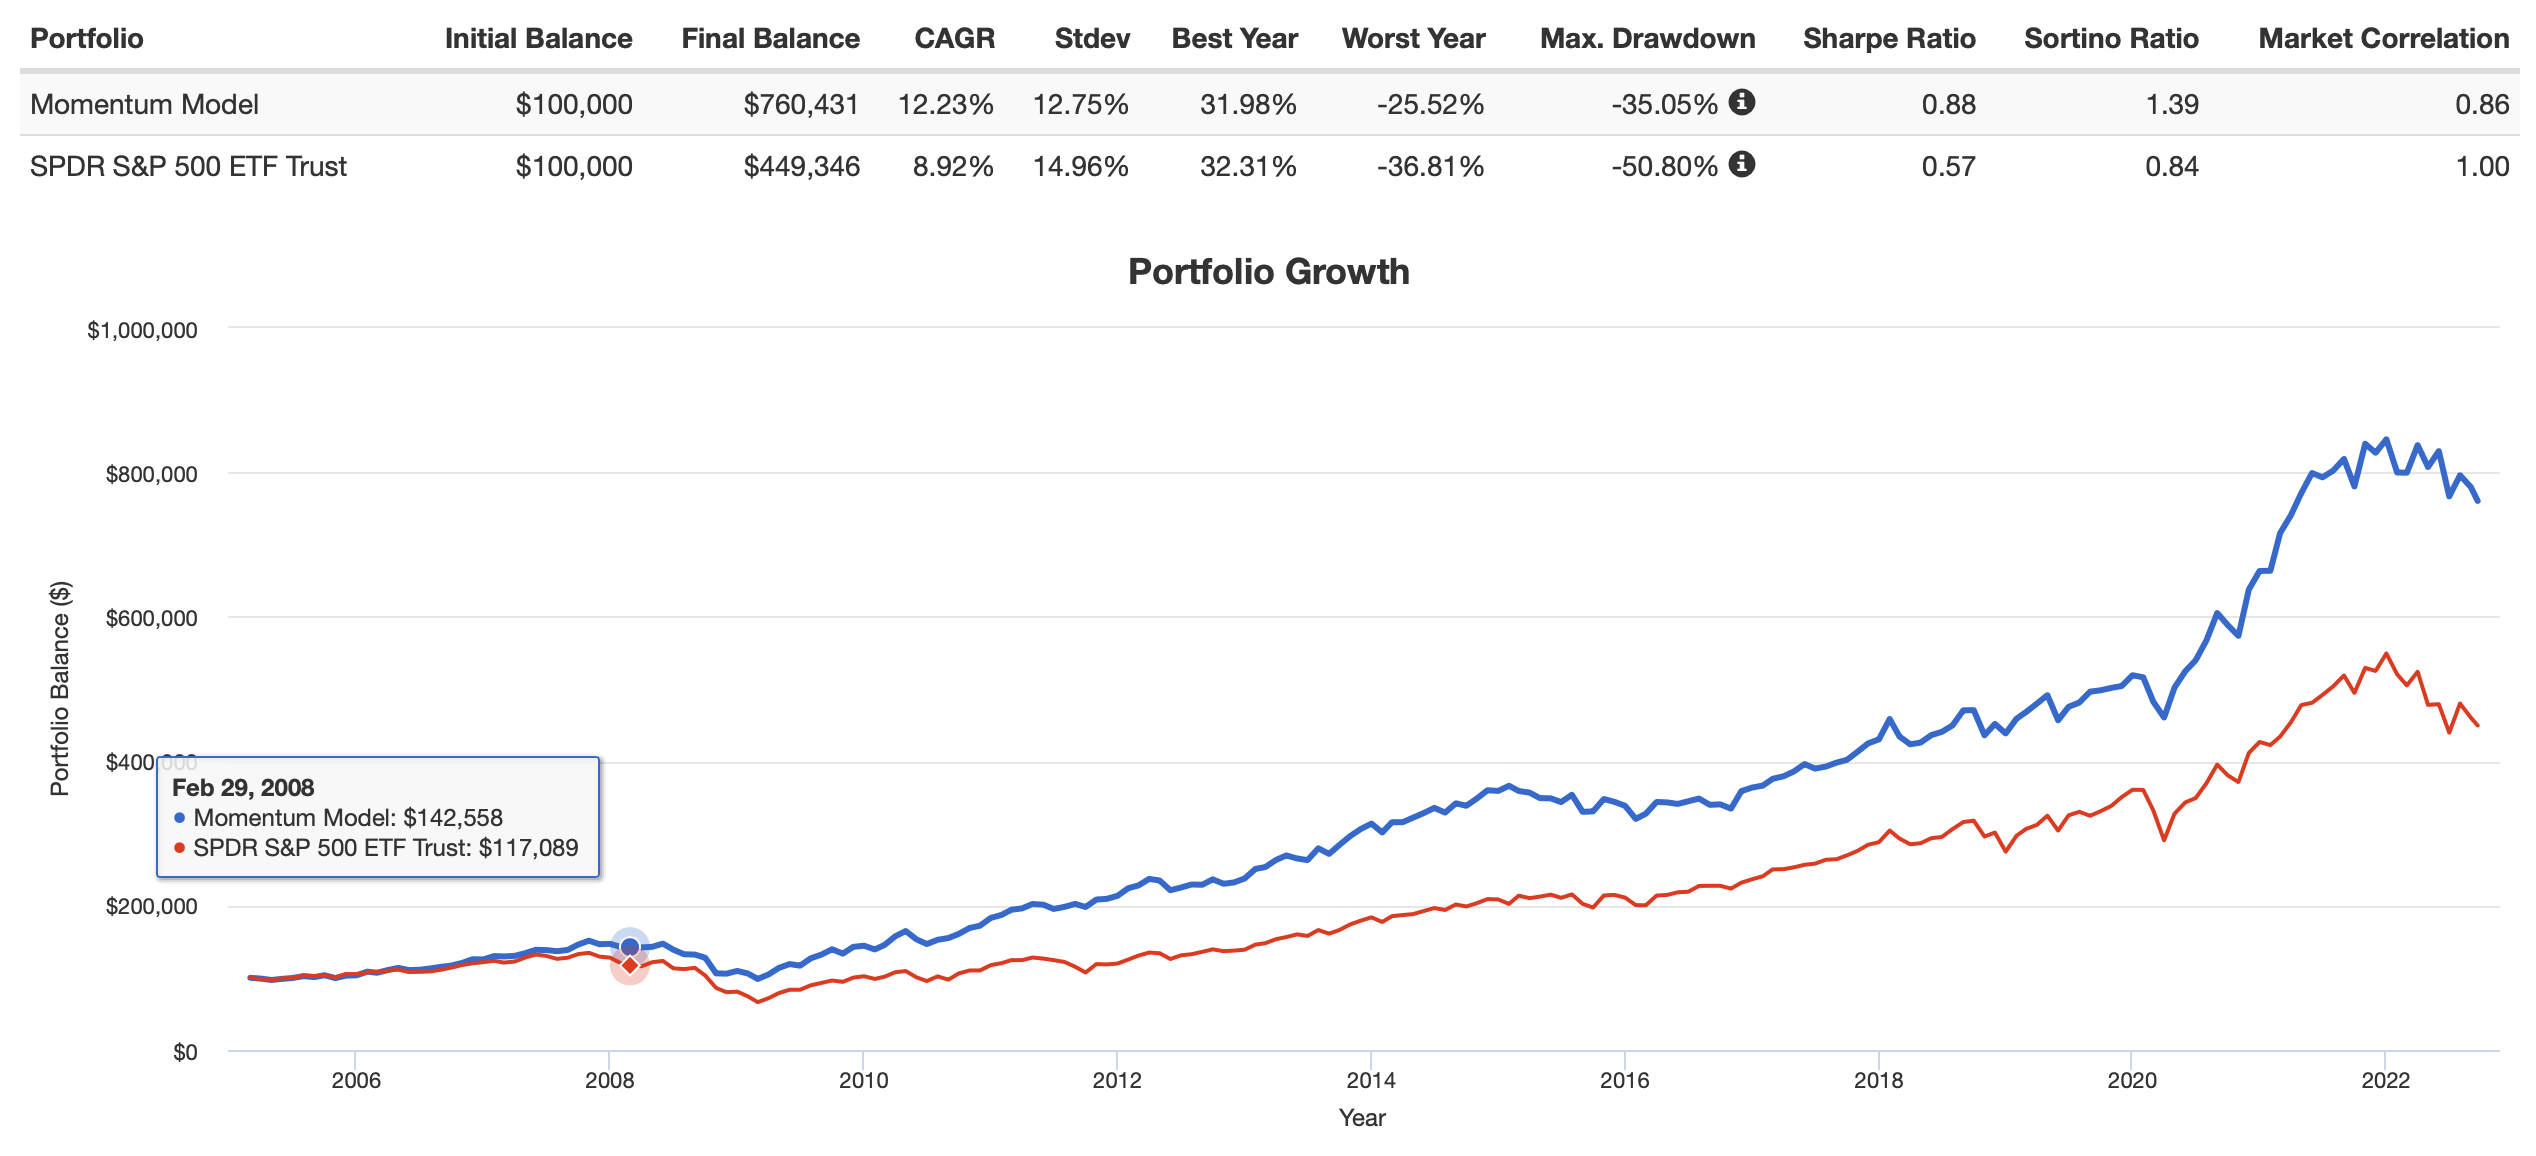
Anyway, that is enough of the theory. Here is one piece of evidence. Returns of equal weighing of some ETFs based on relative strength:

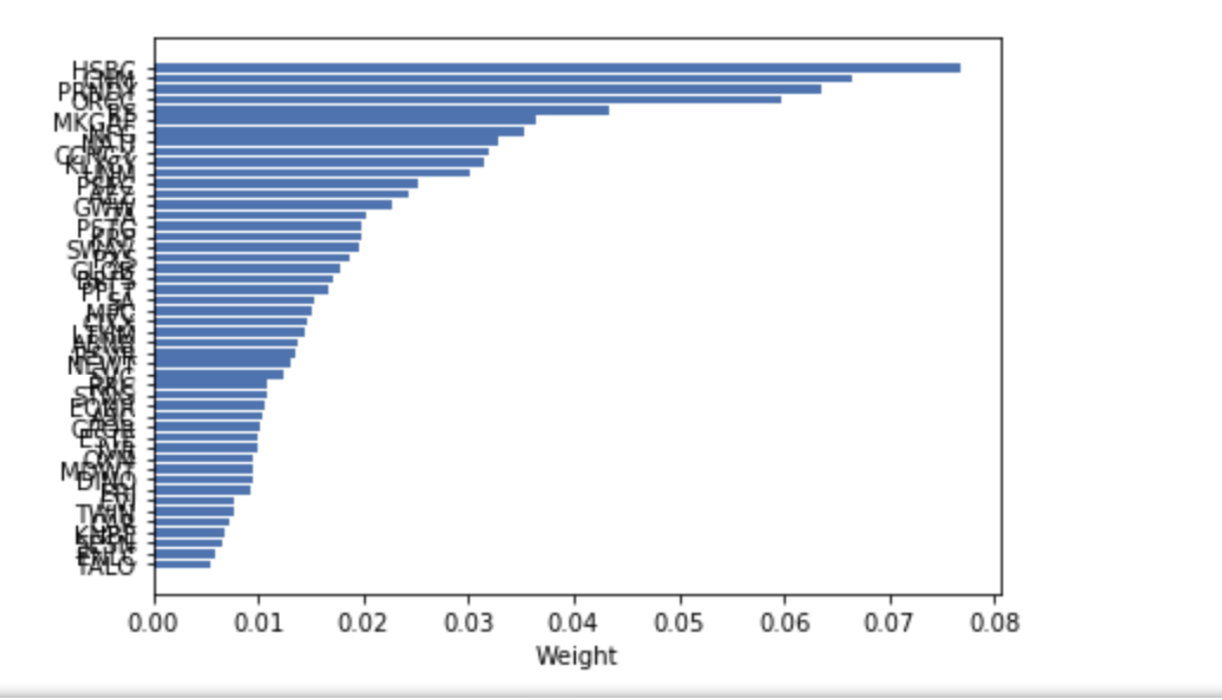
Exact same holdings weighted using hierarchical risk parity calculated by PyPortfolioOpt (Python):

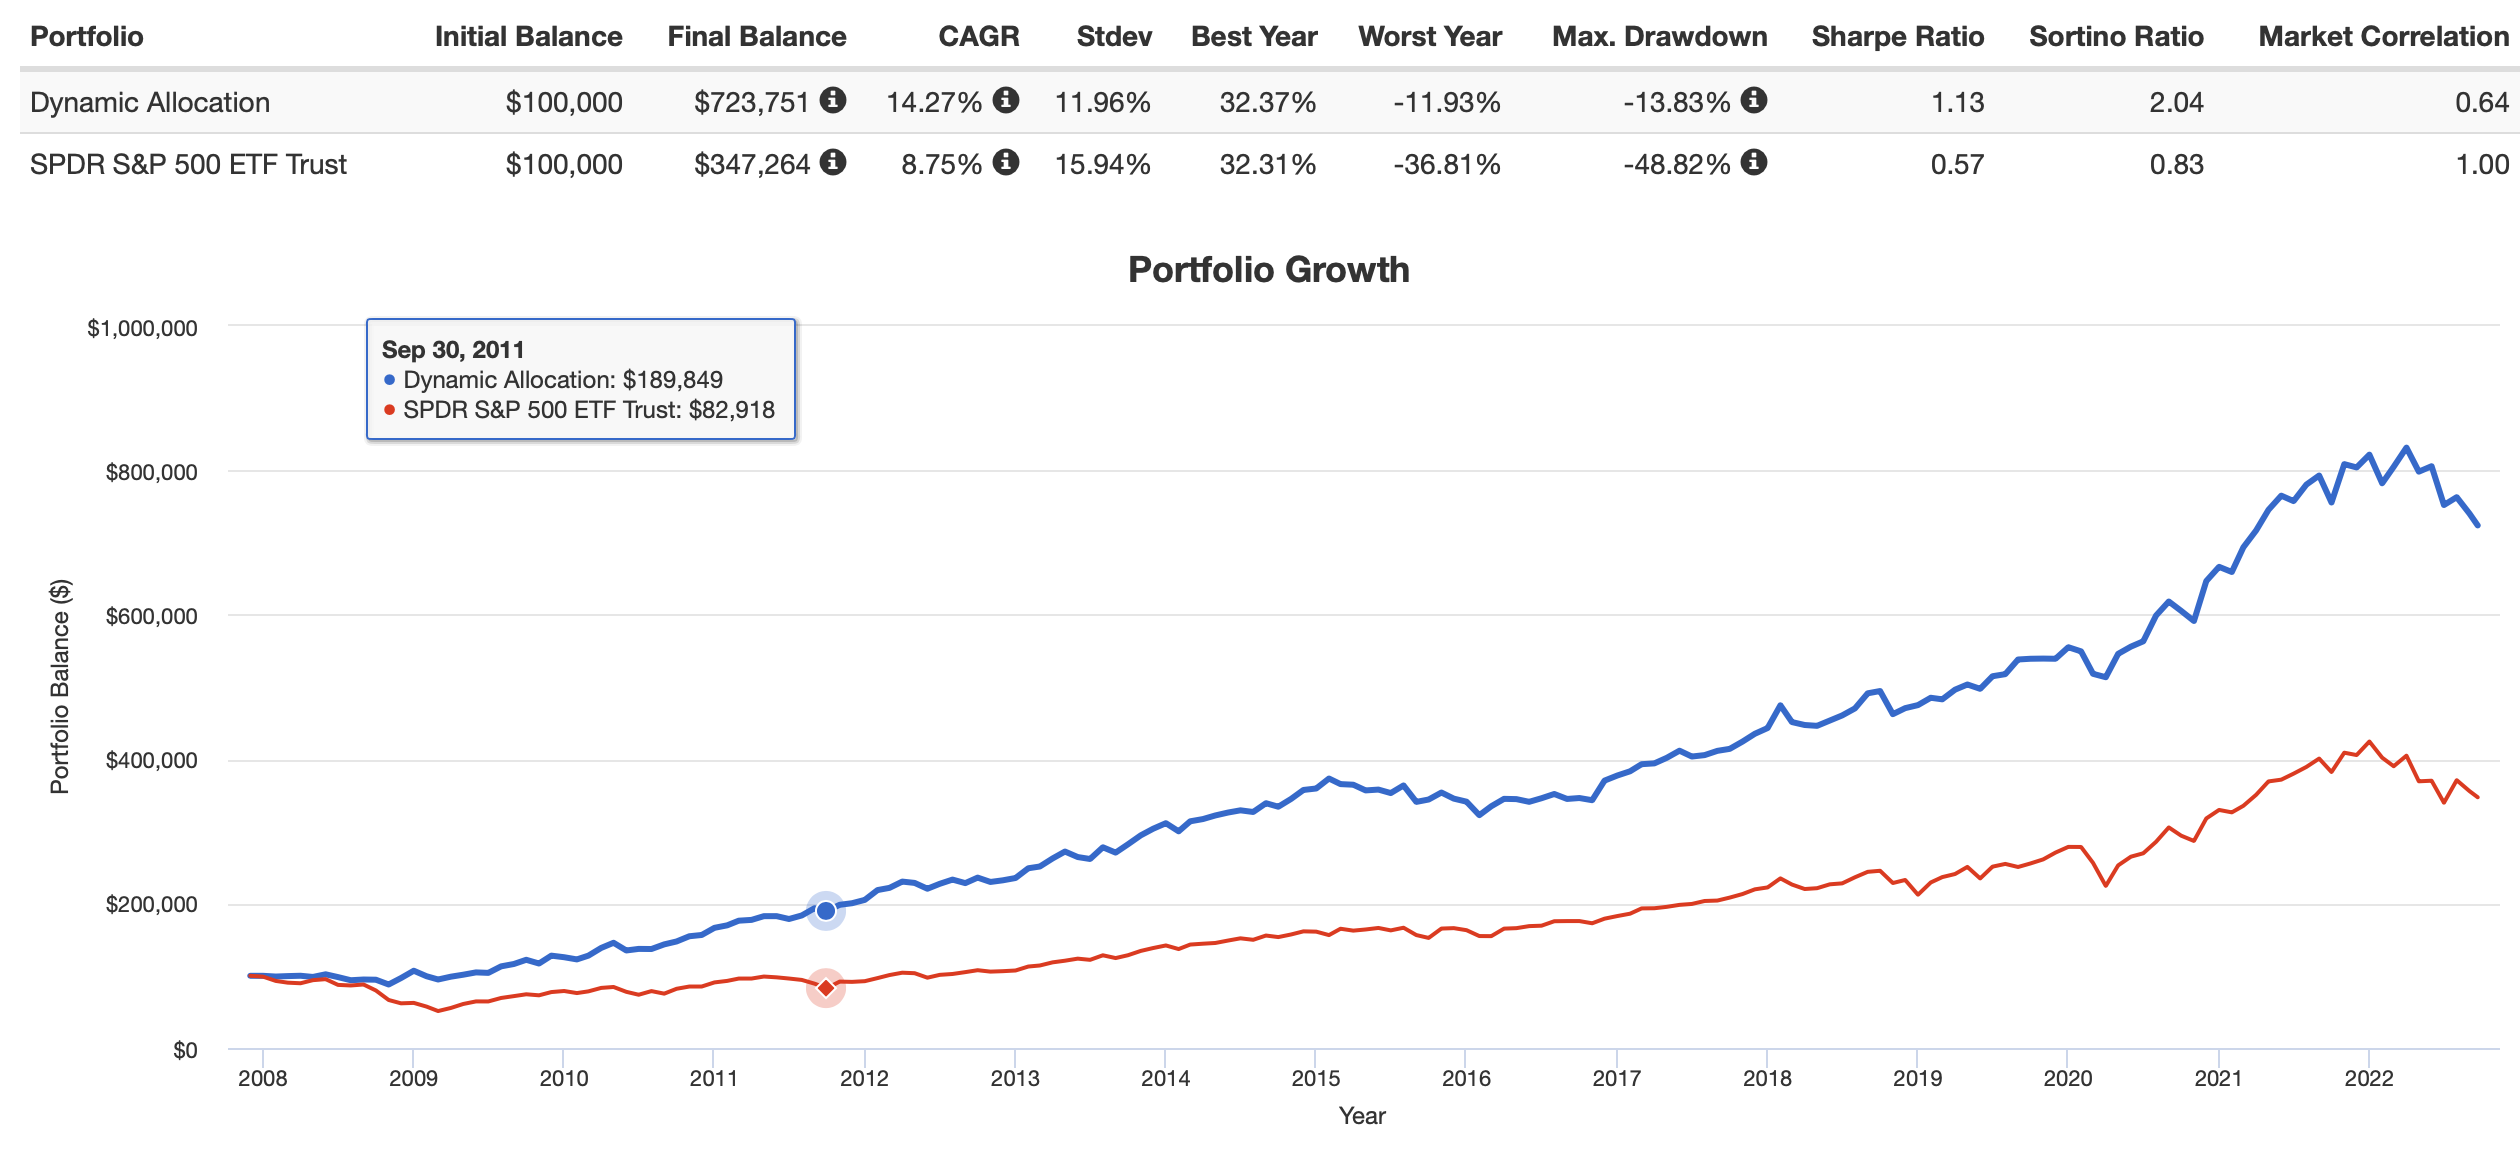
That is higher returns with less risk, I believe. Which is all I was looking for using HRP–as humble as that goal may seem.

I think one could take on even more risk based on the Kelly criterion. That could be done by using more volatile stocks (or leverage) and the risk could continue be minimized and diversified using hierarchical risk parity. Sentiment or other factors may work better or interact with momentum in a positive way (maybe one could use partial least square to optimize the factors).

TL;DR: You can probably skip the above and still improve your returns while reducing your risk by using the program PyPortfolioOpt with Python. And again, thank you Marco for supporting machine learning and AI in the forum.

Jim

Hi Jim,
Very interesting. What’s the site you’re getting the sim results from?
TIA,
Walter

Hi Walter,

I think the direct answer to your question is Portfolio Visualizer. Portfolio Visualizer does not have a HRP option. But you can upload data into it. You probably understand the details but to fill some of them in:

So, right now my process is slower than it could be because I am not an experienced programmer. and do not really like “for loops” Boolean logic slicing of columns etc.

But the pricing data is daily adjusted returns downloaded from Yahoo Finance for the ETFs. Each month the ETFs with the best relative returns are selected.

The weights are selected (manually for now) by selecting the columns of those ETFs with the best relative returns and slicing a look-back window of 46 days for each ETF and that is run through PyPortfoloOpt to get the weights for that month. No data after the start of the month is used to produce the weights or to select the ETF.

The weights for each month are put into a row in a csv file and when all or the rows are finished it can but uploaded into Portfolio Visualizer which, again, was probably your main question.

Obviously, this can be sped up greatly and one could easily select stocks at random and get a meaningful idea of how effective HRP is. I will do that at some point. And there are some papers that do just that.

Anecdotally, to both increase returns and reduce risk it should be a strategy that is already beating the benchmark. HRP only improves upon a good strategy as far as returns. But if it is a good strategy returns are universally increased and risk is always decreased no matter what, in my experience. Sometimes it is dramatic. Sometimes less dramatic. Also it seems to reduce the risk of any strategy (good or bad).

Also, obviously, the returns (but not risk adjusted returns) can suffer if there a too many ETFs with lower returns like TIP or AGG. But not necessarily, It depending on how the ETFs are selected each month and whether an equal-weight portfolio using your strategy to select ETFs is beating its benchmark.

Let me know if any more details of what I do might be helpful.

A key theme (from another post) is that the 46 day window had no look-ahead bias. IT IS AN EXAMPLE OF A WALK-FORWARD BACKTEST.

Thank you for allowing me to highlight some of the advantages of a walk-forward backtest while trying to provide a direct answer to your question. :wink:

Jim

1 Like

All,

Probably just me, but I find this to be an incredibly easy way to to potentially increase returns and reduce risk.

There is little cost to run the program. It is free, it does not take a lot of time and there can be little doubt that it can work.

To explore this further I checked to see if the program would run 48 stocks chosen over at Zacks (Rank 1 and Momentum Style A). Obviously, not a backtest yet.

This was chosen because the 48 stocks represented most of Zacks 17 sector classifications and might be relatively diverse. And not be limited to value or growth (and therefore be relatively diverse). Also it gets away from me having to defend a port or sim that I might create for this: insult Zacks all you want and I will try to find the good points in any criticism about the topic (HRP).

I like momentum for this as the name of the thread would suggest.

Here is the range of weights it produced:

A true backtest of the idea might take a little more time that the average P123 backtest. Maybe I can look at the drawdown of the 2008 recession and Covid however.

But the weight ranges are not extreme and there is also enough change in the weights that one could think it might make a difference. Maybe a “Goldilocks” result in that regard.

I might prefer not to make a “type 2” error on this one. By that I mean I might prefer to use HRP before I have a full backtest on stocks proving its value. It does not produce extreme weights, the odds are it helps and it is not very likely to cause any harm.

Anyway, it looks like the program can be used for stocks. It works fine for up to 48 stocks and it does not have the “Markowitz curse” that mean-variance optimization would. It seems to work for ETFs already.

De Prado may have done some good work here. BTW, he calls it machine learning (as does most of the literature on this method) and therefore could be something P123 might want to look at long-term for its AI or machine learning implementation.

Also, this was a topic over at Quantopian when that was a thing. So not really a secret and not really that radical either. I am not sure where P123 wants to head with machine learning but I think the roll-out by the end of the year should be considered just the start from a business-growth perspective.

There is more that can be done than just having boosting and neural-nets.

Edit. Is this a better graphic for the wieghts?

Jim

I like the concept of risk parity but the problem is when everything correlates like this year it does not work. That being said not much is working this year except long the US dollar and short everything else. We don’t have any data to backtest inflationary periods and if this inflation stays for a couple of years I have no clue what will happen.

Cheers,
MV