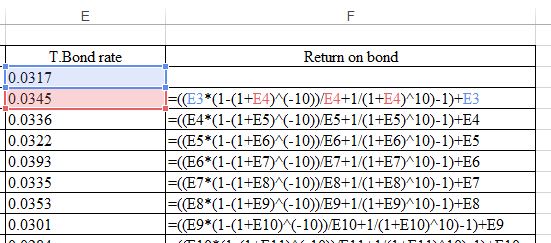
Professor Damodaran at NYU publishes data (http://www.stern.nyu.edu/~adamodar/pc/datasets/histretSP.xls) on return on a 10-year bond using the attached formula. How could you adapt this to calculate the monthly return if you have the monthly 10-year bond rates?
The screen shot uses annual 10-year bond rates and calculates annual return on the 10-year bond using his formula.
Are you sure? It both instances of 10? I tried that and the numbers don’t make sense. It makes the returns higher in magnitude when monthly return should be lower than annual return.
The formula behaves a bit weirdly with yearly IR variations of 4% and more, but it is a decent approximation for the price change of the bond.
For monthly returns, the price change part of the formula stays the same (actually, it is more correct used monthly!), but the yield component has to go down to 1 month:
Still, the formula does not capture part of the duration risk premium implied in the roll return. To be precise you should have also the 9y yield time series and adjust the price change according to the natural shift of the actual bond to a lower duration (for instance, if in 2015 10y=2,5% and in 2016 10y=2,5% 9y=2,4%, price of the strategy should be 0,1%*duration higher due to roll return, all else equal).
Since 9y time series doesn’t have a long history, you could extrapolate it assuming a linear or log fit between 2y (or 3m/fed funds) and 10y series.
Can I compound that estimated annual return using a standard geometric compounding formula? And from that, is it prudent to take the compound annual growth rate (CAGR, i.e., geometric mean)?
If so, then the long-term return on the 10-year treasury is in excess of 4%. I bet those pension funds are still assuming that as the “forever” risk-free rate. Underfunded pensions is probably reason #1 why the Fed has got to raise rates.
This is an approximate calculation and abbreviations are as follows:
Yo = % yield at the beginning of the investment period
Ye = % yield at the end of the investment period
C = assumed coupon = (Yo + Ye)/2 * $100
Vo = Bond Value at the beginning of the investment period (Dollars)
Ve = Bond Value at the end of the investment period (Dollars)
FV = Future Value at bond redemption = $100
In = Income from coupons (Dollars)
L = Length of investment period (years)
Po = Period to maturity at the beginning of the investment period (years)
Pe = Period to maturity at the end of the investment period (years)
PV = Present Value, the excel formula for present value is: PV(Y,P,C,FV)
Example: Bond market investment period 12/14/07 – 8/3/09
L = 1.64 years
Yo = 4,23%
Ye = 3.64%
C = (4.23 + 3.64)/2 = $3.94
Vo = PV(Yo,Po,C,FV) = PV(0.0423,10,3.94,100) = $97.67
Ve = PV(Ye,Pe,C,FV) = PV(0.0364,(10-1.64),3.94,100) = $102.13
In = 1.64 * $3.94 = $6.46
Return = ($102.13 - $97.67 + $6.46) = $10.92
Pct Return = $10.92 / $97.67 = 11.18%
Over the same period IEF adjusted for dividends returned = 11.52%