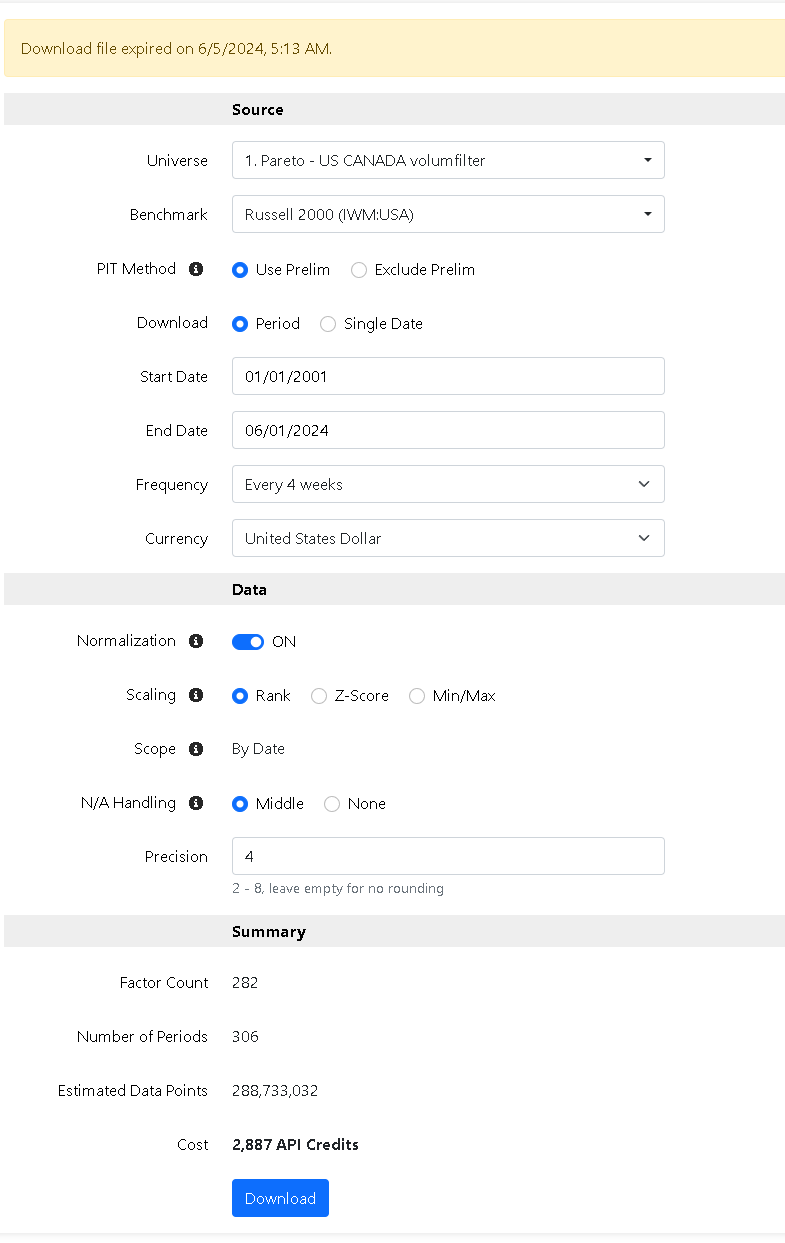
I have now tried to code my own ML code to test it on the dataset from p123, and then run the predictions on the stocks in the screen backtest (FRANK("$$130624firstml",#Previous,#DESC) > 99.5)
The results were completely dismal:
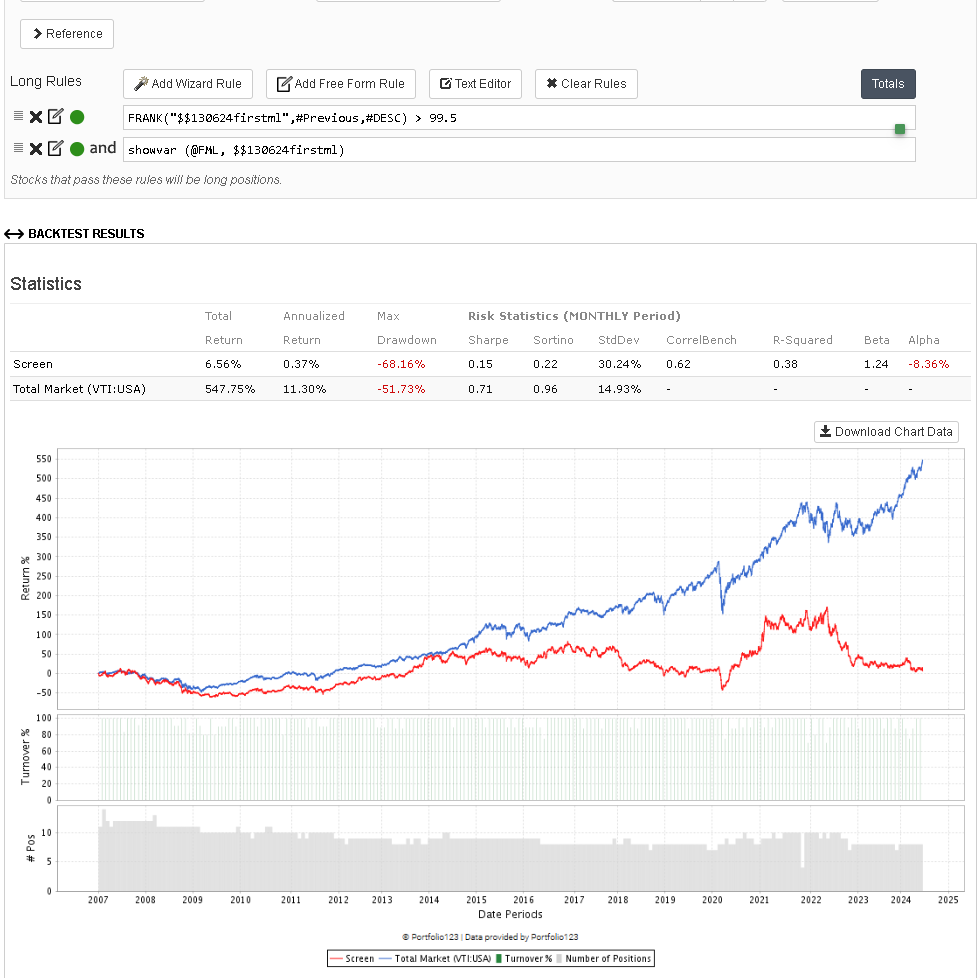
I can't understand why it's so terrible.
I am sharing everything here in case anyone has any input on whether I am making a mistake:
-
Here is the dataset: 020624RAA.csv - Google Drive
-
Here is the predicted score: predictions.csv - Google Drive
-
Here is what the code dose:
- Load and Preprocess Data:
- Load CSV data using Dask, which allows handling large datasets efficiently.
- Set the 'Date' column as the index and check for the presence of the 'Ticker' column.
- Drop rows with missing values to ensure data integrity.
- Identify categorical columns and use
LabelEncoderfor those with fewer unique values. - Apply one-hot encoding to remaining categorical columns to convert them to numeric.
- Ensure all data columns are numeric, dropping any that are not after preprocessing.
- Split Data:
- Use a sliding window approach to split the data into training, validation, and test sets.
- Each window includes a period for training/validation and a subsequent period for testing.
- Maintain the 'Ticker' information for each set to track which stocks are being predicted.
- Split the target column (e.g., '1 Day Returns') from the features for model training.
- Train Models:
- Define three models:
RandomForestRegressor,ExtraTreesRegressor, andXGBRegressor. - Train each model on the training data, ensuring they learn patterns from historical stock prices.
- Save the trained models using
joblibfor later use, reducing the need for retraining. - Evaluate Models:
- Evaluate each trained model on the validation set using Root Mean Squared Error (RMSE).
- Compare the RMSE scores to determine which model performs best on unseen data.
- Select the model with the lowest RMSE as the best-performing model for making predictions.
- Recommend Stocks:
- Use the best-performing model to predict stock prices on the test set.
- Generate stock recommendations based on the predicted future prices.
- If the model provides feature importance, include this information in the recommendations to explain which features are most influential.
- Report Results:
- Save the model's predictions to a CSV file, including the date, ticker, and predicted value.
- Ensure the CSV report is properly formatted and saved to the specified file path.
- Main Execution:
- Ask the user whether to use existing trained models or train new ones.
- Load existing models if available, otherwise, train new models.
- Execute the entire workflow, from loading data to generating stock recommendations and saving the results, based on user input.
- Here is the Python code:
import pandas as pd
import numpy as np
from sklearn.ensemble import RandomForestRegressor, ExtraTreesRegressor
from xgboost import XGBRegressor
from sklearn.preprocessing import LabelEncoder
from sklearn.model_selection import GridSearchCV, TimeSeriesSplit
from sklearn.metrics import mean_squared_error, mean_absolute_error, r2_score, mean_squared_error
import joblib
import os
import csv
import logging
from tabulate import tabulate

logging.basicConfig(level=logging.INFO, format='%(asctime)s - %(levelname)s - %(message)s')

def load_and_preprocess_data(file_path):
    logging.info("Laster inn data...")
    data = dd.read_csv(file_path, parse_dates=['Date']).set_index('Date')
    logging.info(f"Antall rader før forbehandling: {len(data)}")
    logging.info(f"Antall kolonner før forbehandling: {len(data.columns)}")
    logging.info(f"Kolonner før forbehandling: {data.columns}")

    if 'Ticker' not in data.columns:
        raise KeyError("Kolonnen 'Ticker' finnes ikke i den opprinnelige datasettet.")

    tickers = data['Ticker']  # Bevar 'Ticker' kolonnen
    data = data.dropna()  # Rense dataene for manglende verdier
    logging.info(f"Antall rader etter å ha droppet manglende verdier: {len(data)}")
    logging.info(f"Antall kolonner etter å ha droppet manglende verdier: {len(data.columns)}")
    logging.info(f"Kolonner etter å ha droppet manglende verdier: {data.columns}")

    # Identifisere kategoriske kolonner
    categorical_columns = data.select_dtypes(include=['object']).columns
    logging.info(f"Identifiserte kategoriske kolonner: {categorical_columns}")
    logging.info(f"Antall unike verdier i kategoriske kolonner: {[data[col].nunique().compute() for col in categorical_columns]}")

    # Bruk LabelEncoder for å konvertere kategoriske kolonner med få unike verdier
    for col in categorical_columns:
        if data[col].nunique().compute() < 100:
            le = LabelEncoder()
            data[col] = data[col].map_partitions(lambda s: pd.Series(le.fit_transform(s)))
    logging.info(f"Kolonner etter LabelEncoding: {data.columns}")

    # Bruk pd.get_dummies for de gjenværende kategoriske kolonnene
    data = data.map_partitions(pd.get_dummies, columns=[col for col in categorical_columns if data[col].dtype == 'object'])
    logging.info(f"Kolonner etter pd.get_dummies: {data.columns}")

    data = data.compute()  # Konverter Dask DataFrame til Pandas DataFrame
    data = data.apply(pd.to_numeric, errors='coerce')  # Konverterer til numeriske verdier
    logging.info(f"Kolonner etter konvertering til numeriske verdier: {data.columns}")

    data = data.dropna(axis=1, how='any')  # Fjerner kolonner som inneholder ikke-numeriske verdier
    logging.info(f"Antall rader etter å ha droppet ikke-numeriske verdier: {len(data)}")
    logging.info(f"Antall kolonner etter å ha droppet ikke-numeriske verdier: {len(data.columns)}")
    logging.info(f"Kolonner etter å ha droppet ikke-numeriske verdier: {data.columns}")

    data['Ticker'] = tickers  # Legg tilbake 'Ticker' kolonnen
    data = data.sort_index()

    # Sjekk om Ticker-kolonnen er til stede
    if 'Ticker' not in data.columns:
        raise KeyError("Kolonnen 'Ticker' finnes ikke i datasettet etter forbehandling.")

    logging.info(f"Startdato i datasettet etter forbehandling: {data.index.min()}")
    logging.info(f"Sluttdato i datasettet etter forbehandling: {data.index.max()}")
    return data

def split_data(data, target_column, train_size=0.7, val_size=0.2, window_size=5):
    logging.info("Splitter data...")
    logging.info(f"Startdato i datasettet før splitting: {data.index.min()}")
    logging.info(f"Sluttdato i datasettet før splitting: {data.index.max()}")

    train_data = []
    val_data = []
    test_data = []
    tickers_test = []

    start_date = data.index.min()
    end_date = data.index.max()
    window_end_date = start_date + pd.DateOffset(years=window_size)

    while window_end_date <= end_date:
        train_val_data = data.loc[start_date:window_end_date]
        test_data_window = data.loc[window_end_date + pd.DateOffset(days=1):window_end_date + pd.DateOffset(years=window_size)]

        train_val_data = train_val_data.iloc[:int(len(train_val_data) * (train_size + val_size))]

        if train_val_data.empty or test_data_window.empty:
            raise ValueError("Trenings-, validerings- eller testsettet er tomt. Sjekk dataens lengde og splitting.")

        train_data_window = train_val_data.iloc[:int(len(train_val_data) * train_size / (train_size + val_size))]
        val_data_window = train_val_data.iloc[int(len(train_val_data) * train_size / (train_size + val_size)):]

        train_data.append(train_data_window)
        val_data.append(val_data_window)
        test_data.append(test_data_window)
        tickers_test.append(test_data_window['Ticker'])

        start_date = window_end_date + pd.DateOffset(days=1)
        window_end_date += pd.DateOffset(years=window_size)

    # Ensure the last window includes all remaining data
    if window_end_date > end_date:
        test_data_window = data.loc[window_end_date + pd.DateOffset(days=1):end_date]
        if not test_data_window.empty:
            test_data.append(test_data_window)
            tickers_test.append(test_data_window['Ticker'])

    X_train = [data.drop([target_column, 'Ticker'], axis=1) for data in train_data]
    y_train = [data[target_column] for data in train_data]
    X_val = [data.drop([target_column, 'Ticker'], axis=1) for data in val_data]
    y_val = [data[target_column] for data in val_data]
    X_test = [data.drop([target_column, 'Ticker'], axis=1) for data in test_data]
    y_test = [data[target_column] for data in test_data]

    return X_train, y_train, X_val, y_val, X_test, y_test, tickers_test

def train_and_save_model(model, X_train, y_train, model_path):
    logging.info(f"Trener og lagrer modellen: {model_path}")
    model.fit(pd.concat(X_train), pd.concat(y_train))
    joblib.dump(model, model_path)

def evaluate_models(models, X_val, y_val):
    best_model = None
    best_score = float('inf')
    best_model_name = ""
    for model in models:
        model_name = type(model).__name__
        logging.info(f"Evaluating model: {model_name}")
        predictions = model.predict(pd.concat(X_val))
        rmse = mean_squared_error(pd.concat(y_val), predictions, squared=False)
        logging.info(f"{model_name} RMSE: {rmse}")
        if rmse < best_score:
            best_score = rmse
            best_model = model
            best_model_name = model_name
    logging.info(f"Best model: {best_model_name} with RMSE: {best_score}")
    return best_model

def recommend_stocks(model, X_test, tickers_test, feature_names, num_recommendations=20):
    logging.info("Starting stock recommendation...")
    latest_data = X_test[-1]
    if latest_data.empty:
        logging.error("Latest data is empty. Cannot proceed with stock recommendation.")
        return pd.DataFrame()

    predictions = model.predict(latest_data)
    data = pd.DataFrame({'Ticker': tickers_test[-1], 'Predictions': predictions})

    # Check if model has feature_importances_
    if hasattr(model, 'feature_importances_'):
        feature_importances = pd.DataFrame(
            [model.feature_importances_ for _ in range(len(data))], columns=feature_names
        )
        data = pd.concat([data.reset_index(drop=True), feature_importances.reset_index(drop=True)], axis=1)
    else:
        logging.warning("Model does not have feature_importances_ attribute.")

    recommended_stocks = data.sort_values(by='Predictions', ascending=False).head(num_recommendations)
    logging.info("Stock recommendation completed.")
    return recommended_stocks

def display_recommendations(recommended_stocks):
    logging.info("Displaying recommendations...")
    if recommended_stocks.empty:
        logging.error("No recommendations to display.")
        return

    # Sorter featurene etter viktighet for den første tickeren
    first_ticker_features = recommended_stocks.iloc[0, 2:].sort_values(ascending=False)
    # Skriv ut tabellen for den første tickeren
    logging.info(tabulate(
        [['Ticker', recommended_stocks.iloc[0, 0]], ['Predictions', '{:.3f}'.format(recommended_stocks.iloc[0, 1])], ['Top 50 Features', ''], *first_ticker_features.head(50).items()],
        headers=['Feature', 'Importance'], tablefmt="fancy_grid"
    ))
    # Skriv ut tickerne for de resterende anbefalte aksjene
    logging.info("\nResterende anbefalte aksjer:")
    for i in range(1, len(recommended_stocks)):
        logging.info(f"{i}. {recommended_stocks.iloc[i, 0]} ({'{:.3f}'.format(recommended_stocks.iloc[i, 1])})")
    logging.info("Recommendations displayed.")

def print_model_report(model, X_test, y_test, tickers_test, output_file_path):
    try:
        output_dir = os.path.dirname(output_file_path)
        if not os.path.exists(output_dir):
            os.makedirs(output_dir)
        output_file = os.path.join(output_dir, os.path.basename(output_file_path))

        combined_tickers = []
        combined_dates = []
        combined_predictions = []

        for X, tickers in zip(X_test, tickers_test):
            predictions = model.predict(X)
            combined_predictions.extend(predictions)
            combined_tickers.extend(tickers)
            combined_dates.extend(X.index)

        with open(output_file, 'w', newline='') as csvfile:
            writer = csv.writer(csvfile)
            # Skriv overskrifter til CSV
            writer.writerow(['Date', 'Ticker', 'Value'])
            for date, ticker, prediction in zip(combined_dates, combined_tickers, combined_predictions):
                date_str = date.strftime('%Y-%m-%d')
                writer.writerow([date_str, ticker, '{:.3f}'.format(prediction)])
        logging.info(f"Prediksjoner skrevet til {output_file}")
    except Exception as e:
        logging.error(f"En feil oppstod under skriving av CSV-filen: {e}")

def main():
    file_path = r'C:\\Users\\mywag\\Documents\\YT\\020624RAA.csv'
    model_paths = ['trained_rf_model.pkl', 'trained_et_model.pkl', 'trained_xgb_model.pkl']

    data = load_and_preprocess_data(file_path)
    logging.info(f"Kolonner i datasettet: {data.columns}")

    target_column = '1 Day Returns'
    if target_column not in data.columns:
        raise KeyError(f"Målkolonnen '{target_column}' finnes ikke i datasettet.")

    # Del dataene før modellvalg
    X_train, y_train, X_val, y_val, X_test, y_test, tickers_test = split_data(data, target_column, train_size=0.7, val_size=0.2, window_size=5)
    feature_names = X_test[0].columns

    models = [
        RandomForestRegressor(n_estimators=100, max_depth=10, min_samples_split=2, min_samples_leaf=1, n_jobs=-1),
        ExtraTreesRegressor(n_estimators=100, max_depth=10, min_samples_split=2, min_samples_leaf=1, n_jobs=-1),
        XGBRegressor(n_estimators=100, max_depth=10, min_child_weight=1, gamma=0, subsample=0.8, colsample_bytree=0.8, objective='reg:squarederror', n_jobs=-1, scale_pos_weight=1, seed=27, reg_alpha=0.00006)
    ]

    use_existing_models = input("Vil du bruke tidligere trente modeller? (y/n): ").lower() == 'y'
    trained_models = []

    if use_existing_models:
        for model_path in model_paths:
            if os.path.exists(model_path):
                trained_models.append(joblib.load(model_path))
            else:
                logging.info(f"Filen {model_path} finnes ikke. Trener en ny modell.")
                model = models[len(trained_models)]
                train_and_save_model(model, X_train, y_train, model_path)
                trained_models.append(model)
    else:
        for i, model in enumerate(models, start=1):
            model_path = model_paths[i-1]
            train_and_save_model(model, X_train, y_train, model_path)
            trained_models.append(model)

    # Evaluate models and select the best one
    best_model = evaluate_models(trained_models, X_val, y_val)

    # Anbefale aksjer basert på den beste modellen
    logging.info("Anbefalte aksjer:")
    recommended_stocks = recommend_stocks(best_model, X_test, tickers_test, feature_names)
    display_recommendations(recommended_stocks)

    # Generere og skrive ut rapport
    output_file_path = os.path.join(os.path.dirname(file_path), 'predictions.csv')
    print_model_report(best_model, X_test, y_test, tickers_test, output_file_path)

if __name__ == "__main__":
    main()