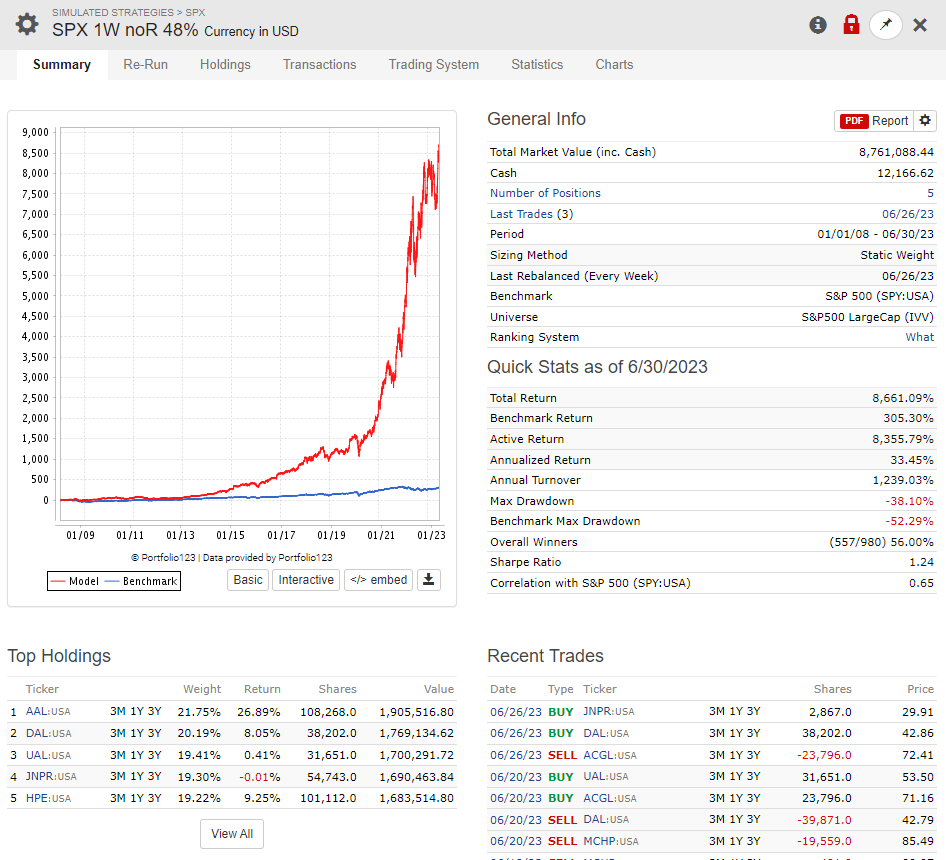
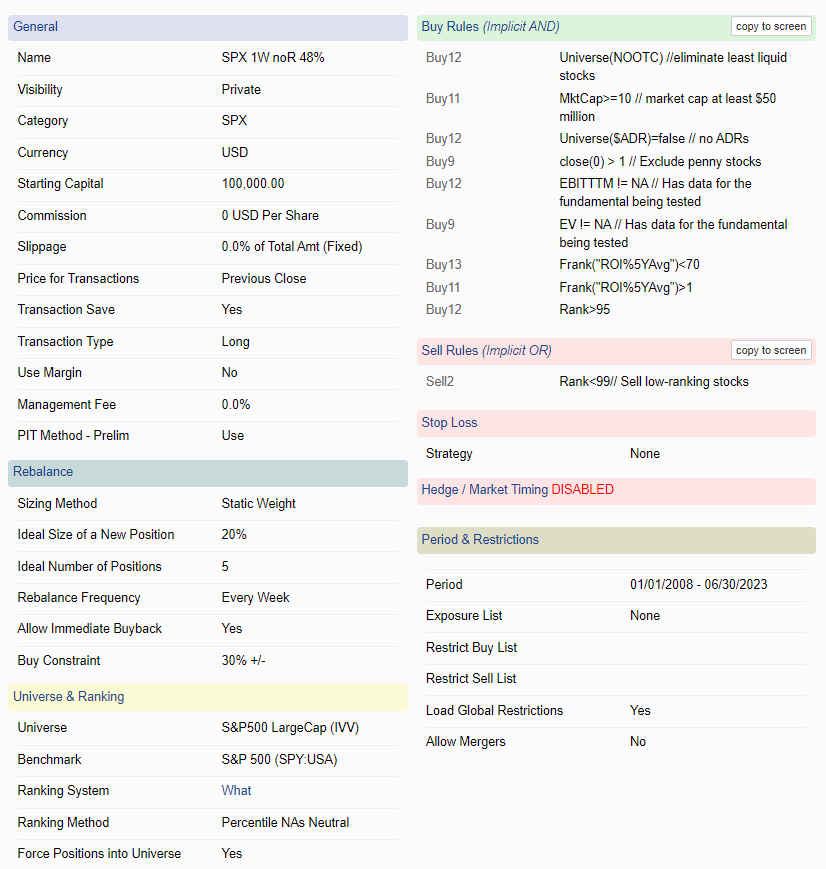
This is the setting, i know that most of the buy rules does not apply to LargeCaps i just put it everywhere.
The reason why i want ROI to be small is that i am searching great companies without great ROI as companies with great ROI are usually cheap for a reason that can not be captured by ranking.
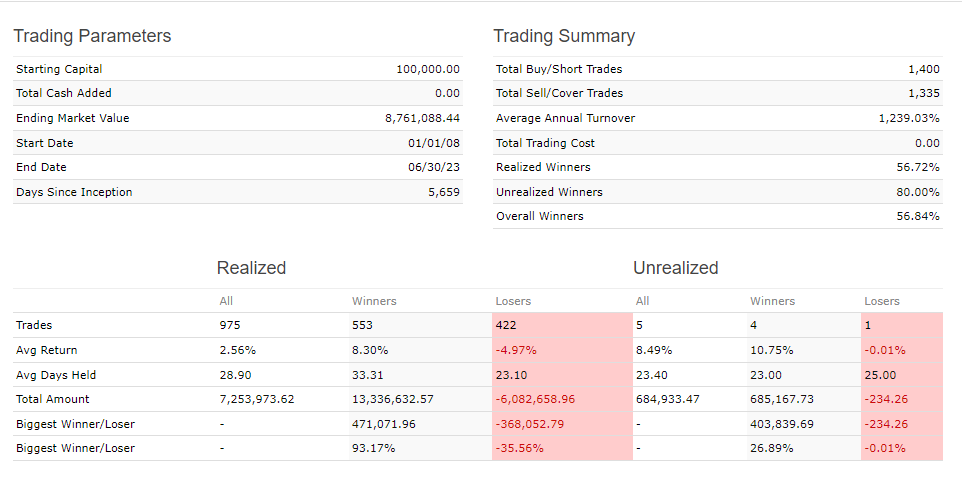
However, the median ATRN(30) for the S&P500 universe is currently 2.14%. The model returns are very close to daily price noise. Especially with 0% slippage.
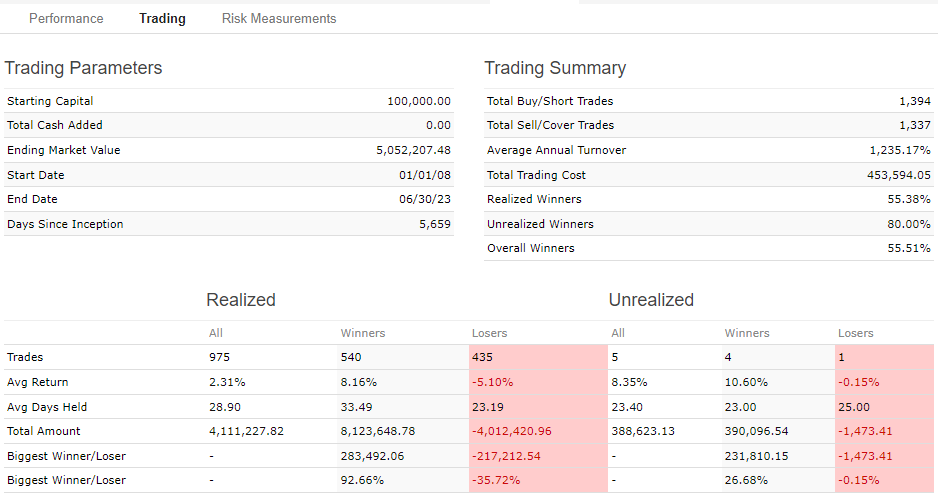
Set slippage to variable.
This probably won’t help the Realized Average Return much, but I would move the stock screening rules from the buy rules into the Universe proper - i.e. Universe($ADR)=false, MktCap>10, close(0)>1, EV!=NA, etc. There’s no need to rank a stock only to screen it out in the buys rules.
Price for Transaction should not be Previous Close.
Finally, a portfolio of 5 stocks is very small. I’ve given up on that approach since the returns are extremely volatile and that volatility usually shows up when running live.
With a universe of 500 stocks and 5 stocks being selected we have a 1% sample rate. With a sell rule of <99 any slight variance will force a sale. Lower your sell rule and see what happens as the transaction list shows several sells/buys.
If you still get good returns with 25 stocks, variable slippage, last ten years only, and price Average of Next High, Low, and 2X Close, you may be ready to start trading it. The other thing to check is the year-by-year performance under Statistics / Performance. If most of your excess returns were in two or three out of the last ten years, that’s a warning sign; if you get excess returns most years, that’s great.
So Yuval has a number of great point here. All of them good, IMHO.
Counting the number of years with excess returns is excellent. It can be formalized into a non-parametric statistical method.
The advantage of looking at it this way is it gets rid of the effect of outliers. Yuval will also use median over mean a lot which is a another good way of reducing the effect of outliers. And to be sure, stock returns are not a normal distribution. With fat-tails and usually some skew to make it interesting.
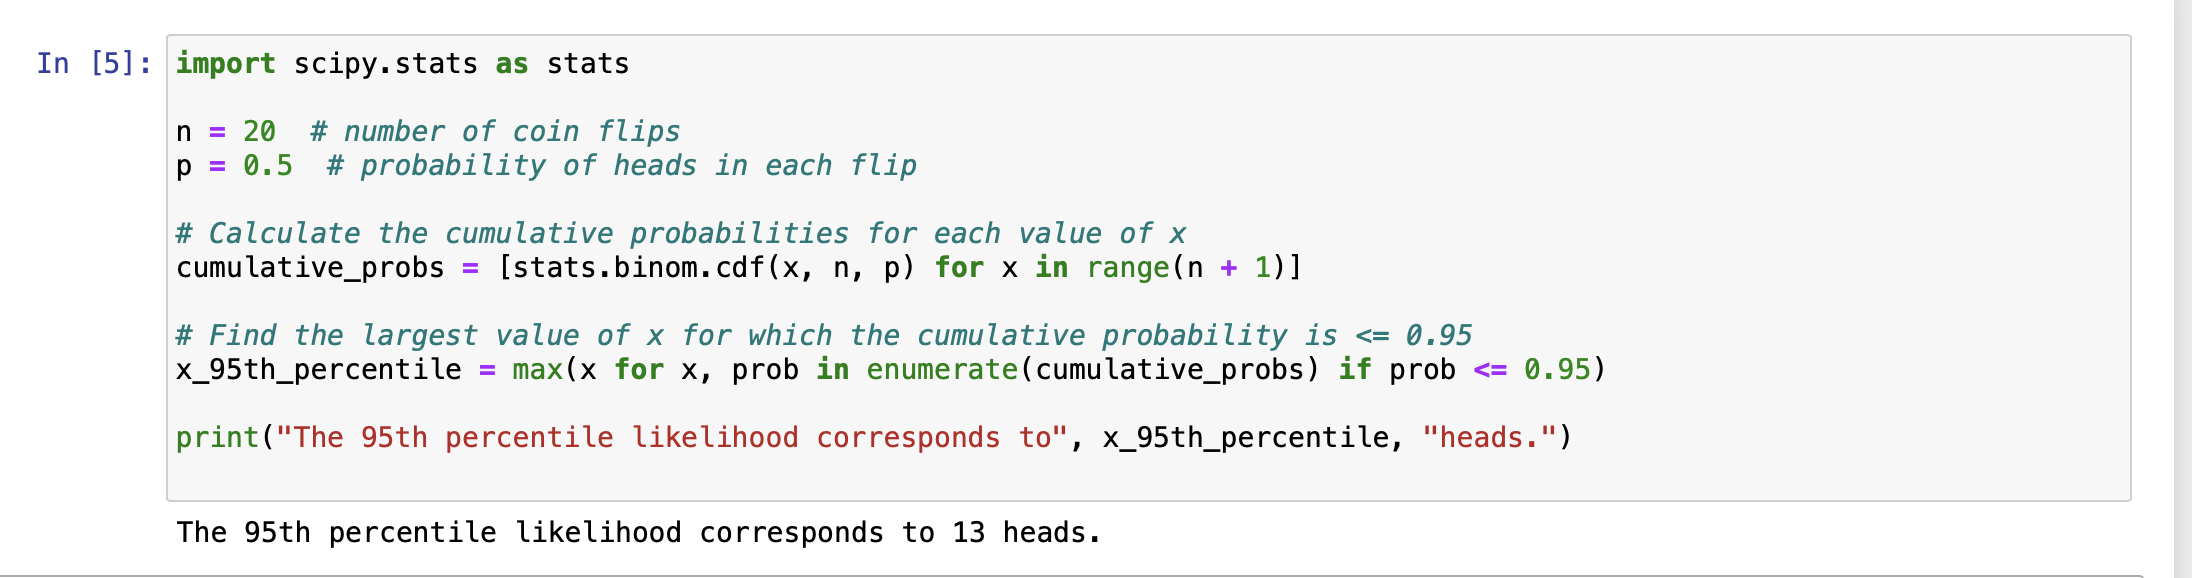
In other words, if it were random—like a coin flip–you would expect about 50% of the coins flips to be heads (or 50% of the years to have excess returns).
If you wanted to get really nerdy (which I think I am already doing) you would just run a rank-sum test.
But one could also ask what number of years with excess returns out of 20 years total has only a 5% probability of occurring (i.e., p < 0.05).
The somewhat surprising answer to me is: 13. I would have thought it would be larger.
TL;DR: Yuval makes a great point and below serves to support the idea.
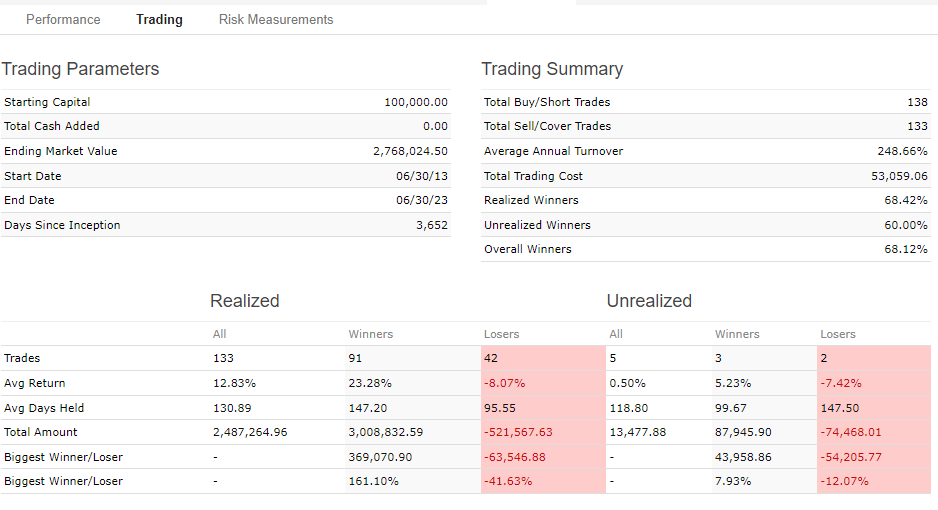
Also there are 2 measures that i use which i find extremely important and cannot find them anywhere.
Unique companies traded - Sometimes you can narrow big universe down to just handful of companies with particular properties that are traded there and back and you overfit the model
Percent of companies traded from the universe
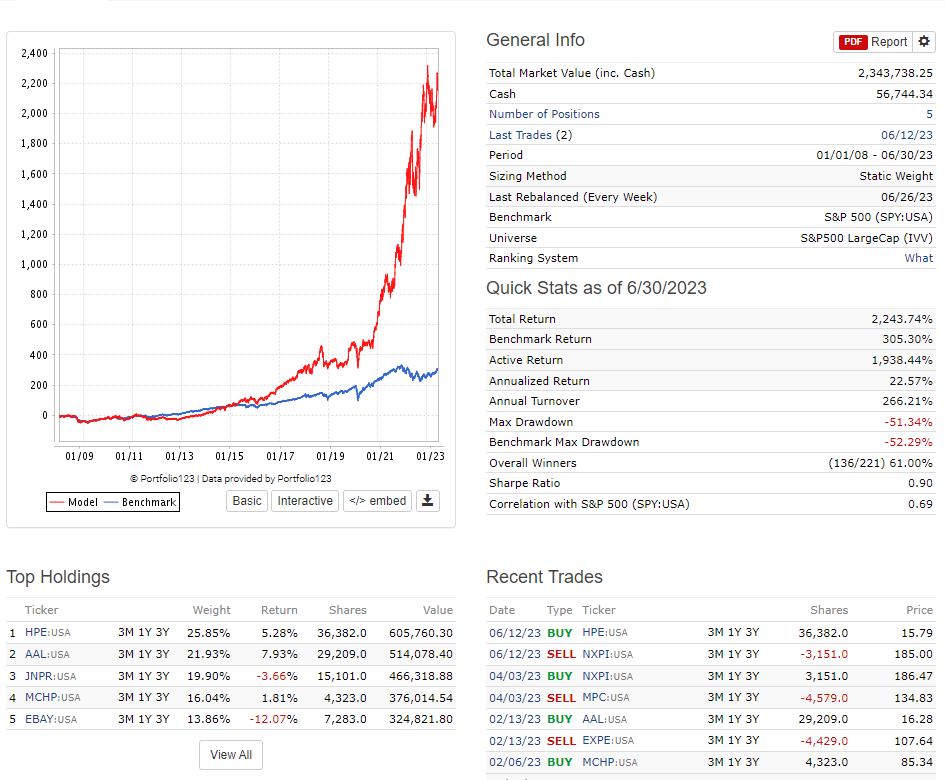
My model uses 148 different companies out of SP500 when there is 5 holdings
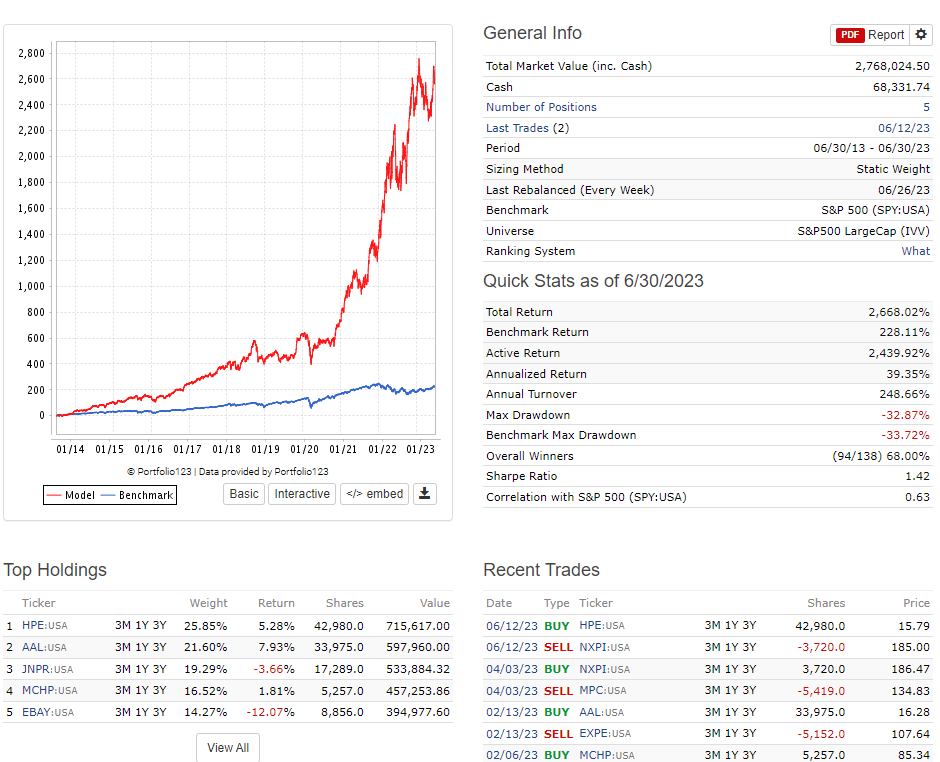
And model uses 323 different companies out of SP500 when there is 25 holdings
So this is an aside and perhaps not useful to you.
But recently I have spent a good amount of time trying to determine whether I would have abandoned a good system. Out of doubt about the system if I were running it out-of-sample.
I would have been heartbroken in 2020 if it were the only port I had been running since 2014 and taken that drawdown. Just my personality, but I would probably think (then try some mindfulness mediation to get rid of the idea or at least try to be objective): “All those years of waking up early to rebalance my port and little to show for it.”
Just me personally, I would still be able to stick with it, I think, as part of a diversified portfolio.
Edit: So actually, I do not want anyone to think that I am anything other than a complete math nerd (any Zen mediation or Zen Koans aside). I would have constantly been adjusting the proportion of my portfolio to the confidence I had in the method out of sample (e.g., posterior Bayes Factor). Using Bayesian Model averaging (increase the weight as it proved itself out-of-sample and occasionally decreasing the weight). But adjusting the weights of each strategy in a diversified portfolio. Diversification being the key whether you happen to be a math-nerd or not. Truth is Bayesian model averaging is not necessary and I do not mean to imply that it even adds anything—I do not have enough out of sample data.
But diversification and, for me, a little math is the only thing that would have kept me invested in that port.
Yes actually this is just one of my 10 models for SP 500 each of them are 30-40% returns and they have quite low correlation as they use different ranking and 4 different methods
just ranking
Moving average ranking
Rank delta ( change in rank)
change in moving average rank
My problem is that just my diversified SP500 portfolio using all 10 strategies generates
30 stocks when 5holding per strategy with 30% annual return including variable slippage
and 50 stocks when 10 holding per strategy XD 25% return including variable slippage
It also works for SP400 and SP600 fro 5holdings and 25 holdings so it should be fine
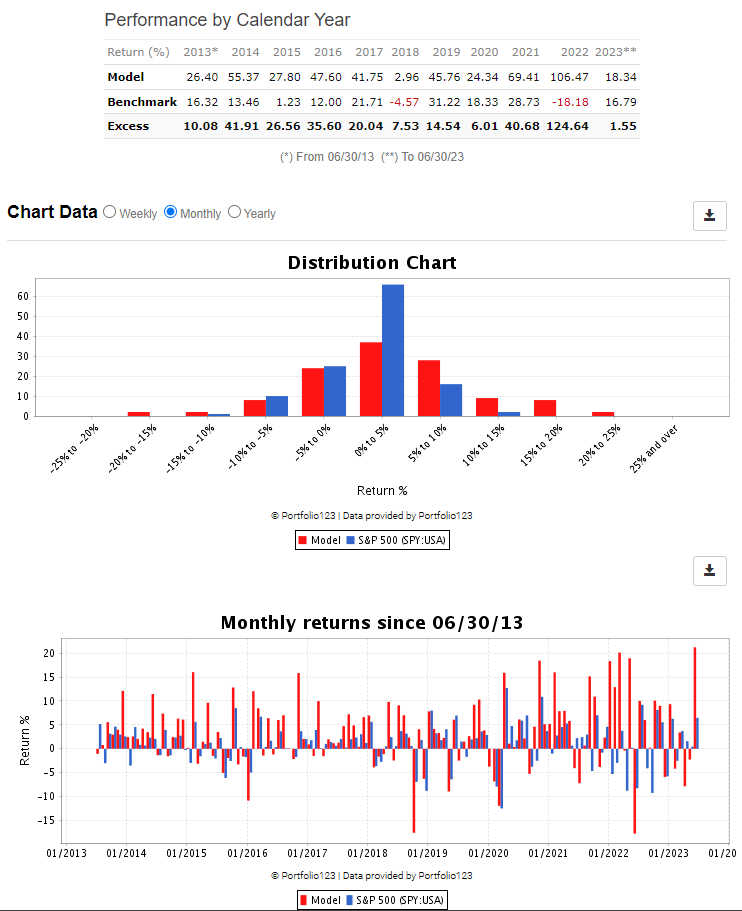
It’s interesting how your model has bursts of very strong returns. That’s very different than my S&P500 model which chugs along with more moderate benchmark beats. Yet both models have similar performance over longer periods (when reconfigured to 25 holdings, my 10y AR is 19%)
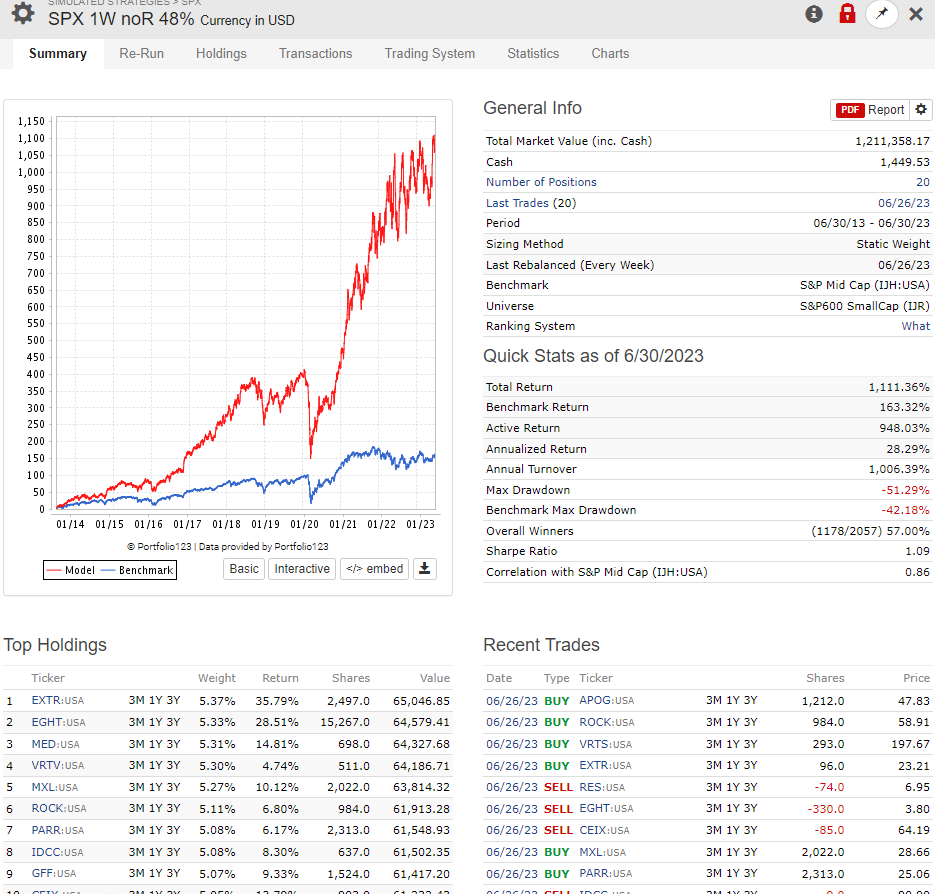
Its interesting i just noticed that my model never invested into any of the Mega caps
None of the FAANGS not even berkshire or nvdia.
That is good, that means it is independent of the MegaCaps returns, should be safe from the Big cap collapse
It also explains why it is flat from 2018 to 2020 and wh it hesitated after covid.
Also Beating SP500, while not using any of the mega caps is quite achievement, when mega caps are responsible for 40% of SP500 returns, without mega caps SP500 has return only 8,5% per year for last 10 years
I’m on the other side of your trades! The 25 holding version is about 20% megacap and the median price/share is > $300.
Price per share isn’t one of my usual metrics to watch. I just mention it b/c the model holdings are so skewed towards expensive $/share that I initially found it surprising.
If you want, since my S&P500 model is a Designer Model, you can add it to a book simulation along with your models. Perhaps the correlations are low enough to be an useful adjunct.
Found it
If i add yours with 33% weight, the return drops by 3% and it increases sharpie and increases SP500 correlation
I have correlation from 0,6-0,7 you have 0,83
But you have much lower turnover, i have 500%-1000% you have like 70%
So my turnover cost drops my returns closer to your return
Might be interesting addition i will think about it.