I am simply looking at the performance of EPS10YCGr%.
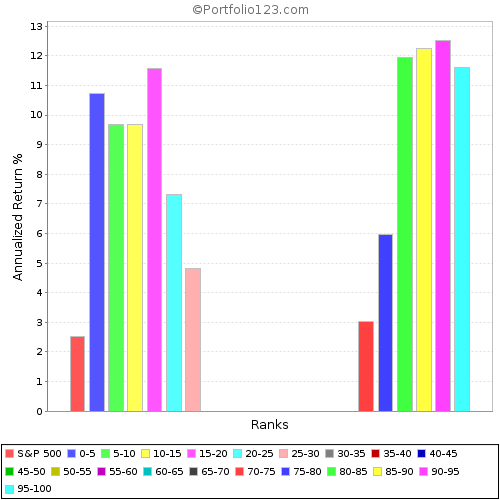
Wanting not to penalize companies with shorter operating periods, I made NAs neutral:
(see attached “xxxNEU” until I figure out embedding)
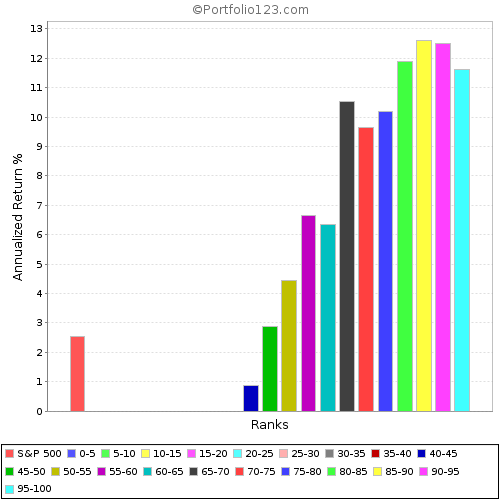
The “NEU” image looked strange until I realized all the NAs were in the middle, and that explained the gap. So I reran with NAs negative:
see “NEG” file
Now this ranking makes sense; note that it ranks as you would expect, the best growth had highest returns and it correlated as growth declined.
The PROBLEM is that the 1st chart now looks erroneous. The top chart - NAs neutral - should show the same returns as the bottom chart, except there would be a big gap in the middle. The NAs, which are “bunched” to the left in the bottom chart should simply shift into the middle; the “expected” returns should still correlate (from low to high looking left to right).
The main reason for the different hight of the left positive bars will be, that the number of negative, NA and postive values varies during the simulated period. Therefore, if NAs are arranged in the middle, in the buckets 70-80 sometimes will be NAs, sometimes not. If you arrange NAs to the left (=negative), in the buckets 70-80 will almost never be NAs. Therefore, in your 2 rankings, in these buckets are (some) different stocks, which leads to different performance (The same in some other buckets).
The performance tool is not suited for individual factor testing, specially when many NA’s are present.
The results seem counter-intuitive because there are a lot of things going on: the total number of NA’s in 15 years for EPS10CGR% varies greatly. In the 2008 crash years there were 2000, 3000 otherwise. The way stocks are bucket-ized by rank can create buckets with disproportionate number of stocks. Some years the bucket can have 0 stocks, then some stocks for a while, then none again. The return is then annualized, but it’s meaningless, but you can’t tell that from the results.
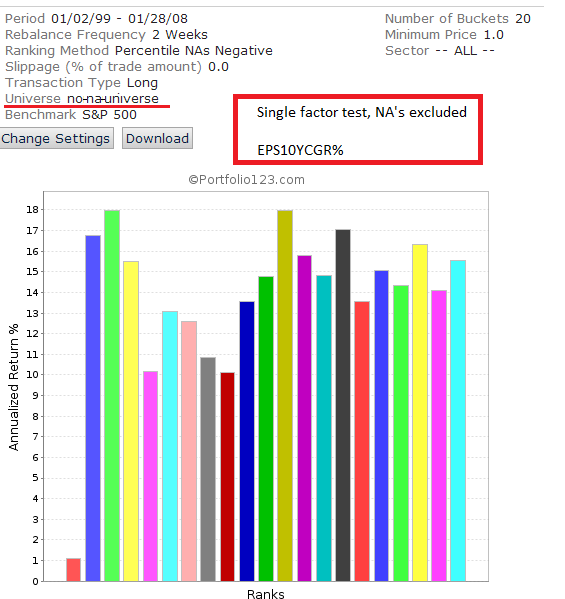
In fact EPS10CGR% by itself seems useless. Try this:
Create a custom universe with this rule: EPS10CGR% // this elimiates any stocks with NA
Run the Rank Perf test of your EPS10CGR% ranking system using the custom universe above.
The result shows a completely random bucket-performance correlation (see image)
The rank performance tool in it’s current implementation works well is there are multiple factors which makes the stock ranks all different. The steps to do factor by factor test like above are very time consuming. We have some ideas on a new tool to make factor (or small group of factors) testing easier and quicker
Is this desribed procedure of creating a seperate universe when testing a single factor in the ranking system still the way to go to determine its the bucket-performance (in case of many NA’s)? Or have new tools been developed?