Dear All,
A new odd-ball function is available in the screener that produces a Correlation Coefficient Matrix in the Screener report. You can find the documentation under: SCREENER->Show Correlation Matrix in report
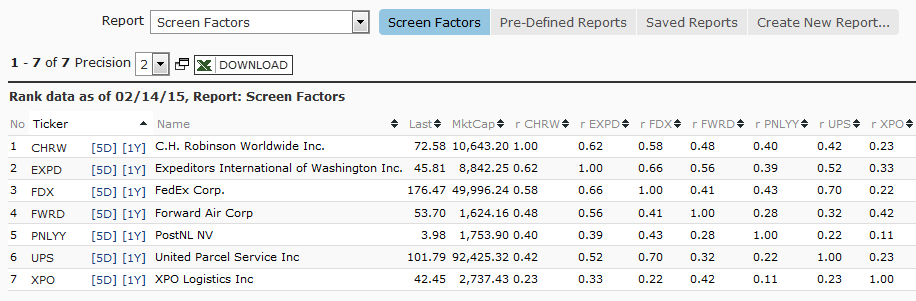
For example, to create a Correlation Matrix for the 1 day returns for the past 3 months, for stocks in AIRFREIGHT , with market cap greater than 1.5B , enter these rules:
Industry=AIRFREIGHT and mktcap>1500
ShowCorrel(1,62)
Click Run-Screen , then select the report “Screen Factors”
You should see something like the image below (showCorrel automatically creates the necessary columns using the tickers)
Cheers