We have released new logic that handles companies that switch to/from quarterly data from/to semiannual data (and sometimes multiple times). Previously, we simply started the point-in-time history anew after a company switched. This causes ratios like TTM growth ratios to be NA around the switch, and it takes a while to settle back to not being N/A.
In Europe, around 200 companies have switched recently. You can find these companies with this rule: InterimMonths(0) != InterimMonths(8). In North Atlantic, it's also around 200 companies. (Do not use odd numbers in the inequality since that resolves to the gaps we insert.)
Your models should not vary much. Depends on the universe you use and the rules. Our own European model changed slightly when re-run. NAs can still happen around a transition, and there are still several outlier cases we are working on to clean up the mess that FactSet gives us sometimes. They just process whatever they get their hands on, and it's up to us to make sense of it from a historical/backtest perspective.
N.B. if your rules rely on quarterly changes, like Q over Q changes, it's best to create universes that eliminate companies with semiannuals with a rule such as LoopSum("IsNA(InterimMonths(CTR), 3) != 3", 2) = 0 since Q over Q for semiannual companies will still result in NAs since we inject empty 3 month gaps in semiannual periods.
In hindsight, this project should have had a higher priority since companies switching to/from semi-annuals are more common than we thought. We took the easy route at some point many years ago and did not look back until now. The fact that we hardly ever had any complains about values going to NA certainly made this project a lower priority. It's also good to see that our own model was impacted just slightly.
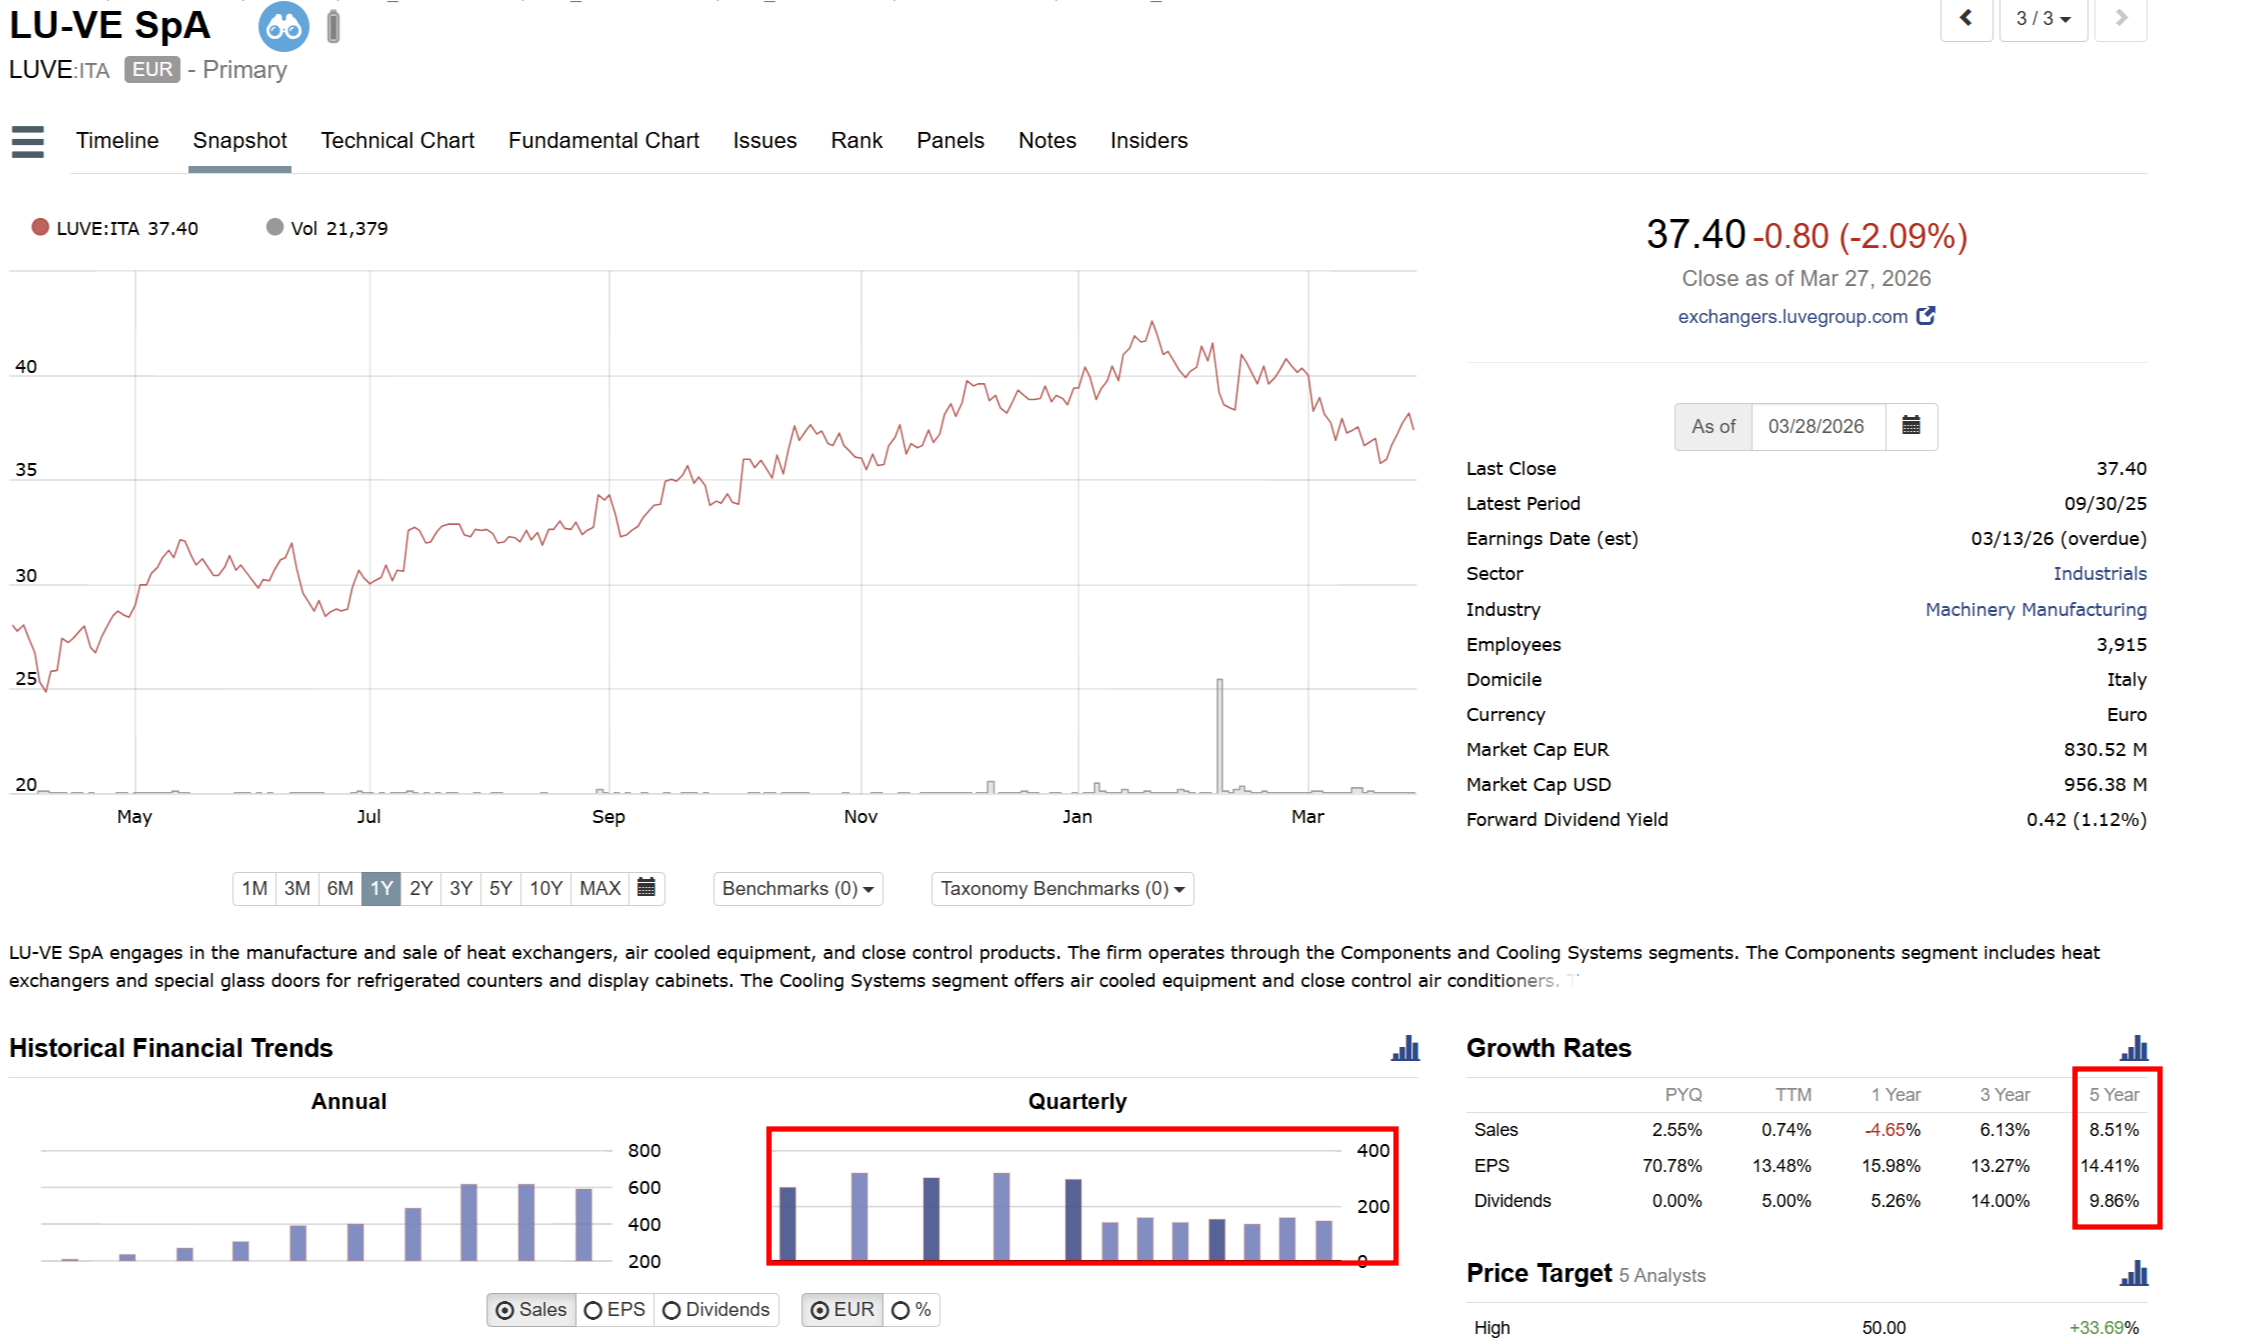
Below is an example of a company, LUVE:ITA, that switched to quarterly reporting in 2024. You can see the gaps between quarters cut in half, TTM growth rates evaluate well, as well as long term growth rates.
Let us know of any questions or concerns you have.
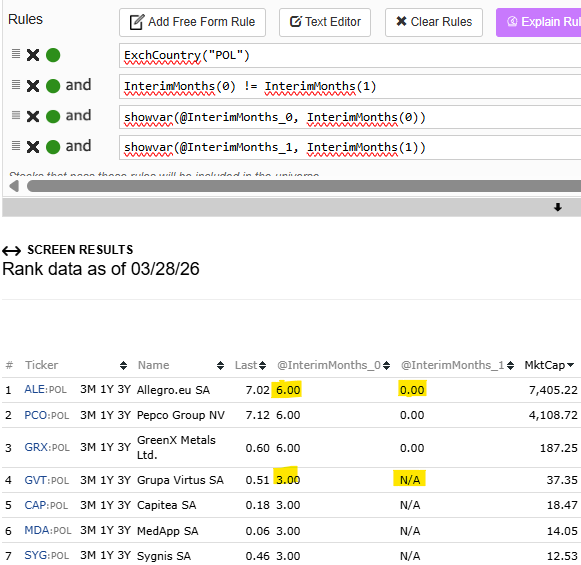
Looking at a set of Polish stocks using the rule InterimMonths(0) != InterimMonths(1):
How is it possible to have InterimMonths(1) = 0?
Does InterimMonths(1) = N/A impact fundamental data availability? All stocks showing N/A only have one data point, even though most have reported financials for a long time.
I just screened my live universes and currently 9% of the stocks in universes that includes semiannual reporting stocks, and about 6% of the stocks in the universes that excludes semiannual reporting stocks is effected... so this will have an effect on my strategies. Is there a way for me to compare strategies before and after the change?
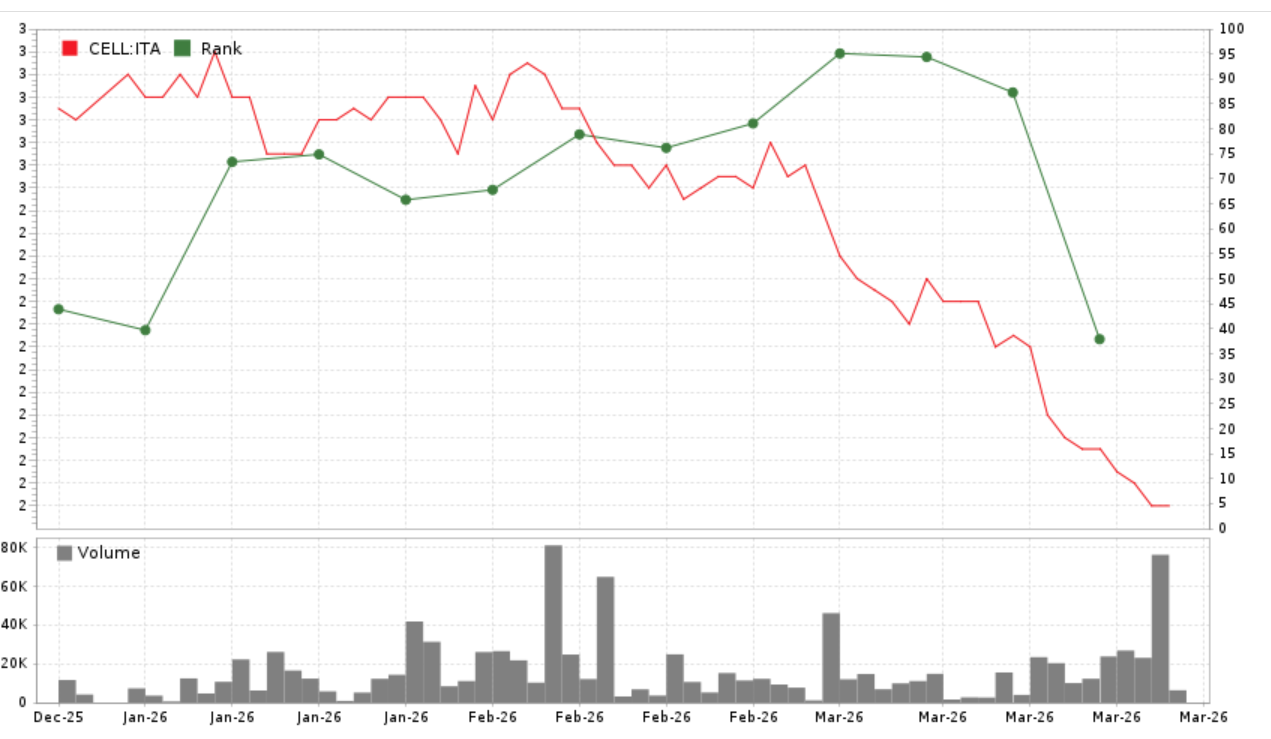
Currently holding 4 stocks that are effected, of which one gave me a sell signal now (rank dropped to 45%).
We add a dummy statements with all zeros in between semi-annuals to keep everything on the same basis , which is 4 interims per year. This is intentional. You should not use odd offsets with semi-annuals. Only TTMs are safe when there are mixes of 3 months and 6 months periods.
N/A is not the same as 0. It means there's no more history, or we stopped because of gaps. GVT:POL is a complete mess. Not much we can do with it. The most recent Q was 9/30. We stop there because there's a gap to 3/31. Also, many quarter the company reports revenues close to 0.
Could be a prelim issue. I bought it on Feb 27, but when I go back and check the rankings now, this stock would never have received a buy signal with the new update...
Unfortunately this change seems to impact my two actively traded models negatively if I compare it with simulation prior to the update (which I luckily have because I don’t know how I would make the comparison otherwise). My simulated return and alpha drops by 1-2% (about 5% relative). The number of stocks that are affected are about 1% in my universe but apparently they have an impact. Maybe this is all within the error margins but it may also point to a deeper issue with my models.
A few questions:
I use multiple factor that include % growth of previous year quarter over last quarter fundamentals (Gr%PYQ). These are Y over Y values but for quarterly results. I thought that these would be semi-annual year over year growth values for companies with semi-annual data. Is this correct or am I making a mistake here? Are these values negatively impacted for companies with semi-annual data with this new algo change?
A change of an algo makes all our past work/analyses less accurate. I know that it addresses an issue with the data but it can impact our output negatively (and our output is what matters most to us). For example, maybe the error allowed me to unknowingly filter out companies that reduced my return? I wonder if you could work with multiple production versions so we can switch only to the version with updated algo if it makes sense to us.
I haven’t looked at this for a while, and to be honest, I wasn't as thorough as I could have been. I stopped once I realized that the changes I was making in my own code had little effect—and when they did, they were actually negative.
Why the negative result? For the US market, adjusting those semi-annual results almost always reduced the rank of ADRs. It’s a classic confounder: the accounting is now 'right,' but those ADRs might have been significant alpha drivers during the period you're looking at. Peterfin1979 also sees a drop in CAGR. I would be interested if the ADR explanation holds up on closer examination."
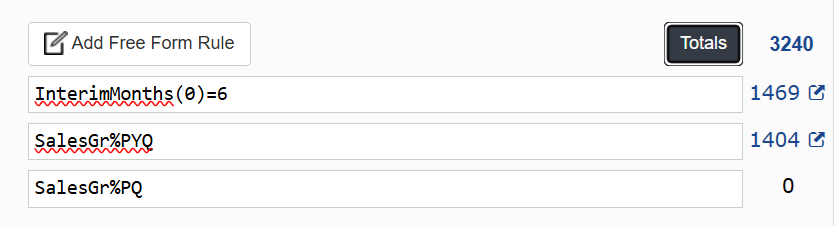
Should be ok with a caveat (see below). We insert a dummy empty quarter when a company reports semi-annually, and the most recent period will always be valid. So as long as you use even offsets you should be ok. So that's why %PYQ works, but %PQ does not. The first uses offsets 0 and 4, the second used offsets 0 and 1 so it results in N/A.
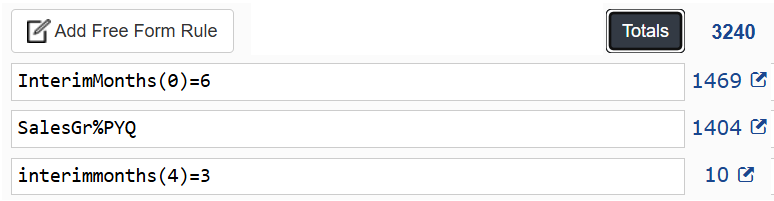
I just thought of a potential problem. If a company switched from quarterly to semi-annuals, %PYQ might use a 6 months period and a 3 month period. There are currently 10 such companies in Europe right now. We need to revisit the %PYQ formula to resolve to N/A when there's a mismatch in period lengths.
Very sorry about this. Should be an easy fix.
You can find these companies with these rules. They have grossly overstated %PYQ (just compare %PYQ to %TTM)
// Find stocks with
InterimMonths(0)=6
SalesGr%PYQ
InterimMonths(4)=3