I am starting a new thread on how to achieve consistency of zscores (or min/max scaling) across downloads as to not take over the release thread more than I already have…
Here is the best known suggested method at the moment per the original release thread:
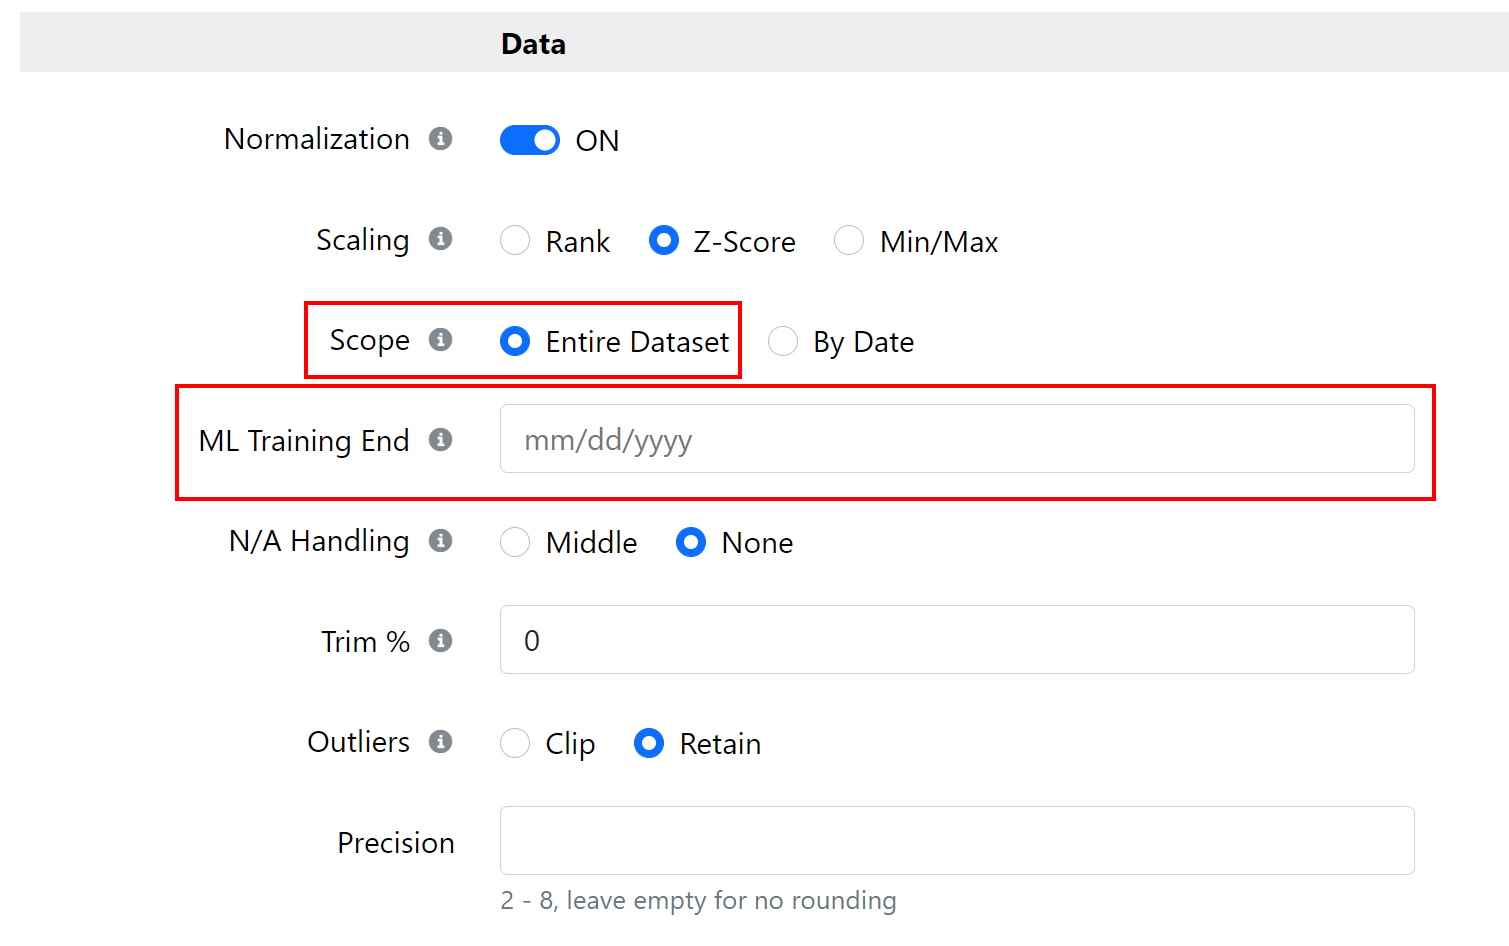
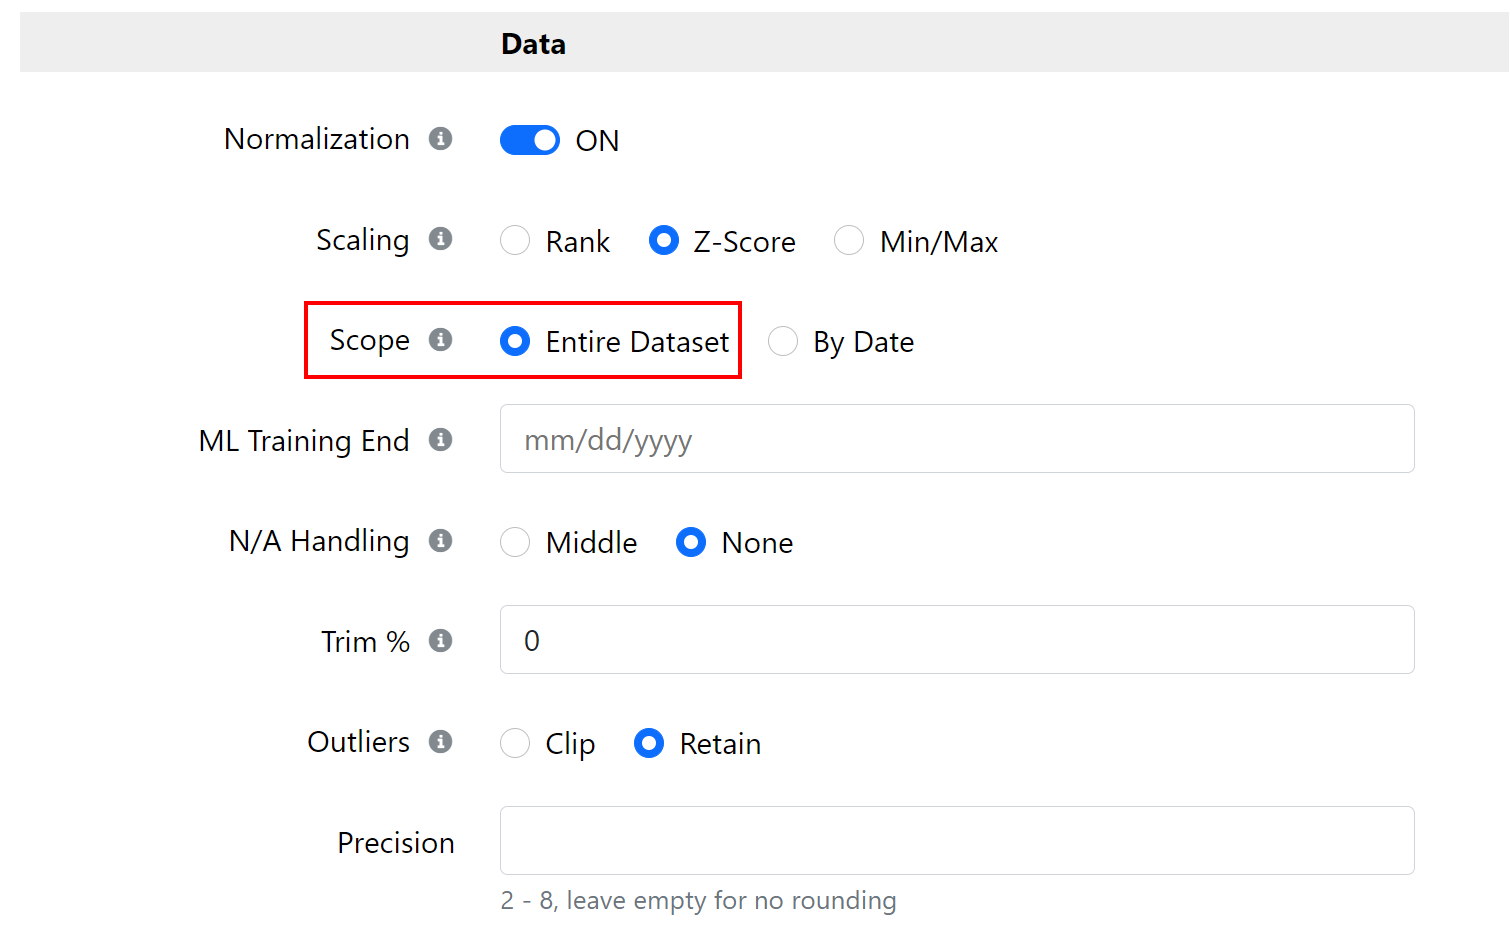
Download data from the same starting point every time, then use same ML end date for every download:
Upsides: your zscores will all use the same mean and std and thus be consistent across time
Downside: you have to download everything again when you want to add new dates…
Thoughts on alternate methods:
Best: P123 saves the mean and std for future downloads
Would be nice, but probably does not work: rescale new data to match old using overlap period (but not the entire dataset). I will add to the thread if I get better proof this might work!
I don’t understand yet, but should work: use min/max instead of zscore and use trimming:
Likely other more complex and less 100% accurate statistical methods. Feel free to post on them, but I have not dug into any.
@ marco. Thank you.This requires all of the data and you are thinking you can use this for k-fold validation, I think.
It works for that I believe.
It still requires a full download of all of the data for every rebalance to keep the linear scaling coefficient constant, if I am correct. Almost no one is going to do that I would guess.
You might need to look at ease (and cost) of rebalance as a separate issue if you want this t take off.
Have a 1 week overlap with common stocks:
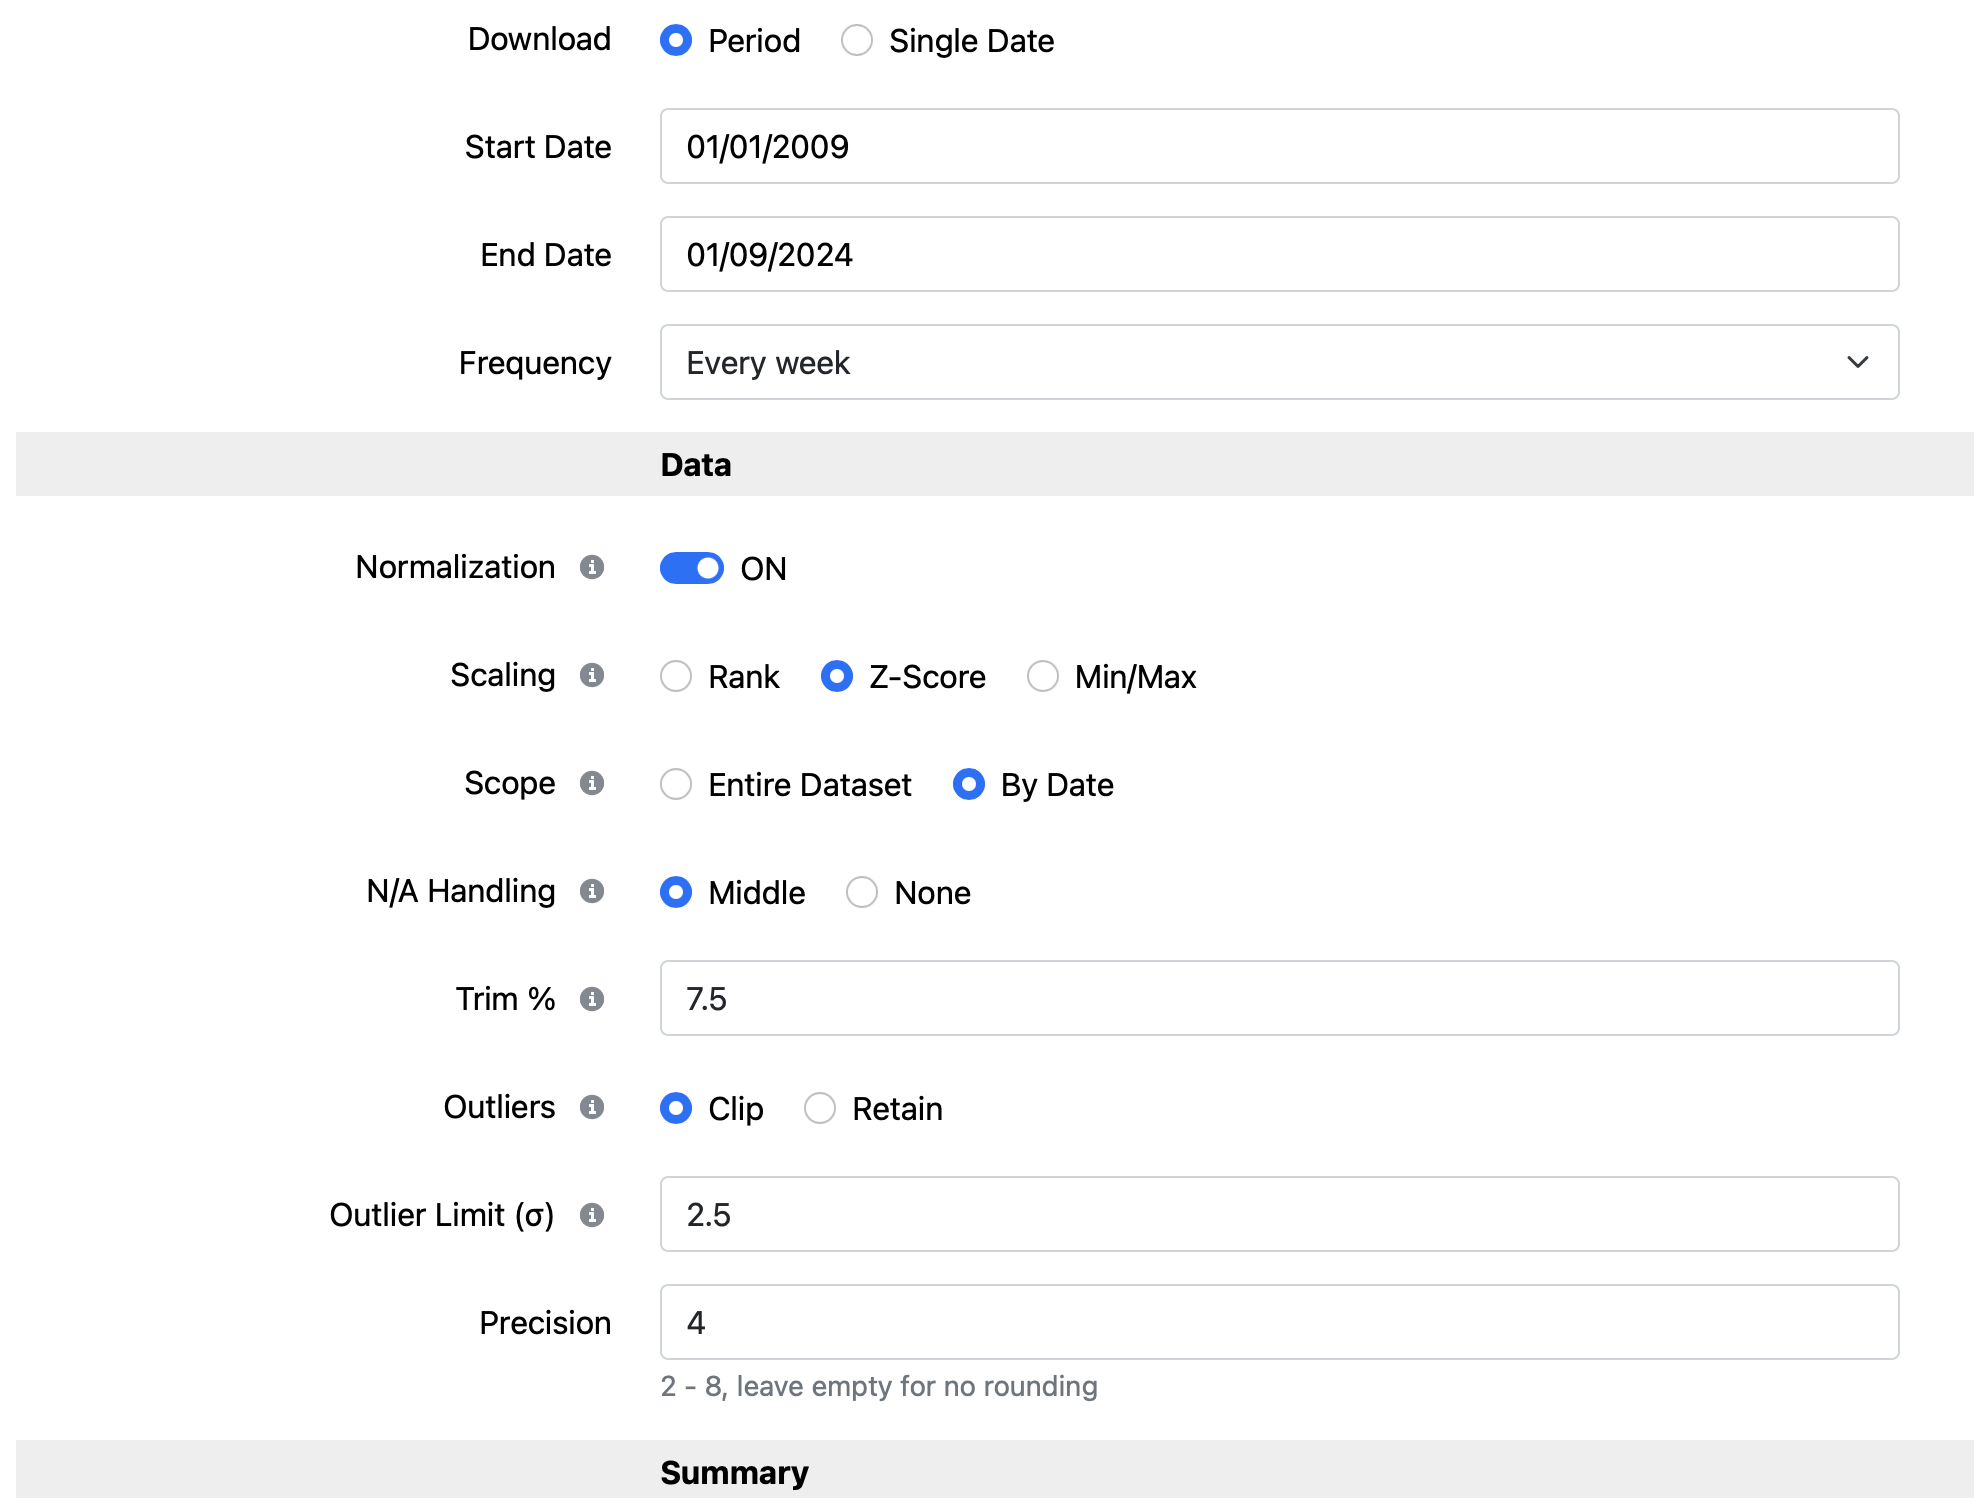
For the sake of my proof: period 1 is 2017 through the end of 2020 and period 2 is 2020. I also put a ML Training end of 2020-02-07 to remove the crash from both datasets and make it a bit more realistic.
Now some algebra as a basis:
zscore = 1/std_total*(value - mean_total)
where:
std_total = the standard deviation of the factor values for the entire dataset
mean_total = the mean of the factor values for the entire dataset
For a factor in dataset 1 and 2:
ZS_ds1 = 1/std1*(value_ds1 - mean1)
ZS_ds2 = 1/std2*(value_ds2 - mean2)
For the same date and stock we know that the factor value for both datasets is equal. Now we can solve for the zscore value for dataset 1 according to the value in dataset 2:
value_ds1=value_ds2=std2 * ZS_ds2 + mean2
Plugging this back into the formula for ZS_ds1:
ZS_ds1 = 1/std1*(std2 * ZS_ds2 + mean2 - mean1)
Now I will rearrange a bit to try and make it look like the formula for a linear equation: ZS_ds1 = a * ZS_ds2 + b
ZS_ds1 = std2/std1 * ZS_ds2 + 1/std1 * (mean2 - mean1)
Where:
a = std2/std1
b = 1/std1 * (mean2 - mean1)
Now we have a linear equation to convert zscore 2 to zscore 1. Now I need to find the coefficients. We don’t know the original means and std, but with one week of overlap we can plot the zscores from the two datasets against each other and calculate the slope and offset. Or just use a few points to do it.
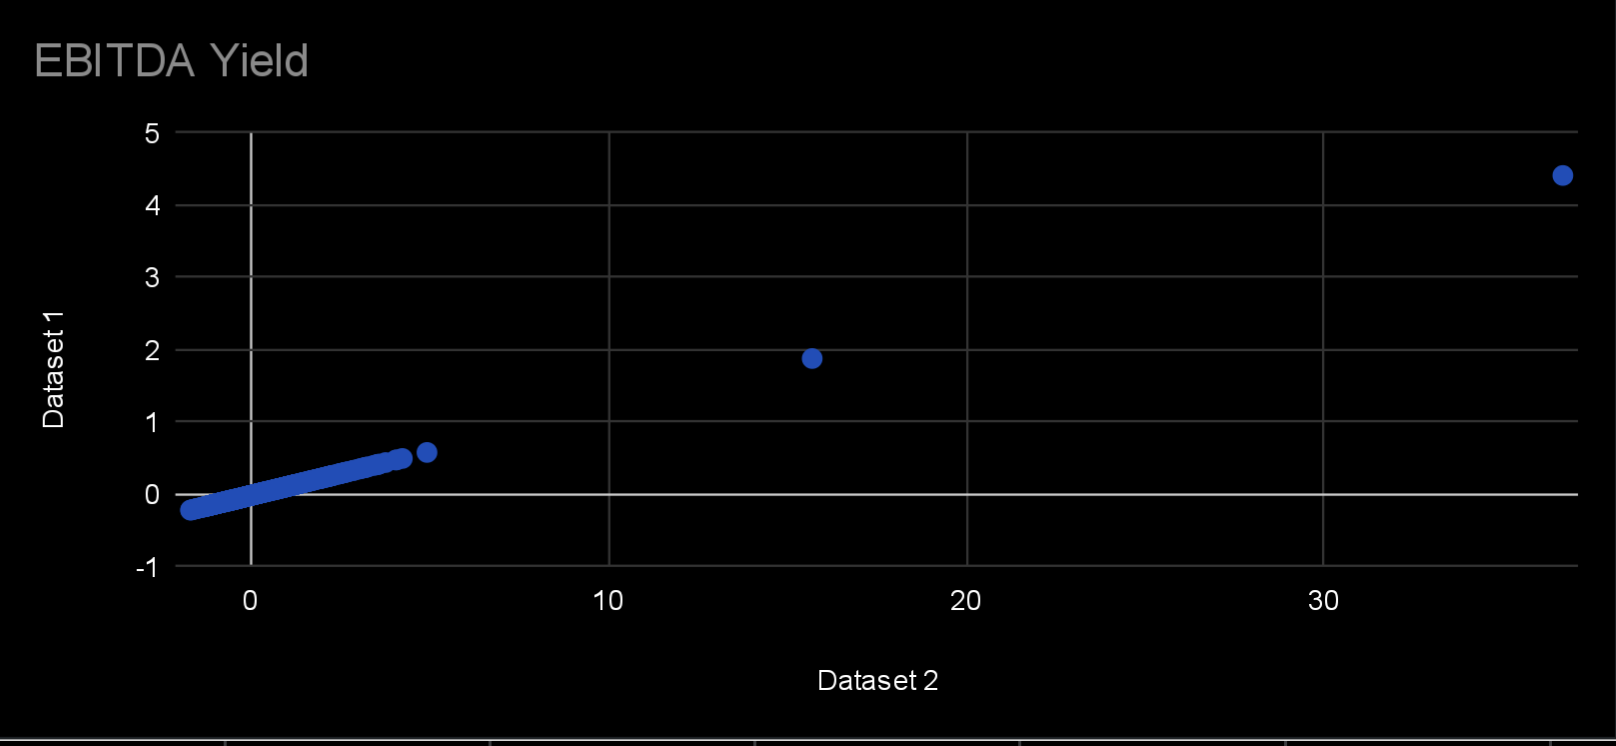
Here is a plot of two weeks in Feb 2020 to help convince you that it’s a linear relationship and that the slope does not change across dates:
This is Feb 22 and 29th 2020 for the SP500 universe, but I don’t recall which dataset is the longer period at the moment.
Edit: I realized the values for EBITDA Yield may not change with the market crash. I’ll have to do another test with say price zscores. But I don’t think that invalidates the method. Just means my visual proof is not useful…
Please let me know if you see any errors in my logic!
It is good to see a real mathematical proof in today’s modern world. I think your logic (proof) is good.
Assuming FactSet does not go back and revise a data point that you are using (in the overlapping week) I think you have a good proof!
Please note that you have to redo all your math at each rebalance (the new week will change the mean and standard deviation on your latest data set). Or do another full download.
I wonder if @Marco might want to help with a guide on how to rebalance each week using an example of someone who trains on 24 years of data. It seems unlikely that P123 has not considered rebalancing issues at this point. I am not a paid employee of P123. I had no part in developing this. Ultimately, I have no answer on a reasonable way to rebalance weekly and no insight into P123’s thinking on this.
Thank you for the check! It’s hard to see your own mistakes, so always great to have another pair of eyes. I want to do a few more checks with the actual data, but very promising for using zscores! I think the R^2 for the the linear fit should be perfect (I believe 1) which makes an easy check.
Also totally agree the math needs to be done for each rebalance, but still better than a full download in my opinion. I think the workflow would be:
Download your training data
Download your rebalance data with one week of overlap
Calculate the linear transformation coefficients with the overlapping week. For the linear fit the x values are the new zscores and y the training data scores. Also make sure the data is aligned!
Update your zscores for the new data with the linear equation
Okay, I fully agree. Some expansion on details that do not affect your point.
Steps:
Programming in Python the mathematical derivation of the mean and standard deviation you have outlined. I have no intention of ever doing this so I cannot detail it here. Plus it is early.
This needs to be done for each feature. How many factors/features or columns do you have?
The math needs to be done for each stock in each column. Too tedious for me if I am to use an Excel spreadsheet. I would probably start with a spreadsheet but could move it to Jupyter Notebooks, I think. I would have to really.
Whatever you uploaded to Jupyter notebooks, Python could make quick work of it. Maybe Python would sort the predicted returns.
In-lists or something else could be loaded into P123 and this could be use to rebalance within P123, I think.
I get that you can do this daily if you use the API so not an issue.
Honestly, that is the best I have and I have condensed the steps above. I wonder if @Marco would put that (or whatever he recommends/modifies) into the documentation for the new users he wishes to attract with this new feature (and for quick reference for me if I ever decide to use it).
Let me add that @Marco made a good point about Min/Max. I had not explored it and really did not even know what it meant. I am sure Marco understands the issues and I am sure he will have a solution But if not, I am fine with what I have. I hope I have contributed to an understanding of what is necessary to make predictions and leave what I say to that.
As far as contributions, I think you could basically make the same proof you did above using the Min/Max coefficient (and y-intercept since the min is always 0).
Maybe a little more straight-forward and intuitive. Edit; not really less math with the y-intercpt.
Caution. If you use the Min/max method, for prediction at least, it is easy that think that you can just find the mean and standard deviation of the training data and use those numbers on the validation data. That is simply not the case, I believe. It will be more involved and akin to what @Jonpaul has so kindly shared above. I was fooled for a moment anyway. It is kind of like the problem of converting a temperature from Celsius to Fahrenheit. You can just multiply by a single number with that or with this,
If I had a different method it would probably still be tedious and I am not sure that an exact method (if I had one or one even existed) would be something @Marco would want me to post. So I will say I don’t have that and am not sure closer and closer approximations may not belong in the forum.
Trim % will remove 7.5% of outliers on each side, and throw them away?
This 7.5% means only the core data of 85% is kept? in this case every day for every factor. → I guess im wrong, 15% throw away is lot
Than the outliers will be clipped: this is the setting for “Trim %” to throw away(clip) or retain=set to min and max value
To check the return of the strategy, somewhere I need the return of the stock for the holding period.
I guess close / close.shift() will not provide the correct return…at least I did not manage to get good results.
the other option would be Ret1W%Chg.shift() for the selected stock.
(This comes in percent I guess, so I need to divide it by 100)
But is this synced with the weekly download?
Do you have some other suggestions?
Next I need some return for the label.
In you library there is: FutureRel%Chg_W(21, GetSeries(“SPY”))
This should be a 21 week return with shift(-21) days.
Is there as well an excess return against a universe which is not shifted in time.
I would like to use a 21day excess return and just shift it 2 weeks instead a full month/21days. I could do it directly in my program and be more flexible with the shift from the future.
If you’re trying to build a portfolio based on predictions, you might be better off pulling future performance, (i.e., Future%Chg_D or FutureRel%Chg_D). Be sure to plug a days argument consistent with your data frequency. There shouldn’t be any alignment issues as long as the days argument is a multiple of 5. This will always produce Monday-to-Monday returns.
FutureRel%Chg_W was found to have problems that couldn’t easily be solved and has since been removed from the reference. We recommend using FutureRel%Chg_D instead, multiplying the period argument by 5.
You can find 21-day excess return shifted by weeks with a formula like FHist("Ret%Chg_D(21)", -2).
Sync to download always assured if I take a multiple of 5 days (no worries about holidays)
Ret%Chg_D(5) absolute returns to calculate strategy returns
Rel%Chg_D(5, GetSeries(“SPY”)) to get excess returns against the S&P500
in the case 2 and 3 I need to take care of the shift in the python code (preferred)
This is correct?
This was a bit confusing, as absolute returns should have no series: Ret%Chg_D(bars [,offset,series])
Yes, the _D flavor of functions when provided multiples of 5 will always pull week-aligned values.
If you prefer to shift things yourself entirely, you can definitely stick to Ret%Chg_D and Rel%Chg_D exclusively. Otherwise, Future%Chg_D, FutureRel%Chg_D, or FHist can do some of the work for you.
The series parameter of Ret%Chg_D allows one to pull return from a different stock or time series. It will operate on the stock’s prices when not specified.
Just downloaded the data and forgot to use skip normalization for Ret%Chg_D(5) and Rel%Chg_D(5, GetSeries(“SPY”)) .
It looks like I need new credits if i want to use skip normalization for that part of the data.
The first download used all my credits for the month.
Can I buy somewhere shortly just 1000 or 2000 credits???
I’m just feeling like a junky not getting the data
@marco
Is it possible to download data for ratings (pre-defined and custom), e.g., for Rating(“Core Combination”) ?? What i mean is the rating calculated for each stock in my universe.
Currently I can not do it. The error message is: 'Error near ‘Rating’: Invalid command ‘Rating’