NEW 'Factor List' tool for downloading data for AI/ML

Marco, I just caught up on your post. Thanks a lot for sharing those screenshots; they were super informative. I'm glad this is real and I would like to be invited to test it out.

I did notice, though, that we're missing some key statistical data needed for analysis. Specifically, we need the t-stat of the signals in ranking (alpha/st. of alpha) to assess their significance. While the other tools are great, they don't pass this most basic test. It's crucial to determine the statistical significance of our alpha predictions, which API usage doesn't enable us to solve on our own. P123 design prevents us from doing this on our own.

The second thing we cannot do due to p123 design limitations is correlation matrices. If a user, like me, wants to create my own risk model without any help from p123, I cannot. It's such a simple addition yet years pass and even the most simple ETFs, like USMV, use these matrices and here we are without such data.

Making decisions with less data is not smarter.

There is a concern using t- or F-statistics for hypothesis testing since they rely on normality assumption and stock returns are nothing like normal. I'd rather use non-parametric tests. Yet the whole concept of testing is questionable since return distributions are highly non-stationary and samples not independent.

2 Likes

jvj,

You make some valid points I believe.

So to P123's credit they did provide a non-parametric method with the Spearman's Rank Correlation.

I like Bootstrapping a p-value as a one of several non-parametric methods I have used. For now, you can download a 20 bucket Rank performance test onto your desktop and name it Bootsraped_p_value and then run this code in Jupyter Notebooks without modifying the spreadsheet (adjusting the file path for Windows if you need to).

Here is a screenshot of the output for the code using the download of a Rank Performance test as an example:

import numpy as np
import pandas as pd

# Load the CSV file into a pandas DataFrame
df = pd.read_csv('~/Desktop/Bootstrapped_p_value.csv')

# Extract the 'Ret20', 'Universe Ret', and 'Benchmark Ret' columns
ret20 = df['Ret20'].dropna()
universe_ret = df['Universe Ret'].dropna()
benchmark_ret = df['Benchmark Ret'].dropna()

# Create the 'Ret20 - Universe Ret' and 'Ret20 - Benchmark Ret' series
ret20_minus_universe = ret20 - universe_ret
ret20_minus_benchmark = ret20 - benchmark_ret

# Set the number of bootstrap iterations
n_iterations = 10000

# Set the null value (hypothesized value)
null_value = 0

# Perform bootstrapping for 'Ret20'
bootstrap_means_ret20 = []
for _ in range(n_iterations):
    bootstrap_sample = np.random.choice(ret20, size=len(ret20), replace=True)
    bootstrap_mean = np.mean(bootstrap_sample)
    bootstrap_means_ret20.append(bootstrap_mean)

# Perform bootstrapping for 'Ret20 - Universe Ret'
bootstrap_means_ret20_minus_universe = []
for _ in range(n_iterations):
    bootstrap_sample = np.random.choice(ret20_minus_universe, size=len(ret20_minus_universe), replace=True)
    bootstrap_mean = np.mean(bootstrap_sample)
    bootstrap_means_ret20_minus_universe.append(bootstrap_mean)

# Perform bootstrapping for 'Ret20 - Benchmark Ret'
bootstrap_means_ret20_minus_benchmark = []
for _ in range(n_iterations):
    bootstrap_sample = np.random.choice(ret20_minus_benchmark, size=len(ret20_minus_benchmark), replace=True)
    bootstrap_mean = np.mean(bootstrap_sample)
    bootstrap_means_ret20_minus_benchmark.append(bootstrap_mean)

# Calculate the p-value for 'Ret20'
p_value_ret20 = np.mean(np.array(bootstrap_means_ret20) < null_value)

# Calculate the p-value for 'Ret20 - Universe Ret'
p_value_ret20_minus_universe = np.mean(np.array(bootstrap_means_ret20_minus_universe) < null_value)

# Calculate the p-value for 'Ret20 - Benchmark Ret'
p_value_ret20_minus_benchmark = np.mean(np.array(bootstrap_means_ret20_minus_benchmark) < null_value)

# Print the results
print("Observed Mean (Ret20):", np.mean(ret20))
print("P-value (Ret20):", p_value_ret20)
print()
print("Observed Mean (Ret20 - Universe Ret):", np.mean(ret20_minus_universe))
print("P-value (Ret20 - Universe Ret):", p_value_ret20_minus_universe)
print()
print("Observed Mean (Ret20 - Benchmark Ret):", np.mean(ret20_minus_benchmark))
print("P-value (Ret20 - Benchmark Ret):", p_value_ret20_minus_benchmark)

Not sure if that is helpful or if you might already be doing something like this. But P123 is not going to provide every non-parametric test we might prefer.

Also, bootstrapping can be viewed as testing a number of possible historical market conditions (by sampling different market conditions and obtaining a different history with each sample)—addressing your concern about non-stationary markets to some extent. In other words, in some samples—when using an adequately large bootstrap sample--2008 will have never occurred while in other samples there will not have been Covid. Or that period of market returns will not be in some bootstrapped samples, to be more precise. Not fitting every time to those (hopefully) rare events and/or varying the severity and length of thos events in you testing.

Jim

2 Likes

@jvj You make a good point but I don’t believe it’s one to avoid using t-stats or other statistical measures. That’s for several reasons I list below:

  1. Stock returns are widely considered to be log-normally distributed. It’s not perfect but the most widely accepted. Exhibit A would be the black scholes pricing model for stock options - it assumes stock returns are log normally distributed.

  2. There are solutions for dealing with other kinds of distributions. To do nothing, as @Jrinne implies, is folly. One can’t do statistical work but then not analyze it in a statistical fashion. This is one reason OOS performance here is largely left wanting, imo.

  3. Total, raw, stock returns are the worst measure. If you notice in my posts, I keep suggesting alpha or a less noisy return stream. I think the new ranking system is a an acknowledgment of this.

  4. P123 provides a lot of questionably valuable tools that can be a misused. By using your logic, we ought to abandon looking at P123’s simulated return stream because we can’t apply confidence to it. I do not think this is what you are suggesting yet it logically follows since we are largely left to our own intuition as to its value. P123 nonetheless and rightly provides these tools for individual users to do what they believe is best for them. I’m suggesting P123 provide users the ability to do research they believe is best, not necessary only the P123 way. For those here long enough, you'll notice a revolving door as the personalities who claim to know the "right" way to invest.

  5. Don’t let perfect be the enemy of good.

I hope this better explains my thinking behind the post. I appreciate the reply as it helped coalesce my thoughts.

Thank you.

They sure do. Can we get very specific please about these additions?

First, I think you want an addition to our "Annualized Returns by Quantile". Currently we group ranks (or predictions in the case of AI factors) into quantiles (deciles in the image below) then calculate the average future returns, compound them and annualize them.

What you want is another option below that shows you the average annualized alpha for each quantile, yes?

The calculation could be done two ways I think.

One way is to just take the time series of the quantile and calculate the alpha. This is what we do for the output of the DataMiner Rank Performance operation. Also running a screen backtest with Rank>=90 will give you the alpha of the top decile. Using a rule Rank>=80 and Rank <90 will give you the alpha of the next decile. And so on.

Another way would be to calculate the expected return of each stock in the bucket, then the alpha using the future return. Then averaging and annualizing all these alphas. I think this is the method you are asking for. But I think this method basically gives the same results as the one above, so just do the easy one.

For your second addition, correlation matrices, where and what do you need?

Thanks

1 Like

Absolutely, and I deeply appreciate your willingness to consider these suggestions.

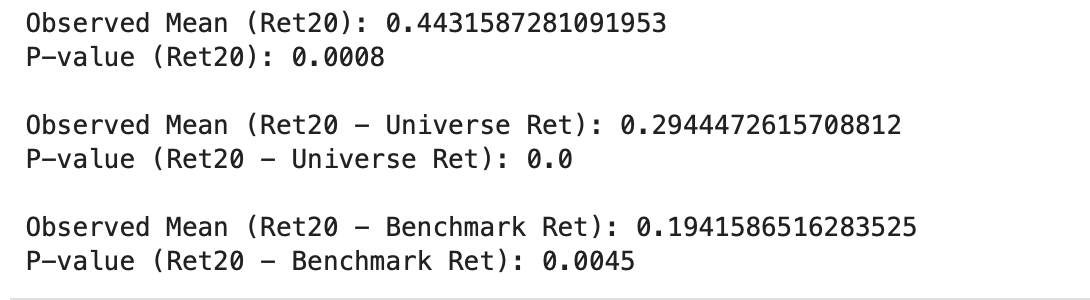
  1. While you do offer excess returns, which is fantastic, the concern lies in its nature as a proxy result. The excess returns you illustrate as StockReturn_A - BenchmarkReturn are indeed how it's currently handled in the ranking system. However, the focus here isn't on excess returns, whether knowingly or unknowingly, because it doesn't account for beta. The beta you provide, which might not be the most accurate in my opinion, is crucial. See these charts.


Notice the distinct differences in each signal. Raw returns depict them as largely irrelevant. Universe returns (which ideally should align with the benchmark since I'm selecting the SP500 and IVV benchmark and universe, respectively) show marked discrepancies.

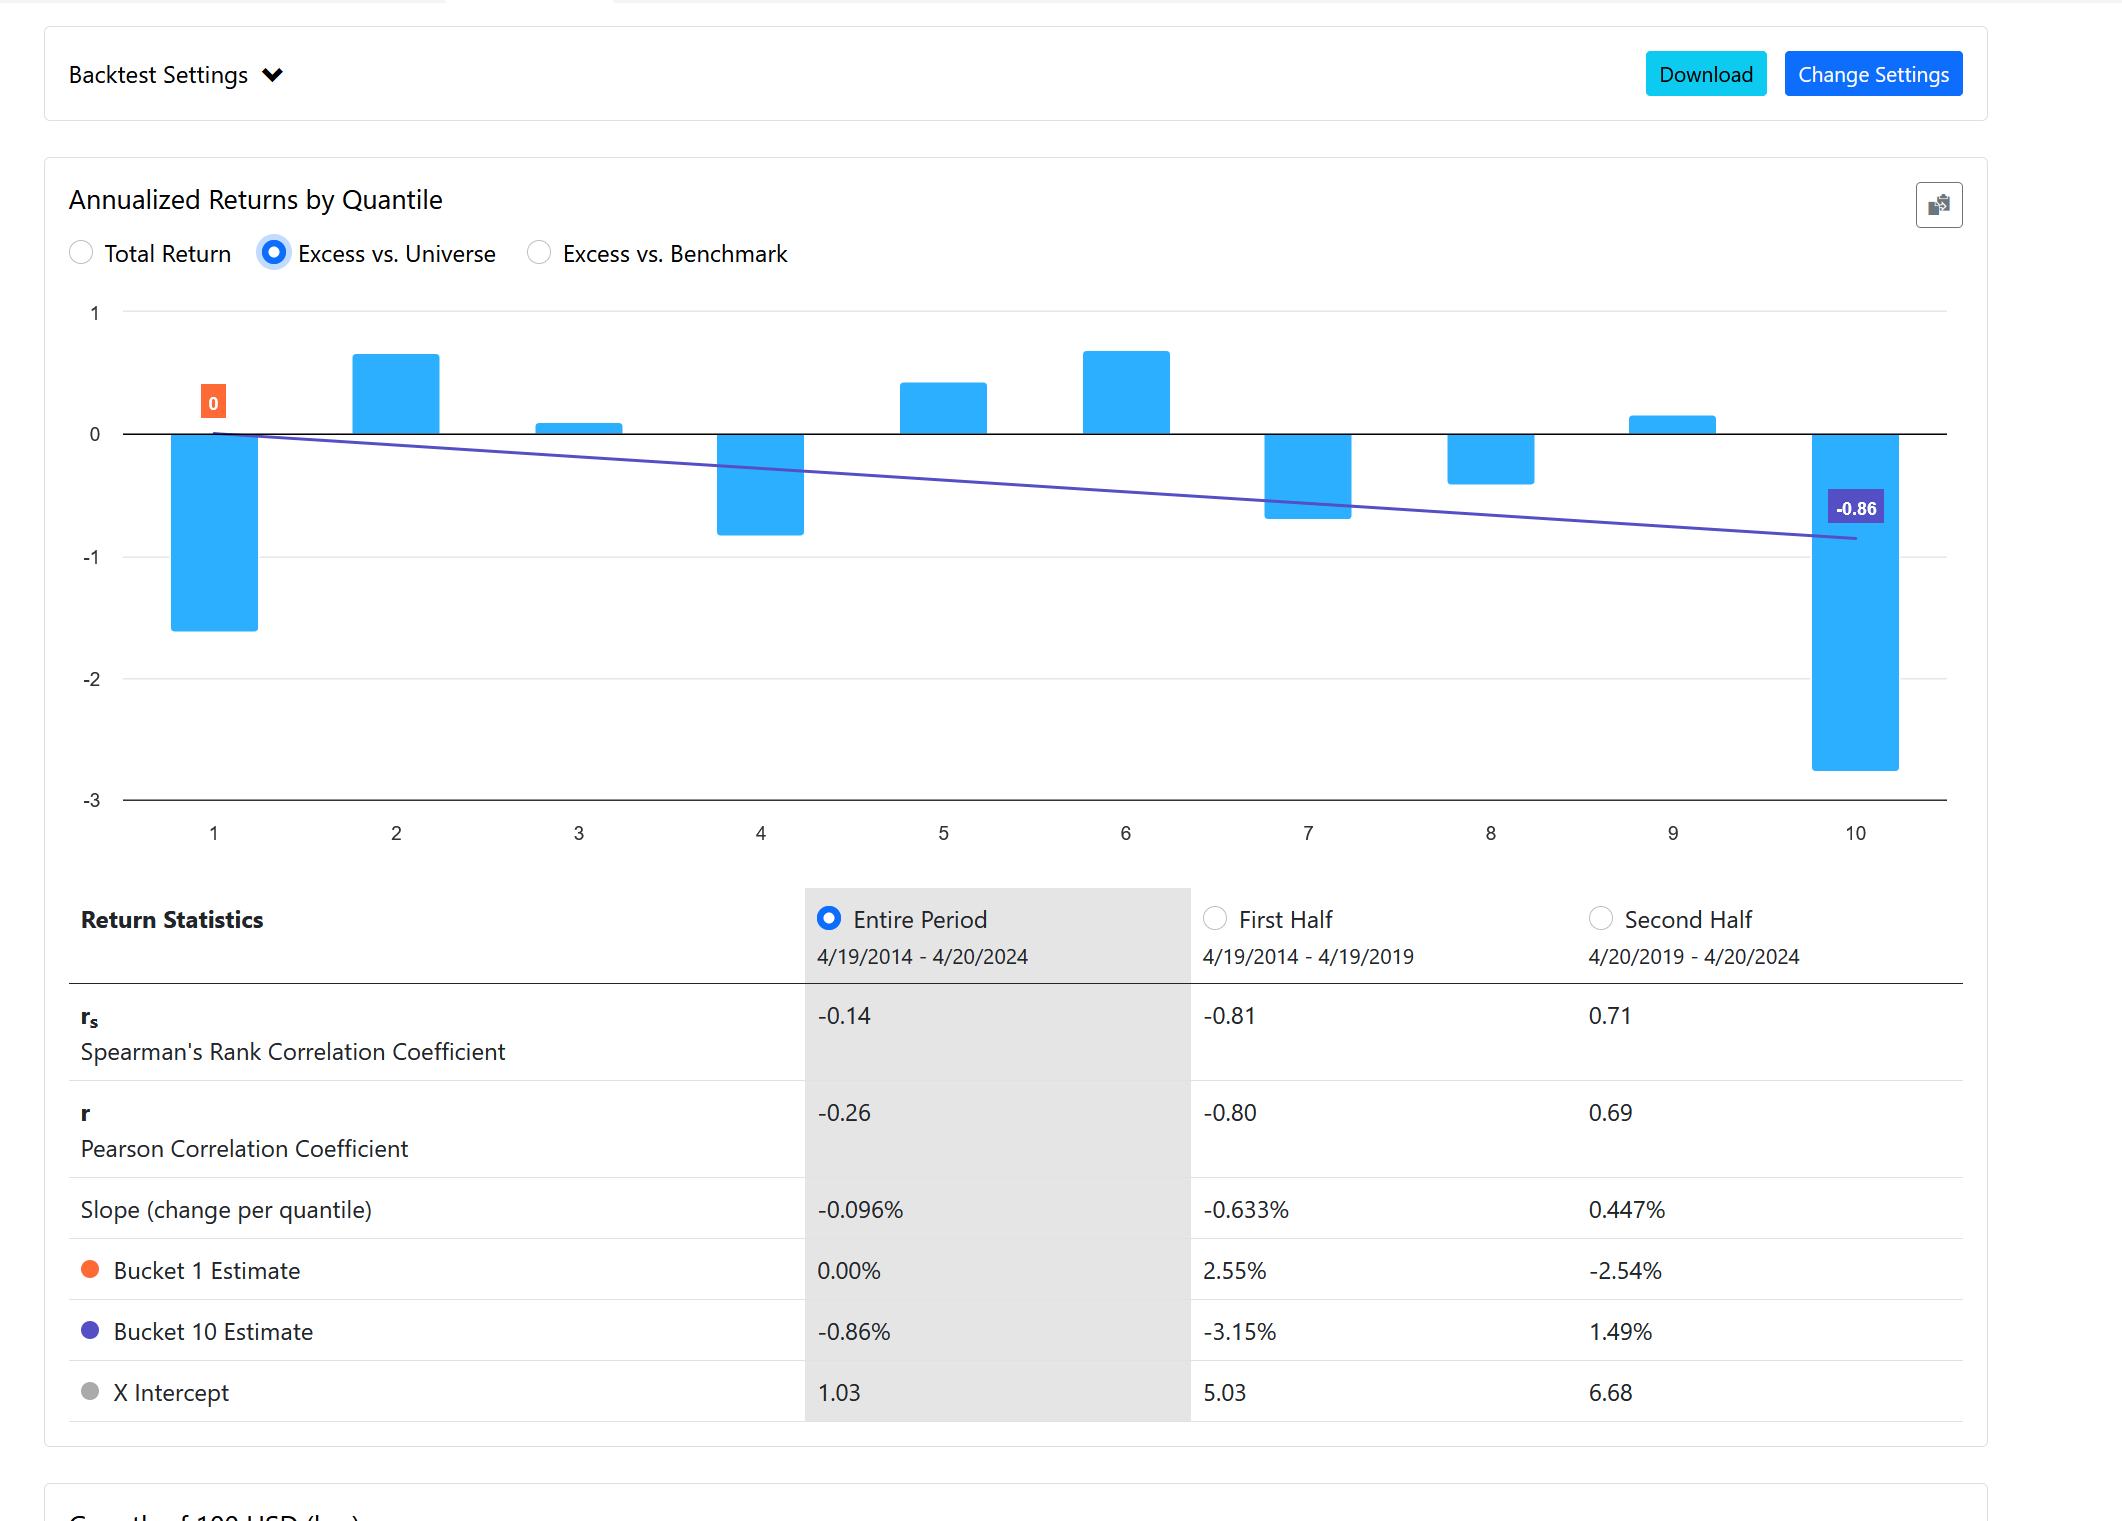
Simply observing a generic beta demonstrates the relevance of this metric and how our ranking tool isn't capturing it. In essence, a stock with a beta of 2 in a bullish market will exhibit excess returns 2x the benchmark, which isn't true alpha. Yet the ranking system will show those as excess returns. We must control for beta.

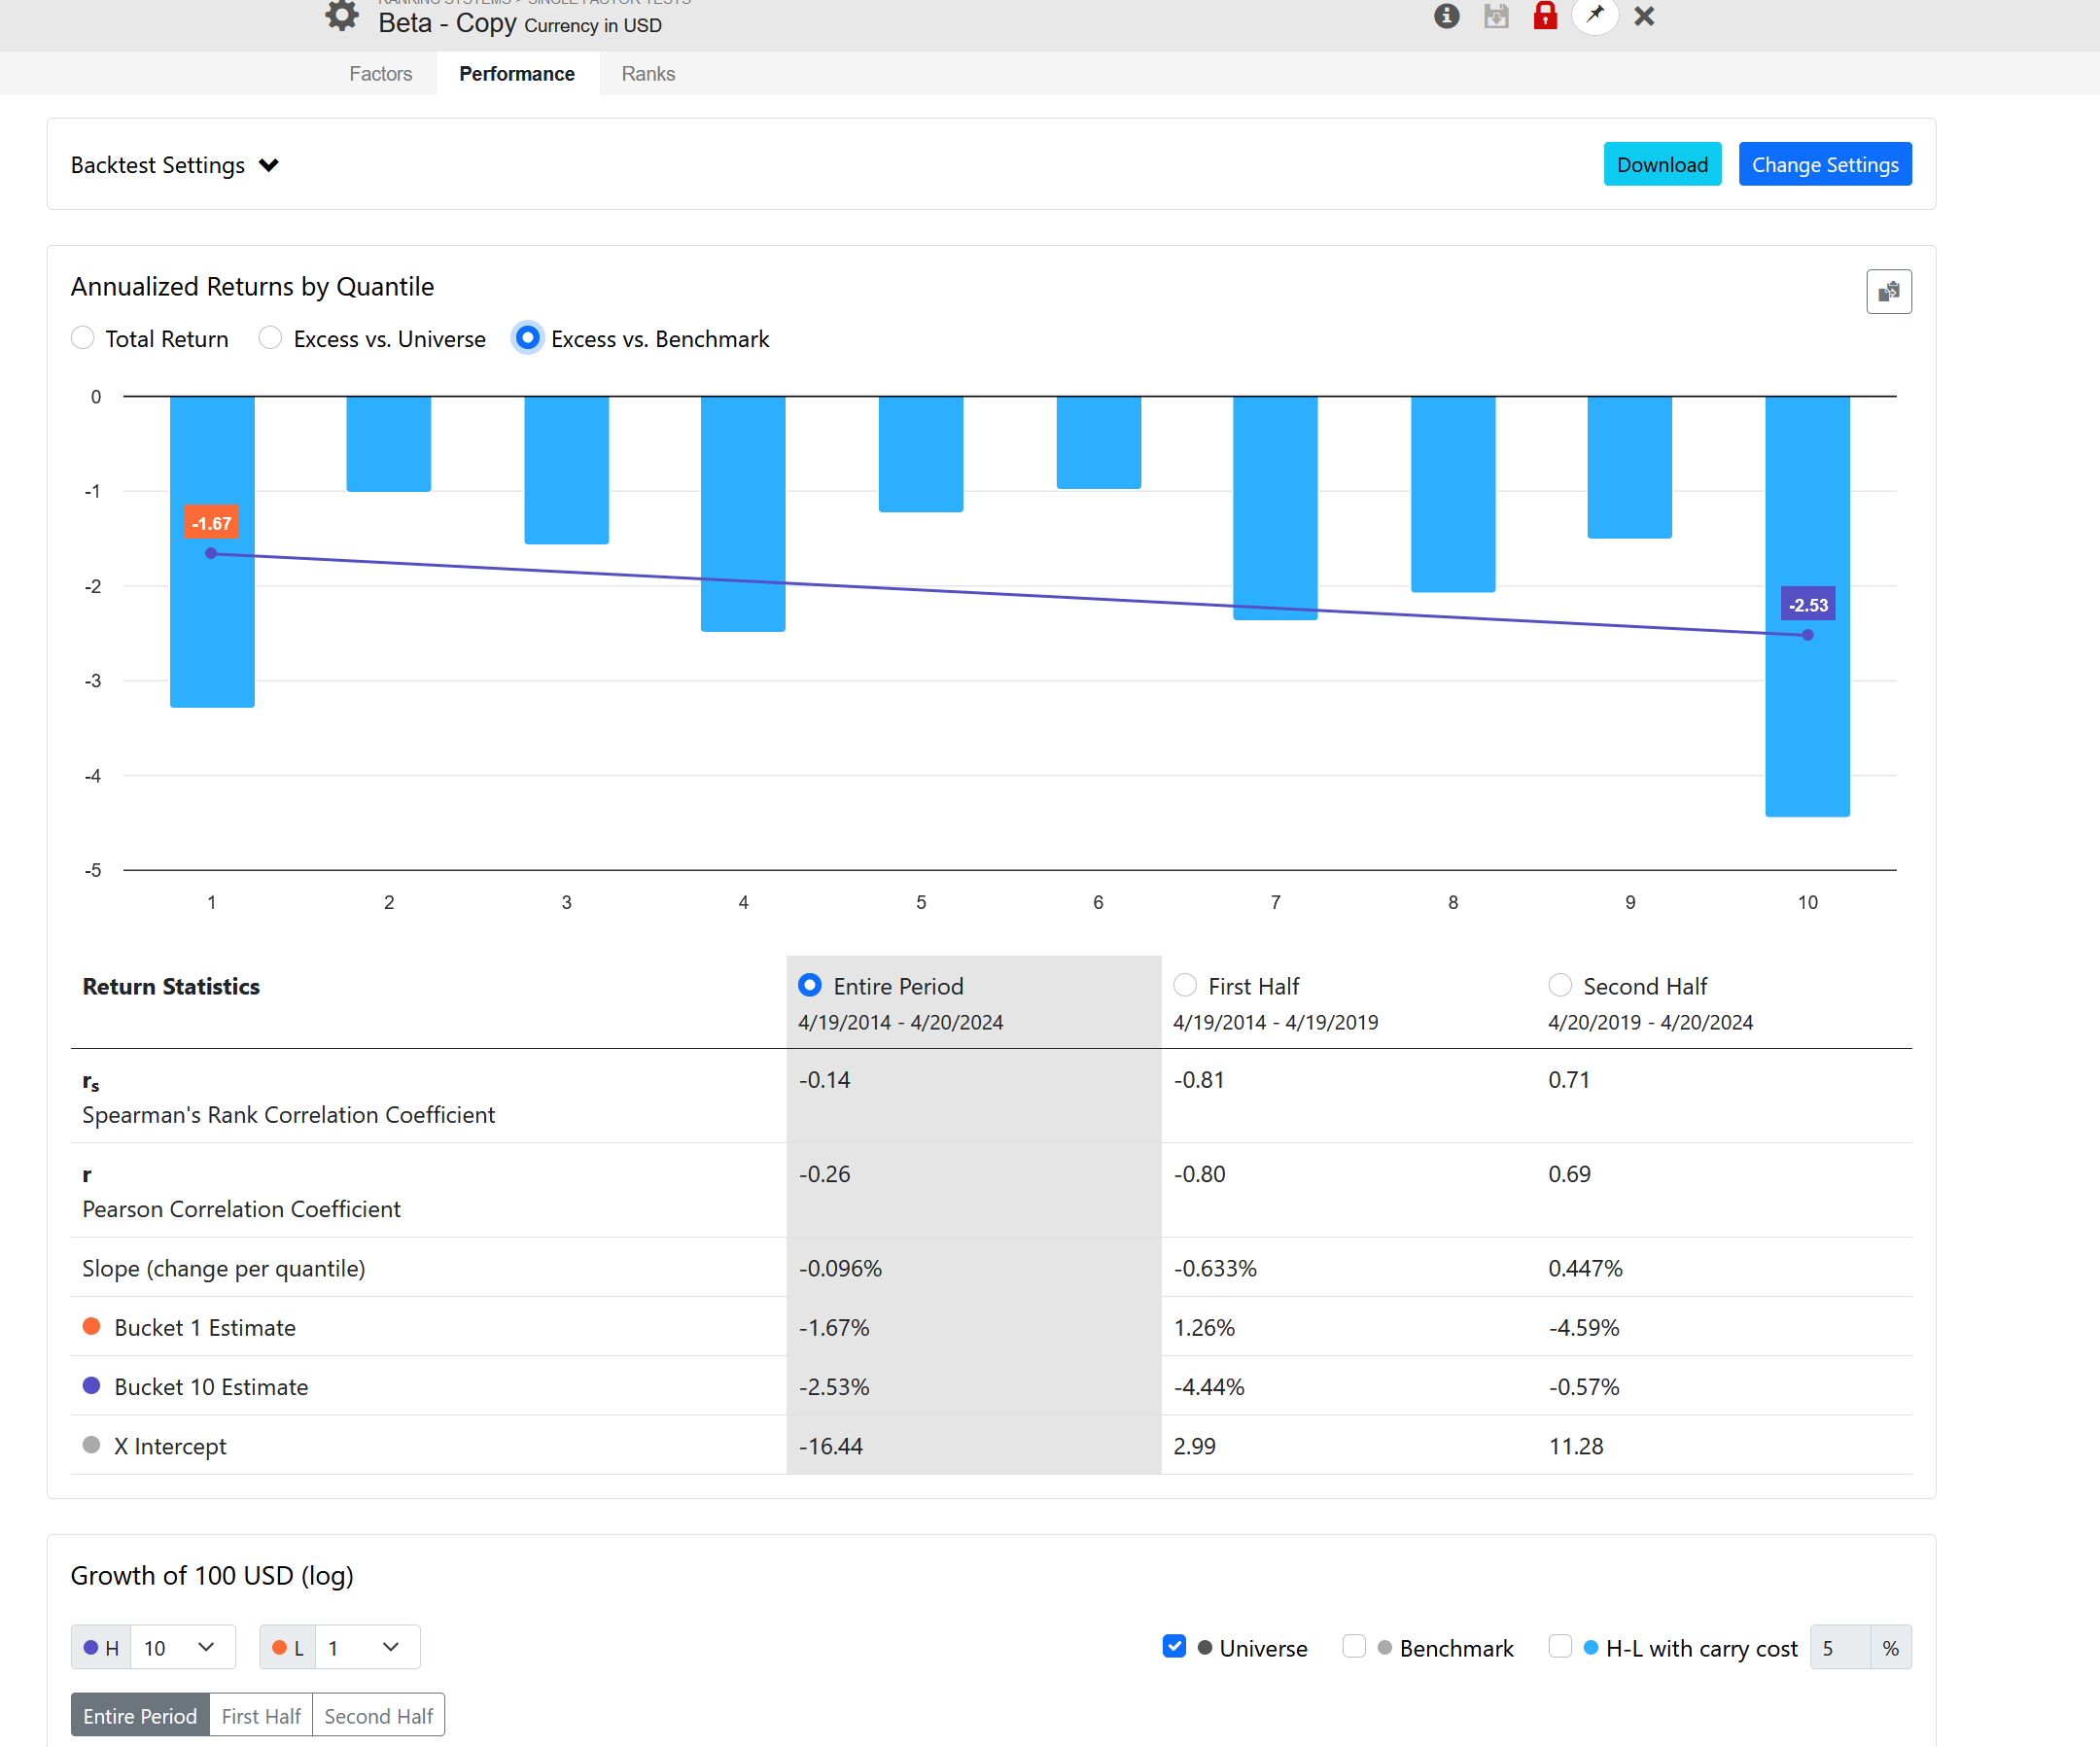
The same applies to a stock's volatility, which excludes its correlation to the index. Look at these results using 12-month historical volatility:

Just looking at a generic beta shows how this one metric is relevant and how we are not capturing it in our ranking tool. In other words, a stock with a beta of 2, in a bull market, will have an excess return of 2x the benchmark. That is not alpha. We need to control for beta

The same holds true for the volatility of a stock, which excludes it's correlation to the index. Look at this results using 12 month historical volatility:


You'll observe a similar impact.

In P123 models, we're unable to see the effects of beta or volatility on our ranking system. They remain hidden in our models, leaving us unaware of how much beta is influencing our systems. While others may develop "robust" or "all-weather" models, it's essentially layman's terms for persistent alpha.

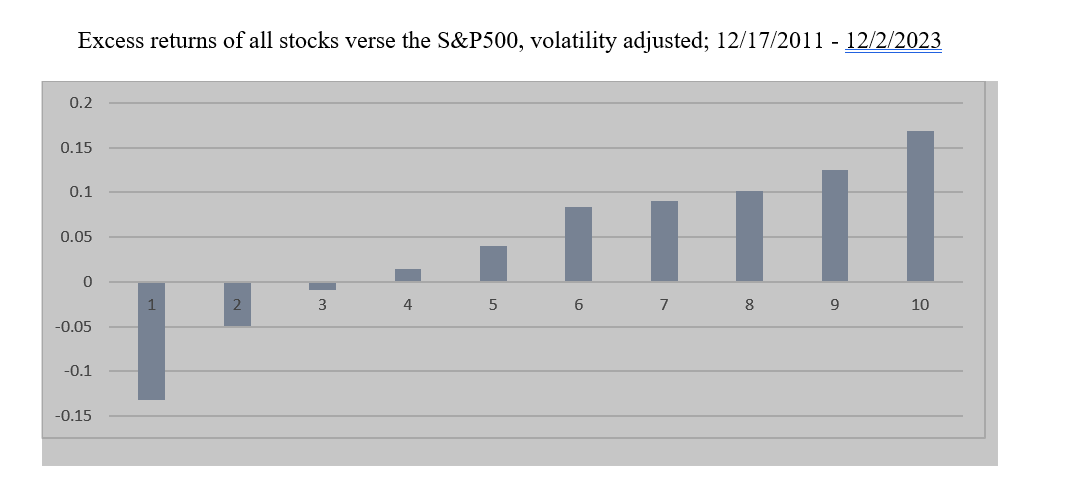
Lastly, here's a ranking system where I normalized volatility for each bucket, ensuring each bucket has the same volatility. See how clear the signal becomes:

We should be able to achieve this programmatically within P123, where the ranking signal for each stock/bucket is made equal for beta, volatility, and one which shows true alpha returns. This creates a much cleaner signal, allowing us to compare it against a benchmark or the universe for outperformance.

Does this explanation make sense?

  1. Correlation matrices are vital for managing risk. You previously shared a Google directory for these projects, to which I dedicated considerable time submitting spreadsheets and seeking feedback, which unfortunately never materialized. We need the backend database to calculate both covariance and correlation matrices for our individual universes or portfolios and then enable us to control things like beta or volatility effectively. These can be used most effectilinb in volality targeting, risk parity, and all the other portfolio managements you decribed years ago.

I hope this helped with the specificity of my remarks. If I was not clear, there are errors in my logic, anything else - please let me know. Thank you!

It sounds like you're computing the Sharpe for each bucket, in excess of the S&P500 in lieu of the risk free rate. Or are you doing something more nuanced than that?

No. Those are annualized return when each bucket is set to have the same volatility as the other.