You can now easily download factors and formulas for your AI/ML projects outside of P123. This was a very cumbersome operation before using the API. It also offers many additional features that could be useful for visualizing the data and formulas.
Here are some of the main features
New Predefined Factors. We created a new list of factors/formulas suitable for AI/ML that are easier to use.
You can create and save your list for re-use. Tags can be used to group your factors
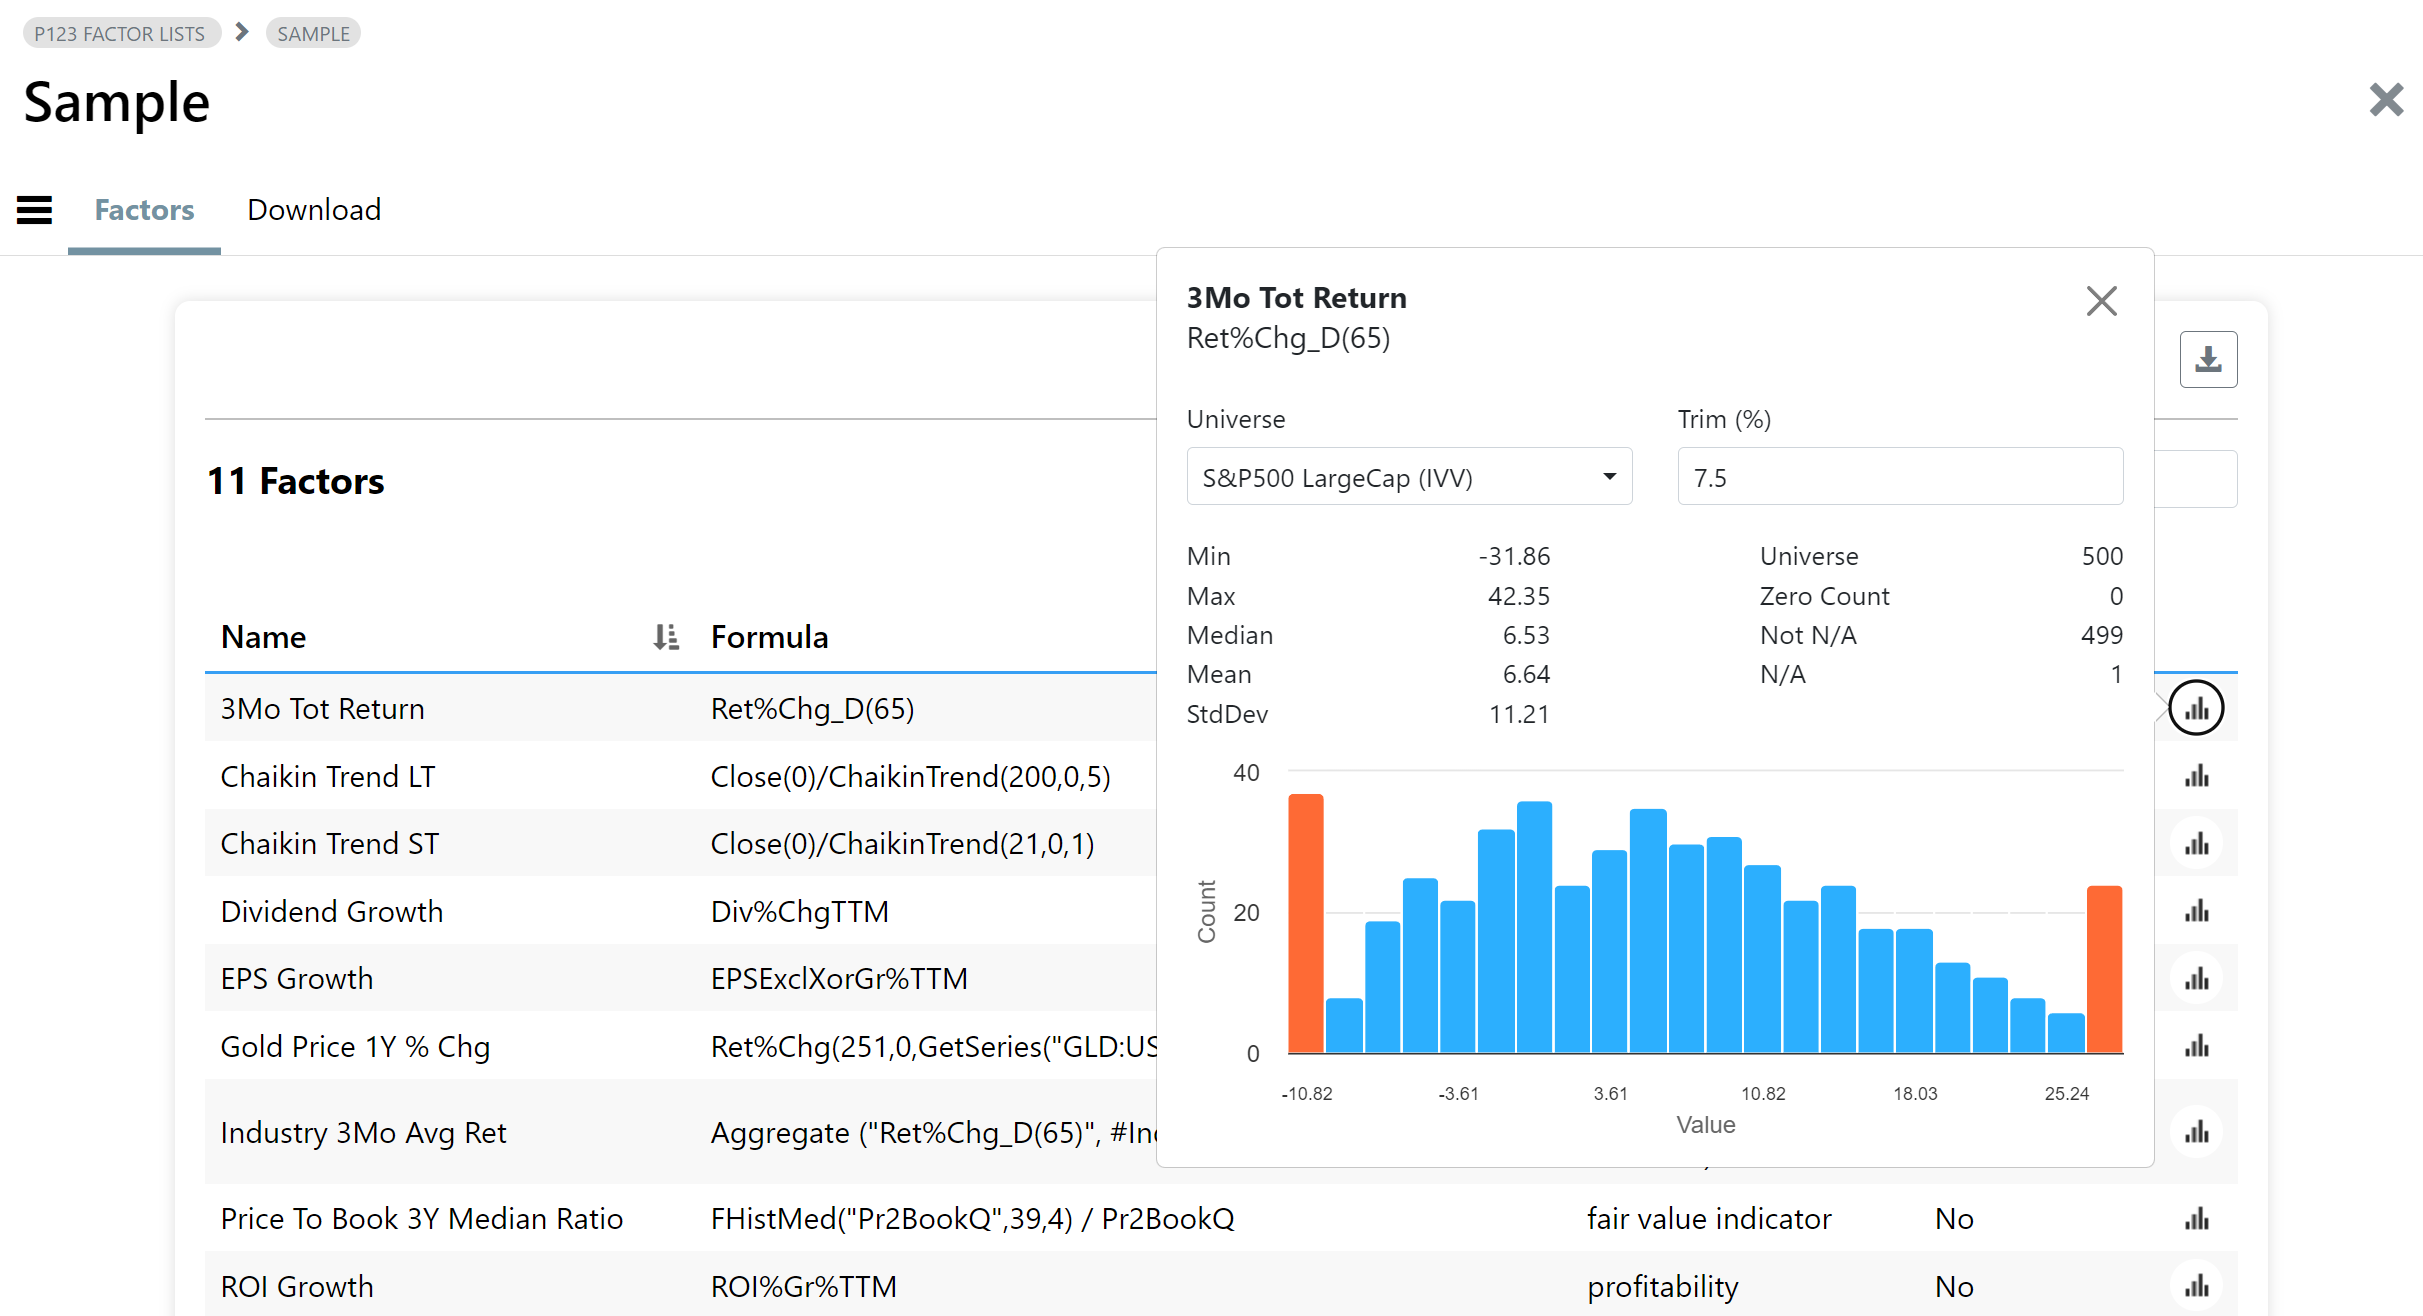
Quickly pullup a histogram of your factor to verify it. Several stats are calculated like min/max, median, stddev.
Three normalization techniques are available: rank, z-score and min/max.
For Min/Max and Z-Score you can also choose to normalize across a set of dates which seems to be more appropriate for ML/AI.
Without a direct license with the vendor you can only download normalized factors. Contact us to discuss. Purely technical factors are ok to download in their raw form. This is useful to, for example, download the future performance to create portfolio backtests using your predictions.
Factor Downloads uses your API credits so we suggest testing with small datasets first. If you use up your monthly allocation you can always purchase API credits here. These add-on credits never expire.
Let us know your feedback. This is a precursor to our fully integrated AI Factors which is in the final testing stages so any feedback re. Feature Engineering and preprocessing is appreciated.
Cheers
You can access Factor List from the Download Factors menu.
One question: Are the returns for the next period downloadable with this? E.g. next week’s returns (Monday close to next Monday’s close) for a weekly rebalance.
I think I might just be missing this. Case use if not: A “target” will be necessary for any supervised machine learning method I can think of (by definition of supervised machine learning). Returns or excess returns relative to the universe are likely to be common targets for machine learners. Probably the most common target.
I tried Future%Chg(5) and it is providing values. However, it's also providing future returns for data that isn't yet available. When future close isn't available, it reports back 0.50 as the period return. I haven't checked whether Friday or Monday closes are used.
I am super excited for this release! Many good things. A few questions/comments below.
How do I find these?
Also I just tried a download and I see it is a csv. Any chance we can get the pandas dataframe as a download format? If you use the pickle saving method it massively speeds up loading into python and I think it compresses the data so the download should be more efficient.
I would have one (first) suggestion in terms of the target variable (a future return).
I would be happy to see a factor that calculates future return based on the frequency I selected.
For example, if I select 4 week frequency, my first date is 27/01/2018, the next date is 24/02/2018, then the the future return should calculate total return between 27/01/2018 and 23/02/2018.
This would allow to replicate/validate the final model results in p123 screener/backtester.
I know have, Future%Chg_W(4) but I’m not sure if this factor would return the same return.
I would not use the _W future functions for short periods. Please see the description for either Future%Chg_W or FutureRel%Chg_W. They start on Friday of the following, so it skips the performance from Mon-Thu. Guess it's ok if you do a 52 W future performance, but for short periods they are so bad that they will be deprecated from the reference.
Please use Future%Chg_D(20) which does exactly what you want.
We'll be adding some pre-defined ones too to match up with the download frequency.
These are a mix of pre-built factors (the most common ones) and formulas in an easier to use format. More will be added. We will also use them in other parts of the site, like Fundamental Chart and Ranking System nodes.
Thank you for explanation. I checked and it works.
I was wondering if it would be possible to add a new parameter to Future%Chg_D factor, called e.g., ‘price type’ to be able select Open, Close or Average of Next High, Low, and 2X Close.
If anyone wants to perform normalization using a method not currently covered in Factor List, use Scaling Z-Score, N/A Handling None, Trim % 0, and Outliers Retain. This will yield the the original distribution scaled to standard normal allowing one to do any sort of transformation.
The mean and standard deviation can also be preserved in subsequent downloads by using a fixed ML Training End date. (While this is generally true, any change in the universe or data would affect the result.) This unfortunately has a growing API cost since one must download the same data multiple times, but it’s the solution we currently have.
I was thinking about this and instead of downloading the entire dataset again all you need is one week of overlap. I think this is true as the zscores are a linear transformation of the original data and therefore the different zscores are just a linear transformation of each other.
Using chatgpt I have a method for two datasets where there is one week of overlap with all the same stocks. I feel like there should be a way that only requires two or so identical stock ids, but I have not figured it out yet. I did use chatgpt to check the method, so take with a grain of salt!
For two sets: set1 and set2 with one week of complete overlap
Determine the Scale and Shift Factors:
Scale (a): The ratio of the standard deviations of set1 and set2 for the overlap week.
Shift (b): The difference in means of set1 and set2 for the overlap week.
Calculate the new zscores using this equation:
z_set2, transformed = a * z_set2 + b
“By applying this transformation, the z-score from set2 is adjusted to be on the same scale as set1, making it comparable across the two datasets for the overlapping period. This is particularly useful when you want to compare or combine z-scores from different sources that were standardized differently.”
I think you could get away with that using just one independent variable.
I do not think would work fur a multivariate regression with multiple independent factors.
If you think about it for one week the value factors might have done great while growth factors underperformed significantly. You would suddenly be putting huge amount of weight on the growth factors in your regression (because you would be subtracting an excessively large mean for the week from the value factor).
Different, for sure, than if you have used the mean and standard deviation over the entire training set.
Also, if you use 20+ years of data, because you train on 20+ years of data, weekly rebalances are cost prohibitive.
I think Aschiff and Marco got it right. I am glad they understand this and are working on a solution (or something that uses fewer API credits).
There is a good chance I missed what you mean (I am tired today), but here is what I was thinking:
Download your dataset from say 2010-01-01 to 2023-12-03 using zscores scaled for the entire time period. Scaled for the entire period is very important so that each week uses the same mean and std.
Then when you want to download the next dataset you would use from 2023-11-26 until now once again scaling for the entire dataset.
Then for each factor you would re-scale the second dataset using the overlapping week to get the scale and offset values. You would need to do so for each factor independently. Not all together.
Let me know if I am missing something in my logic, I have not well tested it to make sure it works.
I just think that won’t work. Try approaching this in multiple ways with ChatGPT. Making sure to let it know you are talking about multivariate regressions.
AND stock data that is not stationary where the means can be different for long periods of time. A sample of the means will not be enough.
I have the flu or maybe a mild Covid myself I suspect ChatGPT might be more clear than I would be. Plus I don’t want to monopolize the discussion. Especially since Marco a P123 are already working on it.
I think ChatGPT will be clear. I’ll do the same to make sure I am not missing anything.