We just released the following Stock Based Compensation (SBC) functions, and all related predefined factors. Search for "Stock Option Compensation" in the reference:
StkOptExp - SBC from the Income statement
StkOptCF - SBC from the cashflow statement
We chose to name it using the shortened option reference which is what FactSet used.The numbers from cash flow will be bigger than the ones for the most past, but there are exceptions. A full description is in the works.
Coverage
This is the main problem with this data point:
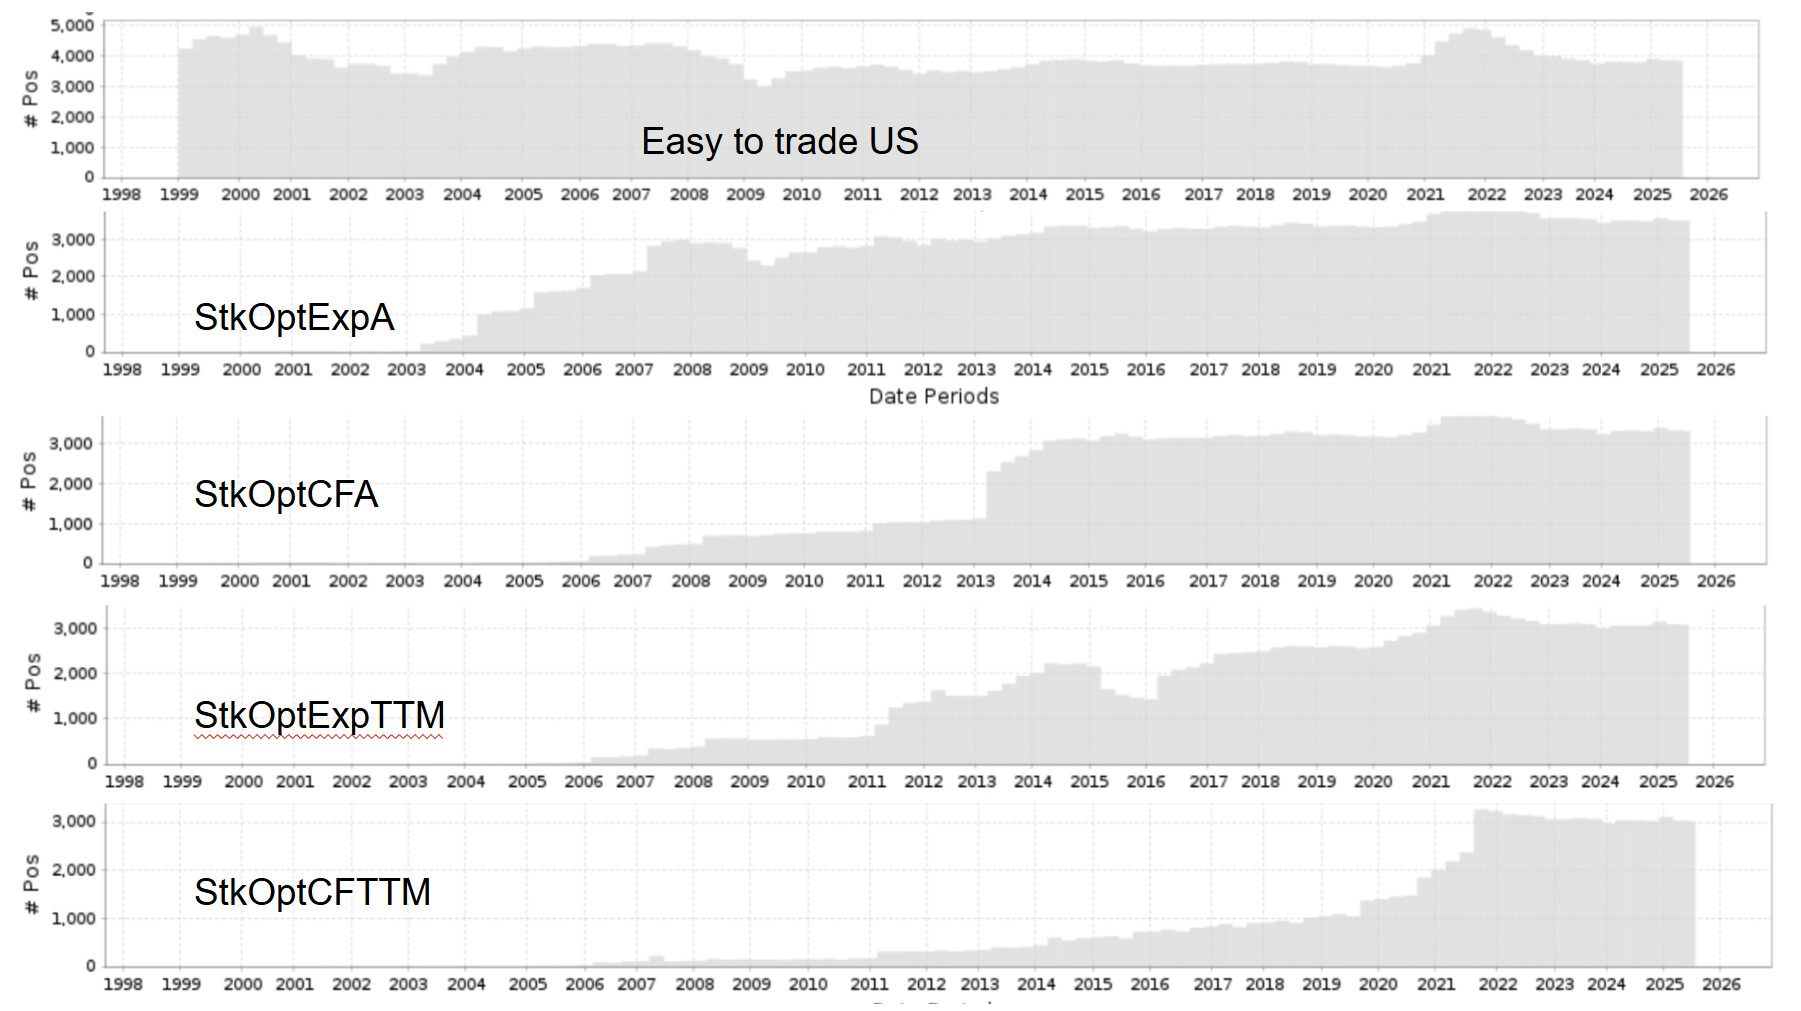
StkOptExp: Data begins around 2003, with full annual coverage starting in 2008, and interim in 2017 StkOptCF : Data begins around 2006, with full annual coverage starting in 2013, and interim in 2021
Below are charts to visualize the coverage in the USA for the Easy to Trade Universe for the annual and TTM values. The Y-axis is the number of stocks which for the universe hovers around 4,000. Let us know what you think and if you find it useful
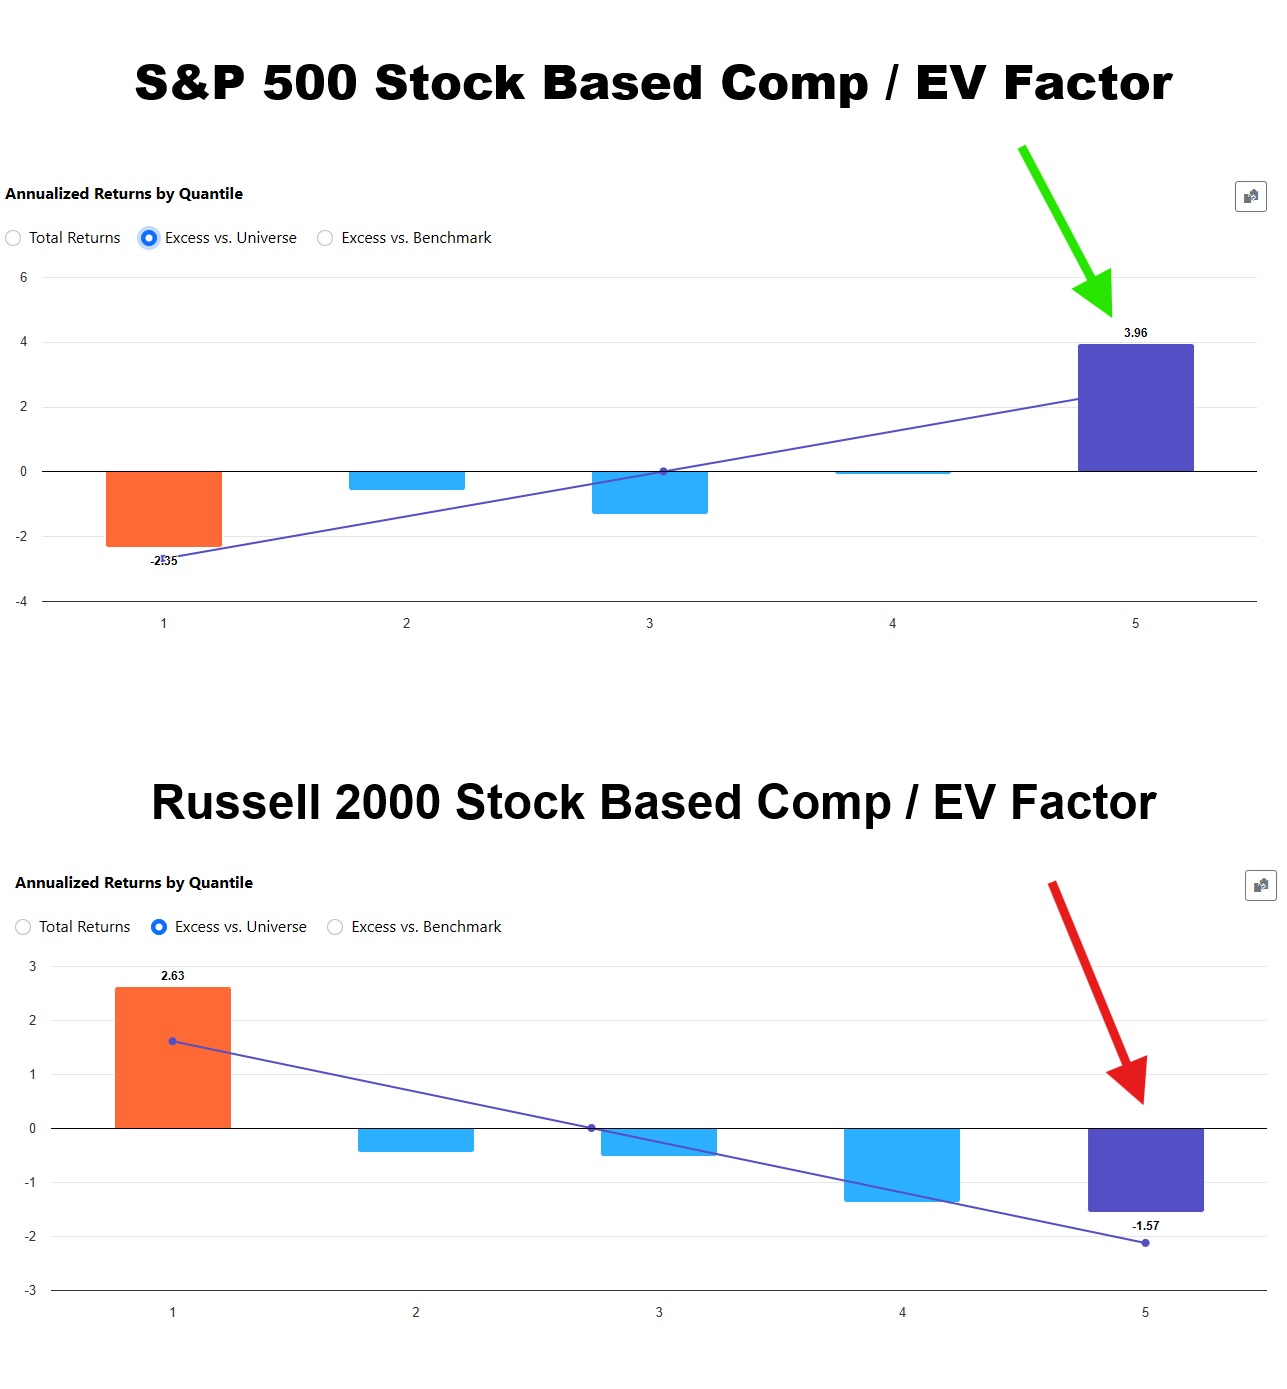
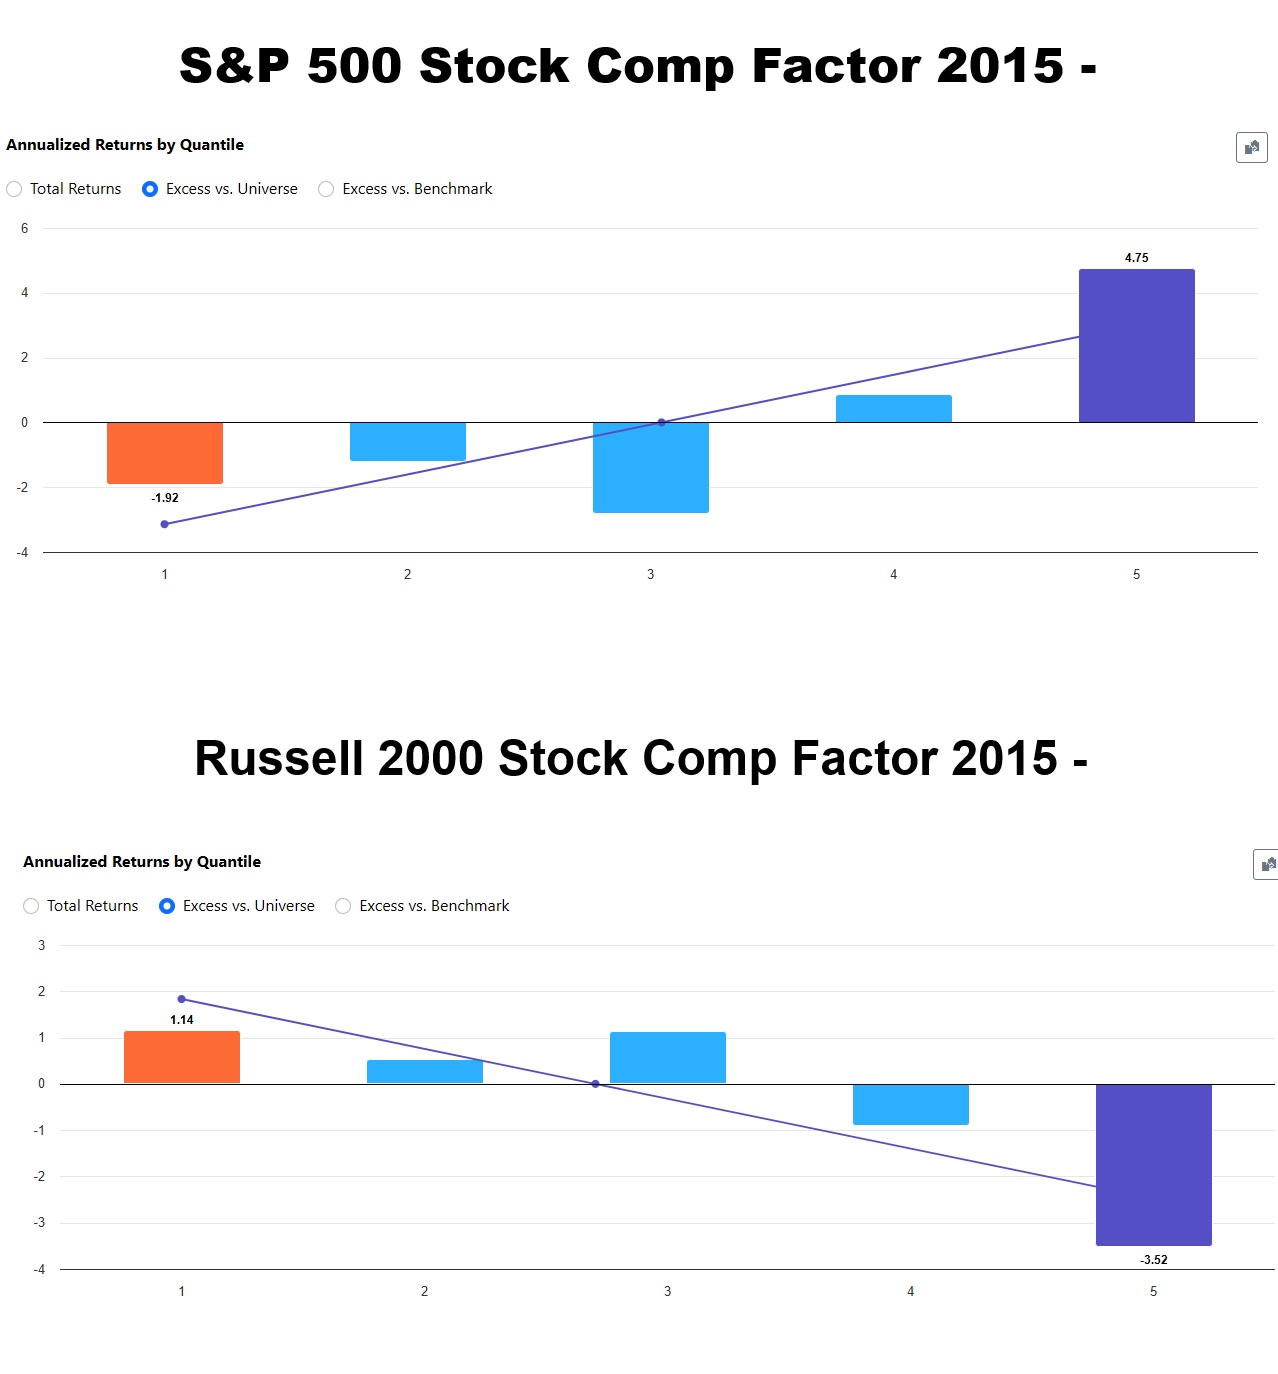
Interesting. I ran stock comp TTM / EV and the results are different with small and big stocks. S&P 500 has better returns with more stock comp/ev. In R2K stocks it is the opposite. I wrote a quick post on this on LinkedIn.
Wanted to mention that there is actually something off in my reasoning here, even though it backtests well. I'm sure the attentive reader will figure it out.
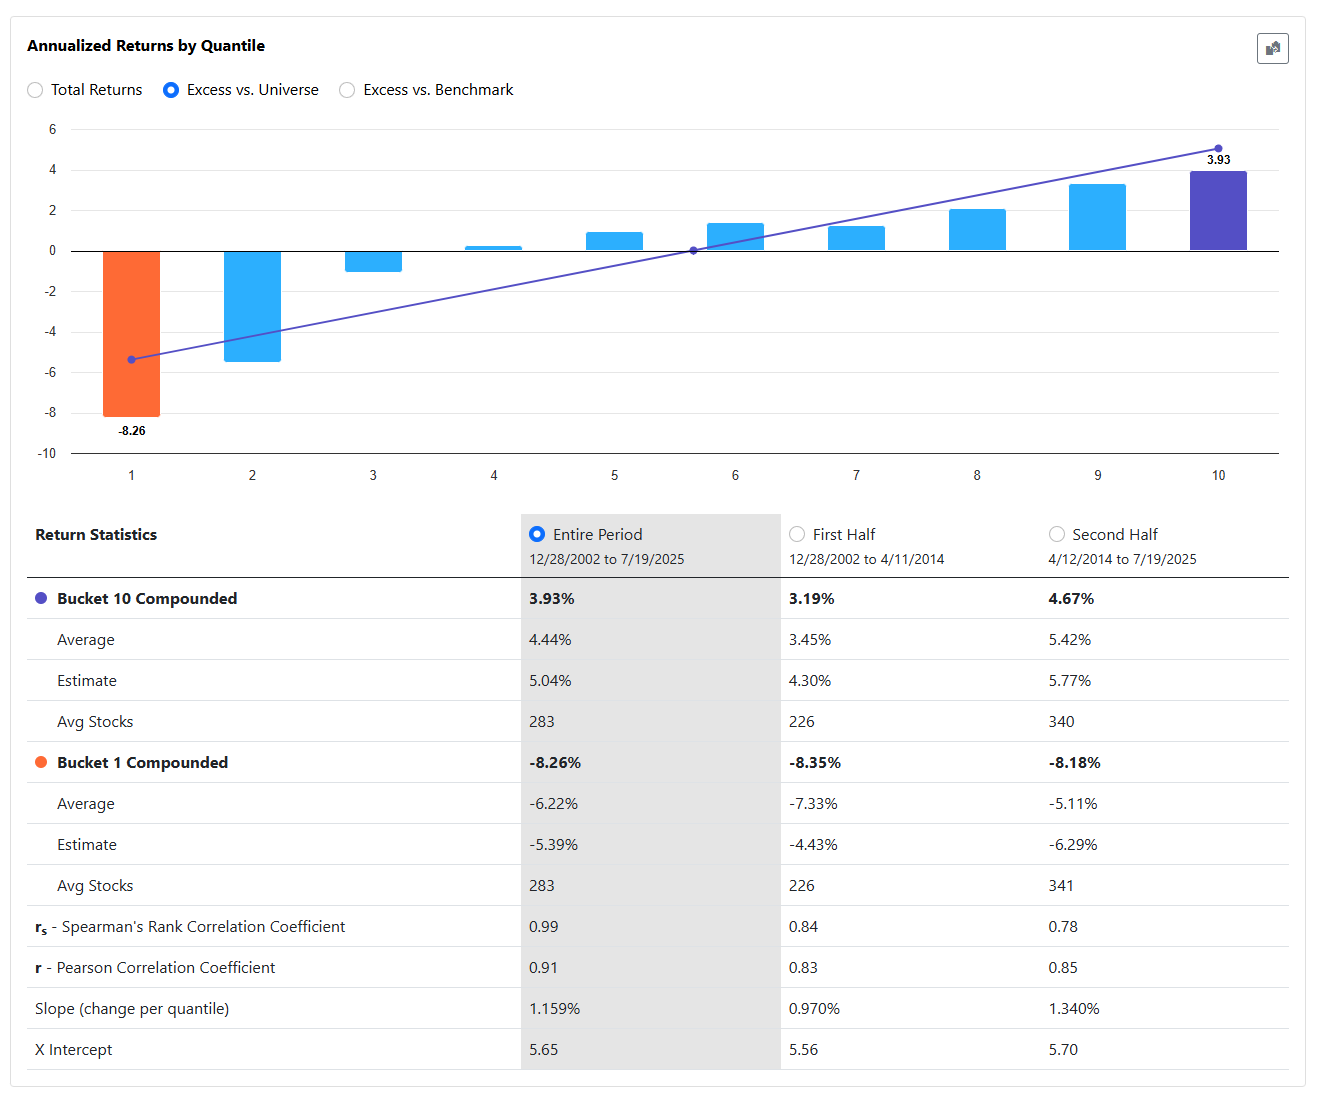
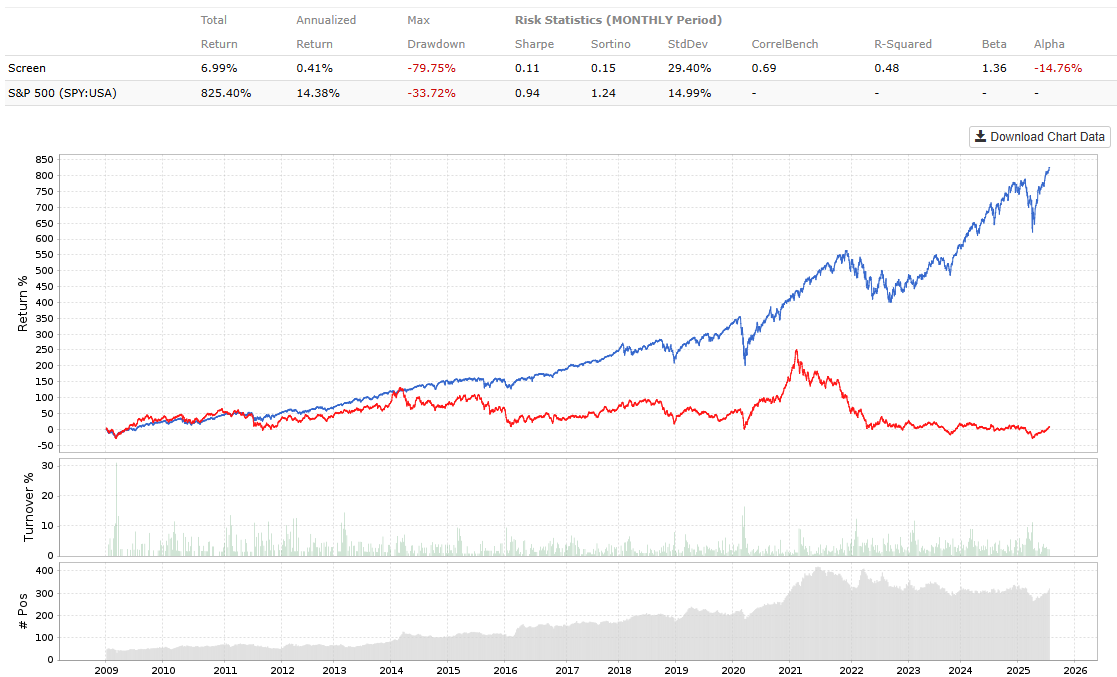
I ran a simple test to filter out companies with unusually high stock-based compensation using the rule: StkOptExpA / SalesA > 0.15
This screens for firms where stock option expense exceeds 15% of annual sales, a level that, in most industries, implies aggressive insider enrichment relative to value creation.
This could be a solid negative filter. These are companies where shareholder dilution far outpaces top-line performance. Filtering them out may significantly boost quality across your universe.
We only have a handful of clients on Compustat (they require a separate license) so it's hard to allocate resources. Are you ok sponsoring the project? Should be about 8 man hours.