Sorry, I do not understand the hedging method (rules) here, since it do not appears in the screen.
Could you explain it?
Thanks.
Sorry, I do not understand the hedging method (rules) here, since it do not appears in the screen.
Could you explain it?
Thanks.
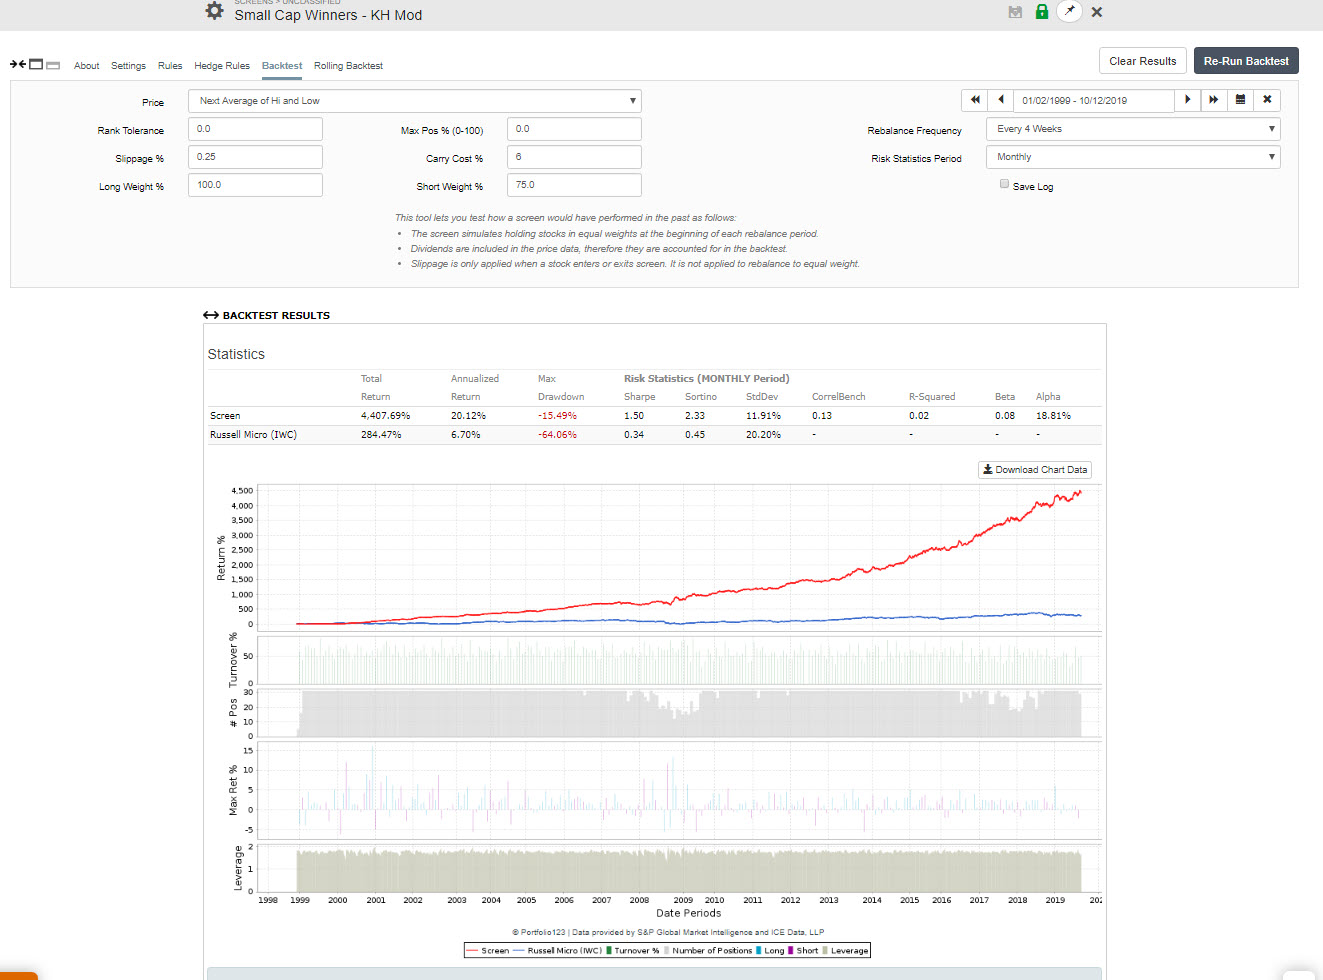
I use IWC as it’s the closest thing to a microcap ETF. It takes it the good and the bad. So if you long good microcaps and short a broad group of microcaps (this ETF), you get the alpha. Every 4 weeks you calculate your liquidation value. This shows up in your TRADE account under account and positions. Just short 75 percent of that value. It requires leverage. The cash from the short sale will be placed in your account. If you can’t do it in a retirement account, just hold the ETF short in a separate account. Calculate the liquidation value by hand. Just make sure your long side is equal to liquidation value.
The hedge is IWC ETF and it is always on.
Very cool Kurtis. Learned something new today.
Can this be done in a sim/port? so it automatically spits out a trade? It is a lot of trades ![]()
Thank you Kurtis, Yuval and the P123 team
To build on this and contribute as well…
I have not yet tried to turn it into a simulation but quickly looked at first steps in this direction starting from Kurtis’ version:
→ I suggest using the “core combination” ranking system with 30 stocks. Considering the micro-cap nature of the screen the more stocks the better (with some limits) to diversify away some of the risk of a blow-up.
→ There is a fairly high turnover (and since micro-caps → add implementation risk in getting the fills as expected) → rebalance every 2 weeks works well enough (as opposed to every week)
At this point and before spending more time on this, I am possibly concerned by curve fitting at inception (have seen too many R2G micro-caps blow up). Of course, we can wait for another 3 years and see what happened but…
Questions:
@Yuval → how much of the screen was built theoretically first (valuation logic in your head) vs testing all sorts of factors to see what worked in the past? And when implementing the screen with factors did you use the whole timeset 1999-2019 or first a subset of that then do a roll-forward to a new previously unseen period?
@Kurtis: same question
Thank you guys
Jerome
I wouldn’t be surprised if a strategy sim based on this screen performs poorly. The slippage schedule for sims is much more aggressive and, in my experience, kills many micro-cap screens.
Kurtis,
Problem is that your screen’s slippage of 0.25% is too low for small- and micro-cap stocks. Slippage should be more like 0.5%. Also a 0% carry cost of short position is unrealistic. With 5% carry cost and 0.5% slippage annualized return is about half of what is shown, but still has positive alpha.
Geov,
Slippage is different for everyone. It depends on how aggressive you are and the capital you are trading.
I set the min liquidity at $200K per stock and $2 per share. My experience is that I can trade over 5% of the daily volume (up to 10% in some instances) using the IB VWAP best efforts algo (non-aggressive) and we get 0.25% above the daily mid-point (not the open). There are 50-70 stocks.
You really should have no issue trading $1mm portfolio in this one idea alone. And because it rebalances every 4 weeks, why not take a few days to get in and out of positions. You can either lower your slippage even further on the $1mm portfolio or triple your portfolio size if that’s what you are after.
5% carry cost to short a popular ETF seems rather high to me. I don’t short it (my system shorts individual stocks of high liquidity) so I can’t say what the number is but that does seem a lot high.
As for trading systems and when they were developed, I have systems like this which trade 250 stocks. Many of my systems were developed years ago. They performed very well out of sample. To date, only one family office I consult with is interested in microcap and smallcap systems and that is without the hedging component. To me, this seems like an excellent way to lower volatility while harvesting the size premium. I even offered to run the portfolio for the firms through the P123 Trade interface. It is funny but there is just little interest in this sort of product for some reason. I have no idea why.
Kurtis,
It is not a bad strategy. One can add market timing to the buy rules which require rank to be higher during down-market periods. This result in the model reducing number of positions during down-markets.
Here are my rating rules:
Rating (“Core: low volatility”) > 25 (This is an excellent addition to the rules.)
Eval($comp<50,Rating (“Core: Sentiment”) > 75 ,Rating (“Core: Sentiment”) > 35)
Eval($comp<50,Rating (“Core: Quality”) > 65 ,Rating (“Core: Quality”) > 50)
$comp is the market timing formula based on the Composite Market Timer. An entry signal for the stock market arises when the combined weight of the six component models is equal to, or greater than 50. But any good timer will do.
https://imarketsignals.com/2016/composite-market-timing-increases-returns-and-reduces-drawdown/
I do not have an opinion on the correct number.
But SUPirate1081 uses IB VWAP orders and told me I worry too much about slippage (a while ago in a post). He thought he could get as low a 6 basis points of slippage on whatever universe he uses.
Again, without really knowing about anyone else’s slippage, SUPirate1081 was right. Slippage does not have to be a big problem by my accounting. I do use a more liquid universe, however, so as Kurtis says: slippage is different for everyone. I am not implying that VWAP is important: I use VWAP less than half the time.
But SUPirate has a point.
-Jim
This particular screen (small-cap winners) is loosely based on the ranking systems that I’ve been using in my own trading for years. The biggest factors in my own ranking systems are share turnover, price-to-sales, forward earnings yield, sales acceleration, accruals, sentiment factors, and operating income growth, which, except for accruals, make up the prime selection factors of this screen. To come up with the ranking systems I use I did test all sorts of factors to see what worked in the past. But this screen itself was not backtested much, nor was it optimized. Also, I now rarely pay much attention to the 1999-2007 period when backtesting. Though perhaps I’ll regret that . . .
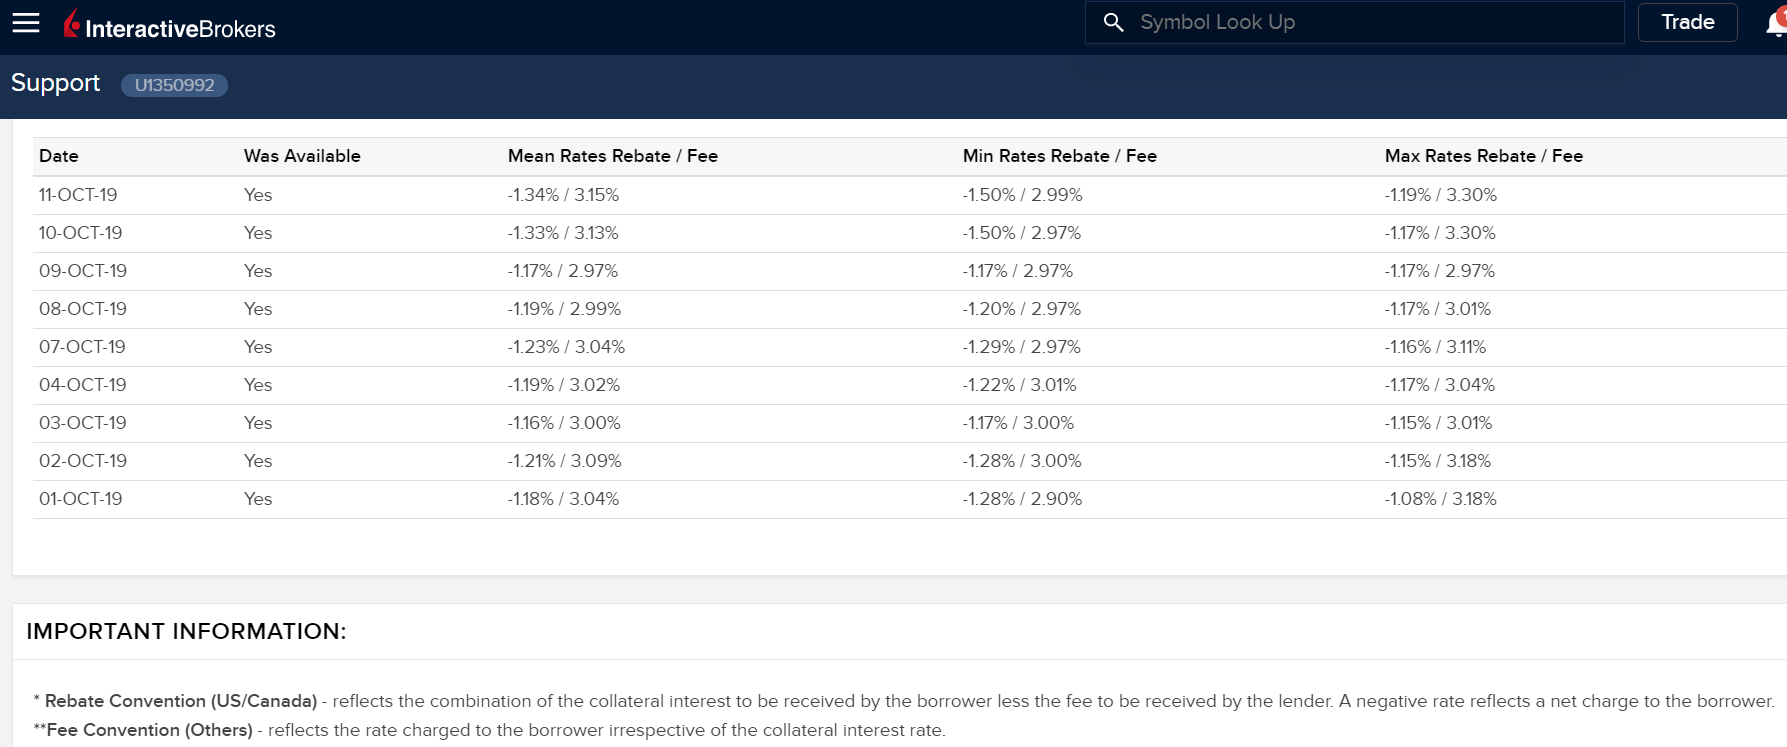
Interactive Brokers fee and rebate rate for borrowing IWC is currently about 4.5% as per attached screenshot. So 5% is not too high.
Thank you Yuval
Another way to improve that screen might be to impose it to pick only from defensive sectors in the summer.
Just a thought to contribute - I have not tested it here but it worked well for me in other systems.
(based on the seasonality observation articulated many times by Georg in this forum)
J
Wouldn’t the correct number be the rebate amount? That’s the fee to the guy who owns the stock minus some interest paid on the cash in your account. So 1.34% cost to borrow assuming you are using cash. Add in margin fees if you are borrowing the cash from your broker.
Kurtis you are correct. But since you have to borrow the collateral cash for the short position from your broker you have to add margin fees.
When you short a security it must first be borrowed. In order for the lender of the security to ensure that she is paid back she will insist on receiving collateral to secure the loan.
The security lender will then pay the borrower some portion of the interest that she earns from the collateral. This interest payment is known as the short rebate. For IWC this is currently -1.34%, meaning the borrower will be charged this interest rate - not receive it. The rebate rate is negative because it is calculated as the Fee Rate (3.15%) minus partial interest earned on the collateral (1.81%) = -1.34%.
From IBKR website:
The Fee Rate represents the rate (generally expressed as an interest rate) that the lender assesses to the borrower of the shares. The lender will then reinvest the cash collateral posted by the borrower to secure return of the shares and may offer a partial rebate of those earnings back to borrower’s broker (generally equal to the Fed Funds Rate in the case of USD stock loans). Many brokers do not pass any part of this rebate to retail accounts although IBKR does and the Rebate Rate reflects the net of the Fee Rate and any rebate offered.
For example, assume stock ABC is hard-to-borrow and carries a Fee Rate of 20%. If the Fed Funds Rate and rebate provided is 2% then the Rebate rate is -18% (note that a negative Rebate Rate reflects a net charge to the borrower).
If your collateral is not cash then you have to borrow the money from your broker. You need a margin account for this. For IBKR LITE it will cost you 4.32% on a debit balance of $100,000. So if you have not sufficient cash in your account and use the long positions as collateral for your loan then you need to borrow the cash for the short trades from your broker.
To this must be added payment to the lender of any dividends received from the borrowed security. In screens prices are with dividends and not accounted for separately as in strategy simulations. The current yield of IWC is 1.16%.
The total current carry cost for IWC would therefore be:
For screens: 1.34% + 4.32% + 1.16% = 6.82%
For sims: 1.34% + 4.32% = 5.66%
So if one uses this carry cost in your screen the annualized return is about half of what is shown with zero carry costs.
Note: It would be better to use IWM as a hedge. The current Rebate Rate for IWM at IBKR is +1.41%, so the carry cost becomes less: -1.41% + 4.32% +1.16% = 4.07% for screens, or 2.91% for sims.
I’ve increased the carry cost to 6% and kept it with IWC. The other change is that I am keeping the top 30 according to the Zweig ranking system with a minimum rank cut-off of 70.
Of course, converting this to a sim allows you to be much more dynamic and timely with the selling while lowering turnover. i.e. you can rebalance weekly but have lower annual turnover with higher returns. But again, this is just idea generation - not a model that I am recommending anyone copy line for line.
So what is the annualized return for this screen?
Looks good.