New ratios preview (ROIC, WACC, and more)

Dear All,

Following up on this thread New line items for International Sales, Capital Lease Obligations and Impairments here's a preview of some of the ratios we're testing right now. We should have them deployed next week with all the variations (growth rates, annual, ttm, etc). They can all be built right now but some require long formulas and quickly becomes burdensome and error prone when you try to use them.

Some of the implementation are simplification of what you typically find in literature because, for ranking, it's better to simplify, or it doesn't matter. For example NOPAT has many different versions. Here's one of them:

NOPAT = EBIT × (1−T)

For T you can use the company tax rate, the sector average, the country average, or simply nothing. We are planning to just use EBIT which, according to our research, is more stable and has better IC.

I created a public screen where you can see the formulas for the new ratios using annual data. Please let us know your thought as we are still trying to decide the final algorithms. Specially with WACC, the most difficult by far.

Here is a short description of each and the implementations (using annuals) we chose:

Operating Cash Flow Coverage Ratio

OperCashFlA / (IntExpA + PfdDivA / (1 - TxRate%A / 100))

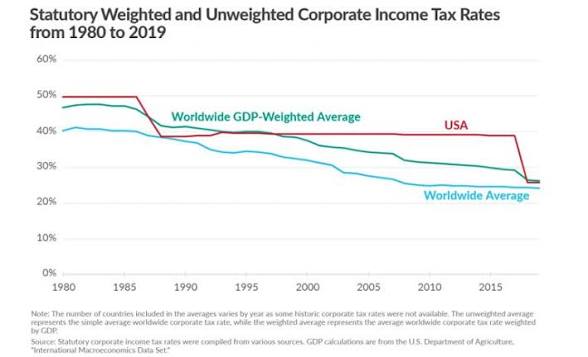
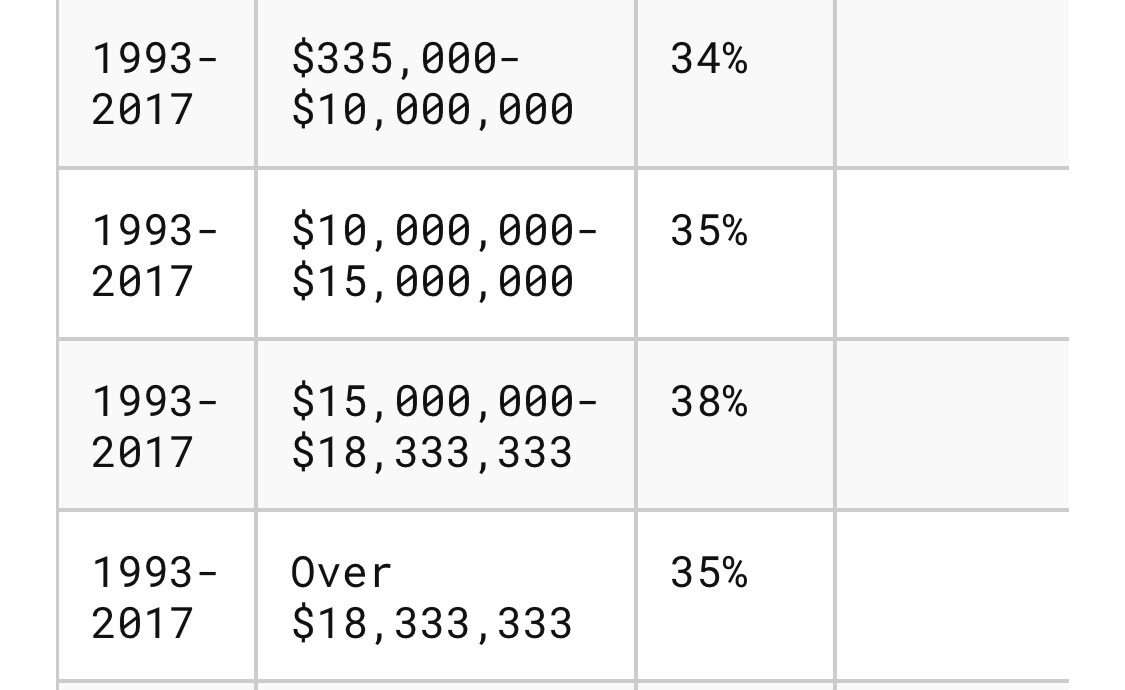
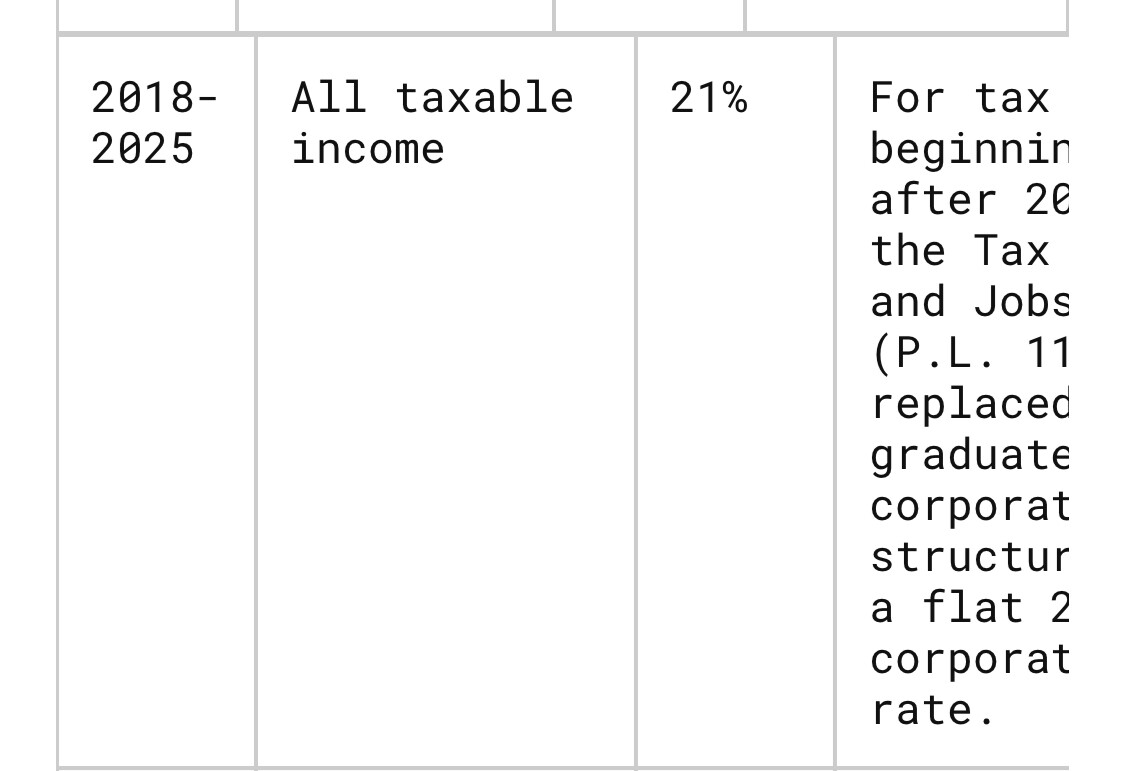
We might use a fixed 25% tax rate to avoid wild swings with corporate tax rates, or at least bound it. Also IntExp can be zero even with large debt. See WACC at the end.

Gross Cash Flow Debt Ratio

FundsFromOpA / DbtTotA

Return on capital employed

100 * NetIncBXorA / ComEqA

Invested Capital

(AstTotA - CashEquivA) - (LiabCurA - DbtSTA))

Return on Invested Capital (ROIC)

100 * NetIncBXorA / InvCapA

Return on Invested Capital (GP version)

100 * GrossProfitA /InvCapA

Return on Invested Capital (OCF version)

100 * OperCashFlA /InvCapA

WACC

(ComEqA / (ComEqA + DbtTotA)) * (@Rf + Beta1Y * 5) + (DbtTotA/ (ComEqA + DbtTotA)) * 100 * @CostofDebt * 0.75

For MRP (Market Risk Premium) we used 5%
For the Tax adjustment we chose 0.75 (1 - 25%)
For @Rf we use Close(0,##UST3MO)

The trickiest part is the the Cost of Debt which we formulated like this

Eval( IntExpA/DbtTotA < (@Rf+1)/100, (@Rf+1)/100, IntExpA/DbtTotA))

Typically the InterestExpense/Debt gives you the cost of debt, but lots of companies have very low or 0 Interest Expense because they hoard a lot of cash, which pays interest, and results in 0 Interest Expense. See AAPL for example: it has a 112B in debt but Interest Expense is 0. According to our research it's better to use Risk Free rate + a small spread.

Let us know what you think. Thanks.

2 Likes

FundsFromOp is an REIT-only measure that was incorrectly linked to a FactSet line item that usually equals OperCashFl. Please use OperCashFl instead to avoid confusion.

NOPAT is not EBIT. AT means after taxes. You have to subtract taxes somehow otherwise it's not NOPAT.

The return on capital formula doesn't seem to conform with any definition I've seen. I suggest OpInc / (Max(0, WorkCap) + AstTot - AstCur - AstIntan). That's what Greenblatt used.

ROIC normally does not use Net Income, but NOPAT instead.

WACC is usually calculated using market cap, not common equity. You want the market value of equity there (both in the numerator and denominator). And the risk free rate is usually the ten-year treasury rather than the three-month treasury.

The cost of debt should use 5-year averages, not the annual rate. The annual rate jumps up and down way too much.

2 Likes

There seem to be two WACC. One cap weighted one book weighted. Perhaps easier to just add them both:

Market-Weighted WACC:

  • Moves with stock price
  • Penalizes overvalued companies
  • Low WACC often = high multiple stocks
  • Can unintentionally embed momentum/valuation exposure

Effect:
More cyclical. Higher turnover. Can distort IC depending on regime.


Book-Weighted WACC:

  • Much slower moving
  • Cleaner separation of capital structure from price
  • Often behaves more like a leverage/quality factor

Effect:
Lower noise. More stable cross-sectional ranking.

I can't find anyone who uses book-weighted WACC. Mauboussin, Damodaran, Mihir Desai, Stephen Penman--they all use the market value of equity. Who uses the book value? I haven't seen that in any textbook, and I've looked at a lot. Investopedia says it's the market value, so does SimplyWallSt. Analysts use market value of equity. Morningstar does too. Where are you getting this from? ChatGPT? It kind of looks like it. Don't do that: ChatGPT is terrible at accounting measures. It would fail every single final exam in any accounting class.

1 Like

Oh, also, Beta1Y is probably too unstable for cost of equity. I use Beta5Y.

1 Like

Correct. GPT read all the papers that have empirical results. That's what matters.

P123 is not for accounting classes or valuation classes. P123 wants to provide a library of factors that have high IC cross sectionally, relative to each other. Factors that do well in ranking systems as well as ML.

We are about to unveil a tool to quickly test IC for any factor or formula. Whether it's from a textbook or novel. We'll see which versions are better.

Investopedia? Who are they really? There's no expert behind it. Founders never wrote a finance paper. Mostly journalists it seems. Today it's part of the People Inc. media family (which includes brands like People magazine and Better Homes & Gardens). Hum, they must care a lot about the factors they publish.

Below is FactSet official ROIC btw. That's it. Simple. And Morningstar probably has something just as simple.

They will be tested soon with our new tool. Who knows, it might be the best one of them all.

FactSet ROIC = 100 * FF_NET_INC / FF_INVEST_CAP
FactSet FF_INVEST_CAP = FF_SHLDRS_EQ + FF_DEBT_LT

1 Like

How do you know? Did you ask it what specific papers use the book value of equity to calculate WACC? Did it give you papers that actually exist? You have to prompt these LLMs well in order to get answers that make sense. I asked Claude Sonnet who uses book value of equity when calculating WACC and it couldn't come up with anyone. Maybe it's wrong, maybe ChatGPT knows something Claude Sonnet doesn't. But assuming that GPT read all the papers and spat out the result is a very bad idea.

I like this a lot, but factors have to make sense in addition to testing well. For example, NetInc/EV might test better than NetInc/MktCap but only one of them is correct. Similarly levered free cash flow to enterprise value may test better than unlevered free cash flow to enterprise value, but only one is correct.

Accounting standards exist for a reason. These standards can be codified through GAAP or IFRS or they can be widely accepted by practitioners and used in industries. I know people who calculate these ratios for a living. There are hundreds of thousands, maybe millions of them. If P123 introduces incorrect ways of calculating them, nobody is going to respect P123. Especially not the professionals who are asking you for these factors.

On the other hand, maybe that's better for me. If the masses of P123 users use incorrect formulas, that gives me an edge. So maybe I should just shut up.

2 Likes

Wacc related feature has to consider Market capitalization. No sense other way. While anyone can ask an LLM to produce a quick conclusion, what ultimately matters is what the investment is worth today, where the opportunity cost lies, and the fact that WACC is a forward-looking metric. Every additional input or feature must have a clear economic meaning; otherwise, it is just noise, trash...anyway everyone could/should consider if they want to dig into trash or not...medaillon fund for example seems to dig into trash a lot in the past :grinning_face_with_smiling_eyes:.

1 Like

This is almost the same as our ROI formula. The only difference is that our ROI adds back tax-adjusted interest expense.

The result will depend on the universe, the period tested, the forward return horizon, and the rebalancing period (if that's different from the forward return horizon). If you use different inputs, two different formulas for the same thing might well give you different optimal results. Don't get me wrong, I'd love to be able to use the information coefficient in my testing. But it may not be a tiebreaker.

1 Like

One thing I will add is I noticed some pointed out you need market value of equity for cost of equity but one can also point out market value of debt is the correct way and we do not have that data. There can be quite large differences between book value of debt and market value when credit quality improves, deteriorates, or rates do (I would know as I used to help auction off bad debt). It was common for me to see 80% haircuts. You could have the quantitative impression an issuer is safe while in reality they are distressed. When you apply it to large buckets these few troubled ones would sneak in

Separately, always happy to get additional metrics as long as the labeling for original ones does not overlap with standard terms. If it is original we just need to label it differently. If we do standard ones differently I do agree with Yuval credibility takes a hit in the eyes of trained users with the accounting knowhow. The great thing about Portfolio123 is we get to create custom formulas too so as long as we have the building blocks I am happy, but others may just like to use standard factors and will have a certain expectation

Very thankful for all the efforts to add useable metrics

Well that's what this post is for. To revive factor development. With the upcoming Asian data (did you pledge? few days left!) and our upcoming "Factor Miner", all these new factors and permutations can be properly tested.

BTW, the task to add ROIC (and several other ratios) was first added 5 years ago in our Jira. It was labelled with high importance and has been bounced around. No use in pointing fingers since most of the people responsible have left. But one of the reasons is the complications. For example NOPAT in "textbooks" uses the corporate tax rate. But our Jira task wants the sector average (not sure why). This makes the task a lot more difficult since we currently do not pre-compute sector averages (what universe, cap avg or median, etc.), so the entire task just gets moved around like a hot potato.

And, maybe, these tax adjustments are a complete waste of time when tested for IC. What if the strongest IC comes from buying the highest ROIC from every sector? The tax component of the formula gets completely canceled out, as well as all the effort that went into it.

Lastly, this "sector tax rate" is far from stable. Run this screen

FOrder("MktCap", #Sector, #DESC, true) = 1

This gives you the top stock in each sector by MktCap. Then click on any of them, and go to the fundamental chart. Start a new chart and enter this formula

Aggregate("TxRate%TTM", #Sector, #CapAvg,16.5,#Exclude,false,true)

Scroll though the charts and tell me if it makes any sense to use it!? I don't see it. If the IC is confirmed we will use it. If not a simpler, less noisy version of ROIC is what's best for P123.

1 Like

Hmmm it was probably scheduled/planned that way because every year a company’s tax rate can and will fluctuate a lot. For example, if everything stays the same but capex goes up they could deduct some capex. A wild example would be very high stock comp due to appreciating shares nullifying the entire tax paid. Then there is also federal, local, and state law changes. Then there is the question of what percentage of income is foreign and earned by subsidiaries. Deferred tax (timing issues). Past loss carryforwards. And many more I am not thinking of right now. Probably would use the median subsector or industry myself if I was going to group it. If not grouped maybe a multiyear average. Tough issue for quant approaches. Do we have a expected tax by analysts? A complex topic to account for for sure..

1 Like

IC will depend on the scenario you are digging, it hard to be generalized.

Better to use and average sector tax ratio than a high volatile tax corporate for each company but it s delicate matter, carry forward could have impact here as well.

10y bond for risk free rate it s better and more accurate and will depen on the country of course (where sales and operations come from)

The estimate of beta...the best approach is a bottom up procedure...more difficult as well

I tried all tax rates: TTM, Annual, Medians, Averages, Cap Averages. All seem useless with huge outliers and unnecessary volatility. General trend is tax rates have decreased since 20 years ago from around 35% to around 25%. That's across the board.

Easier to just use 25% for everything. Or even better, nothing at all.

We'll see.

1 Like

Actually something like using a fixed rate (but changing over the years with the tax code) would actually make sense as part of cost of debt since corporate tax rates are not currently progressive in the usa.

Basically picking the corporate tax rate for that year. In the older years, the max rate is paid by most profitable public companies anyways in terms of marginal income/expenses

Something like this that looks at corporate rates over time but based on official rates and timings:

Should be just a couple percentages over the years or simplified to 35 then 21

Well, I believe that utilities, real estate, and financials are generally going to have lower tax rates than other companies. I think that's the reasoning behind using sectors. When I used that Aggregate command you pasted I got good present-day results using the Easy to Trade North America and Easy to Trade North Atlantic universes. For years I've been using TaxRate%IndTTM to adjust interest expense for unlevered free cash flow. And for years I've been wishing for something more consistent. Sector definitely is.

1 Like

Please consider to add alternative quality measurement like spread of top and bottom bucket as well. I use IC allot in my analysis, but there is a fundamental limitation of Spearman IC — it measures monotonicity across ALL buckets equally , but for stock picking we care more about the top buckets.

Example
The first screenshot has great top bucket return, but the spearman rank is very low = Will give Low IC

Second screenshot. Half boring quantile top distribution but very high spearman rank = Will give High IC

This is one of there reasons why many AI models do not produce top bucket heavy ranking system, fundamentally many of the calculations focus in the distribution (like IC calculations).

*This is also why catalysts like Market Cap does not always work they way we expect in AI models, took me a while to realize that.

4 Likes

There's weighted IC too which is maybe nicer. Several variations exist, smoothed, discrete, etc.

Can’t wait to see WACC in place!

1 Like