As mentioned in previous posts we’ve been developing a “Macro Scoring” system (previously called Market Score). You can access it here or MARKET->MACRO CHARTS . We’ve just released a new version that has these additional capabilities:
Save your charts layout
Share your charts & backtests with the community. A new Public Folder is created with your user name when you share.
Added three new series from Prof. Robert Shiller for SP earnings,PE10 and dividend
Enhanced user interface : copy, enable/disable binary charts (for backtesting)
The binary signals now act as ranks, each signal is either 0 or 100, and the overall rank is the combined score, weighting each signal equally (to double up on a signal add it twice)
This new tool has two main purposes:
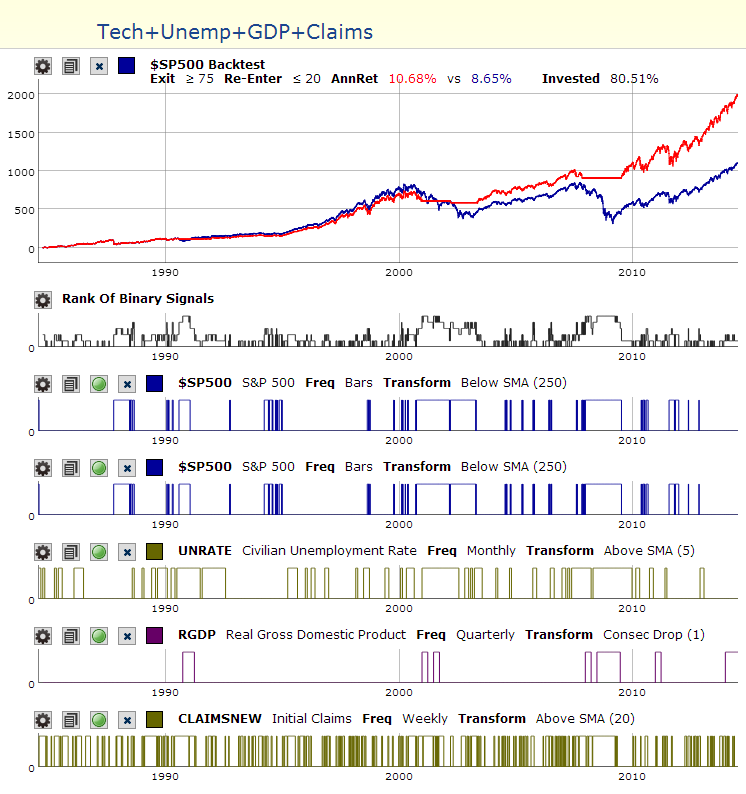
1- Develop a market timing signal using the “Add Backtest” button for testing.
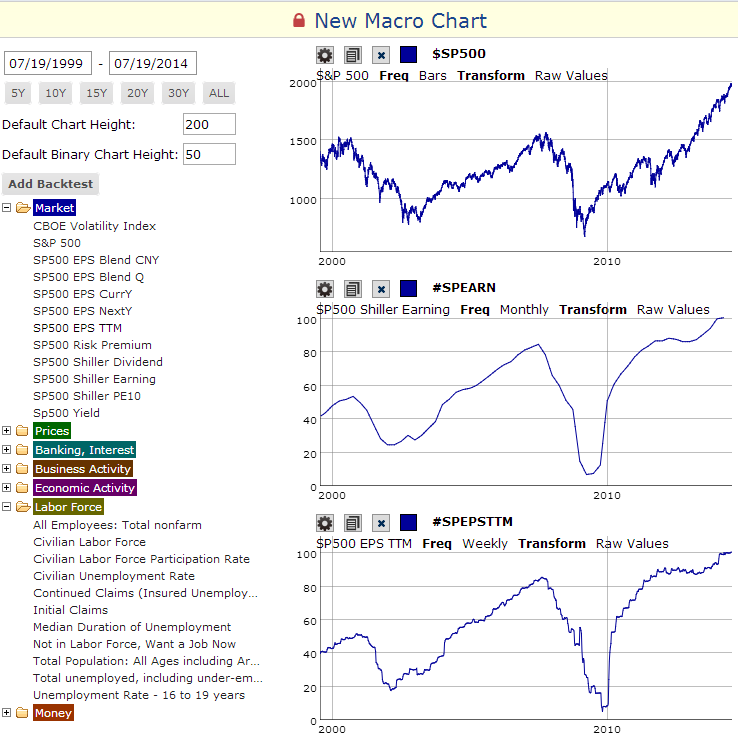
2- Create your own “Big Picture” chart layout
Future plans for Macro Charts:
Currently this is just a playground and the data cannot be used in systems. You will eventually be able to reference the “MarketScore” and Point in Time data from your rules for market timing purposes
Many new series will be added to complement economic data such as breadth indicators. We welcome your suggestions!
All, this is uncharted territory as we don’t think anything like this exists. We are encouraging sharing your results so all can benefit. When you save your chart layout please choose to share it. In a next release when you share a Macro Chart with a backtest, the overall annual return will be displayed.
[size=3]Show off and compete for the highest annualized returns. Thank You [/size]
ATTACHMENTS:
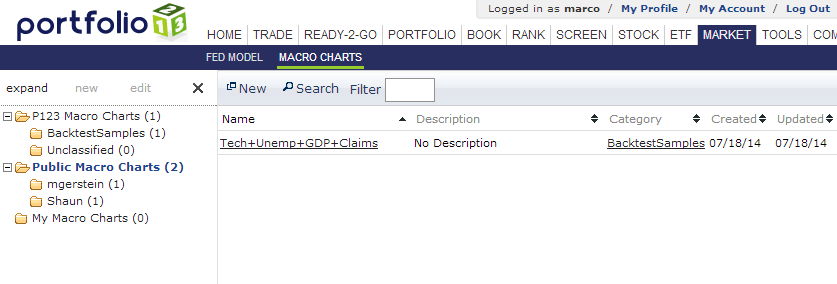
View of the folders containing chart layouts: P123 charts, community charts, your own charts. P123 will be adding more soon
Sample backtest available in P123 Macro Charts->Backtest Samples
Comparison of Shiller SP500 trailing earnings (monthly) compared to our own #SPEPSTTM (weekly). Pretty much a match as far as values, but ours only goes back to 1999, Schillers from 1950
The GDP and GNP numbers are currently available only until the end of 2013. That means a six months lag and (I am not sure about this) but they may get retroactively revised for up to two years. That means that while it may have implications for backtesting it’s useless as a real time indicator. A useful proxy for GNP which does not have a look ahead bias may be the total sales of all the companies in the database (or at least the S&P 500). That would be interesting.
The SMA is limited as an indicator because it gives full weight to all the values in the series but zero value to the bar just before the series. Life is not usually so black and white. The EMA is a better indicator. The double smoothed EMA may be an even better indicator in some cases because it gives the most weight to the value at the peak and gradually less weights to the bars on either side of the peak. Thanks.
The St. Louis Fed Financial Stress Index looks like a potentially useful indicator. The chart looks like it correlates somewhat. Also, according to my understanding of how the economic machine works, recessions are caused by a reduction of lending. One reason for banks to lend less is financial distress. Ergo high finacial distress causes a recession. Yet, I could not get a good backtest out of this indicator. I tried consecutive rises in this index and a increase above assorted SMA levels. Anyone have any other ideas?
Suggestion: Overlay the S&P 500 on the chart that pops up when clicking “add series”. This would make it many times easier to make useful indicators quickly.
NYSE net margin debt available here. This is probably most useful as a ratio–perhaps a percentage of total market cap.
The yield curve ratio (based on the data that you are already getting).
Market Cap / GDP ratio (this is really more predictive long term than the Schiller PE but is not very useful by itself).
The total (gross and net) loans that all banks have made in their most recent quarter. This should be available somewhere in Compustat’s database. If it’s not in Compustat’s database then it is probably available for free from one of the bank regulators.
I would like to see more control over the formula for generating the binary indicator. I don’t find comparing a raw value to a moving average of the value all that great. Am I missing something?
Some things I would like to see:
mutual fund inflow/outflow data
Commitment of Trader Report for at least the S&P 500 Futures commercial traders (range of 0 to 100 based on a lookback period of 1 year)
mergers & Acquisitions / spin-offs can tip off where in the business cycle we are. There must be long term indices kicking around somewhere
put/call indicators for the major stock indices
market consensus indicators - Market Vane, AAII, etc.
Chipper - I thought it would be formula based like buy/sell rules. All I see is raw value > (or <) SMA(…). This feature doesn’t seem to allow SMA(…) < SMA( …) for example. Or one time series compared to another. How would you provide a binary indicator based on the yield curve?
Thank for your feedback, however after some more analysis, it may be that the backtest results are meaningless unless they are point in time. GDP & GNP are good examples since the revisions can be quite dramatic: going from an increase to a decrease. So the current backtests results are not to be trusted.
This was not anticipated. There was this assumption that the trend would hold up even after revisions, but it does not appear so.
I’ll provide examples tomorrow, and we’re working on a point in time version. Should be a few days.
I have already mentioned the point-in-time problem in my posting on June 30. http://www.portfolio123.com/mvnforum/viewthread_thread,7730
“Also note that many indicators are not point in time. For example the May 2014 unemployment rate is listed as 6.3% on 5-1-2014, but it was reported on only later 6-6-2014. It is even worse for GDP which is reported 4-months after its listing date. So unless adjustments are made to the series dates to correspond to reported dates then the FRED indicators are almost useless for timing purposes.”
I have come across this in setting up recession indicators based on various economic data. One can only use the data when it is reported - not with the date of the data series.
and noticed that even if I add the second line (the first factor that contributes to the rank) [SP below 250 day sma] multiple times, the backtest results do not change…one would think that adding it multiple times would skew the results one way or the other as it’s weight in the rank increases
Thank you, good link. Here is the exact link to the technical details of the Conference Board Leading Economic Index. Let’s see if Marco can produce point-in-time data, and if all the components for calculation (on page 3) are available. http://www.conference-board.org/pdf_free/press/TechnicalPDF_5241_1405674010.pdf
SC, I think it’s correct. It’s a rank, so after adding two+ they take over the exit signal since it’s Rank>=75. The re-entry signal is take over by the SP once you add 5+ since it’s Rank <=20
Interesting link for Conference Board, thanks. Looks like a weighted multi-factor indicator, but the weights are adjusted every so often. We’ll make sure we have the components. Also, shouldn’t be too hard for us to allow a user created weighted series, which can then be used to generate signals. Although hhe weight adjustments are a bit trickier.
I’ve finally gotten around to testing this out some more. Great tool! I’ve used it to create a few dashboards of macroeconomic charts, which are very useful to get a feel for the economic environment. However, I haven’t been able to create a backtest using all of the metrics that I would like.
Is there a way to combine some of the data? For example, I’d like to get the difference between the 10yr and 30yr Treasury yields. This would be helpful to test out the theory that an inverted yield curve is often a harbinger of recessions.
I’d also like to chart the difference between high-yield bonds and Treasuries, to get a sense of junk bond premiums.