Number of stocks?

I am accustomed to hearing the argument that to reduce idiosyncratic risk, one should hold more than 15-20 stocks(The Diversification Myth: Why 30 Stocks Aren’t Enough for Your Portfolio), but then I came across this. Does anyone have thoughts on this, and how many stocks do you hold?

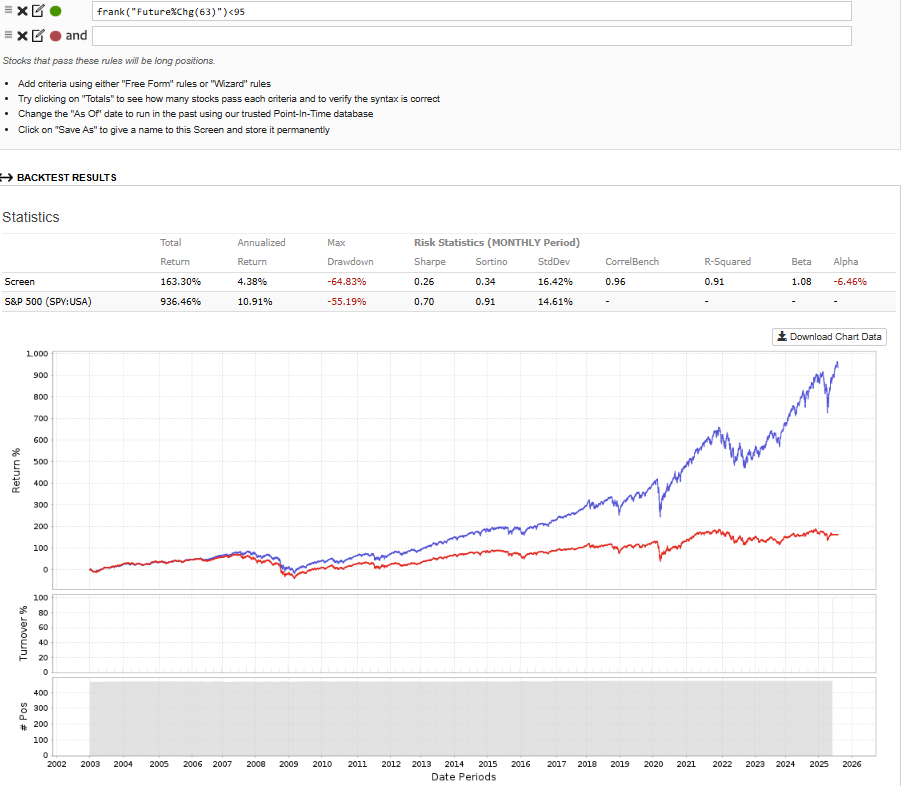
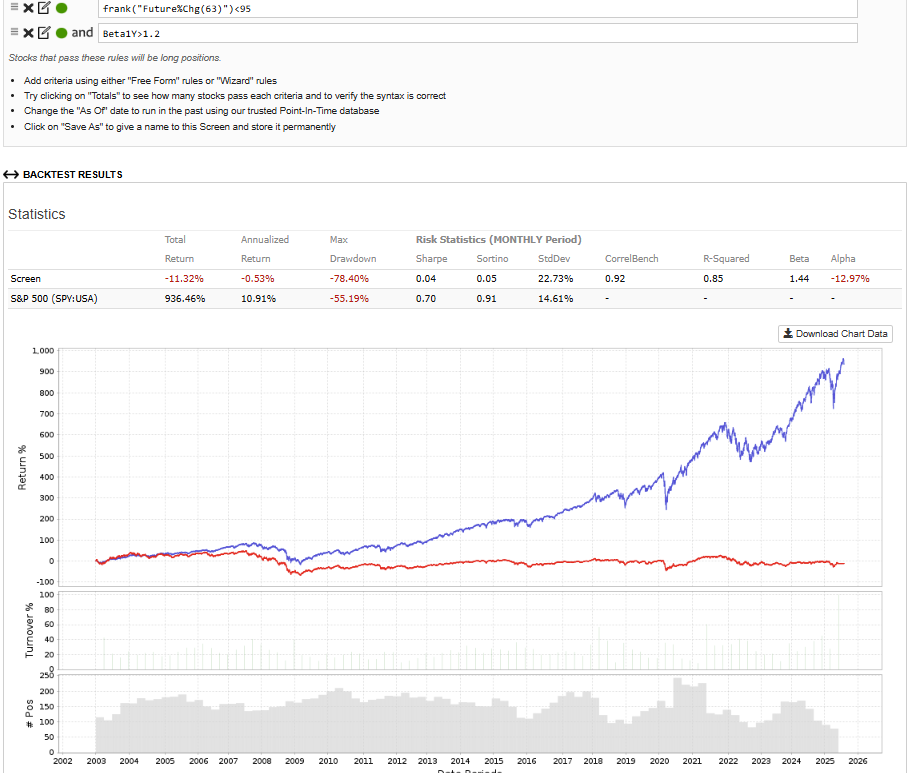
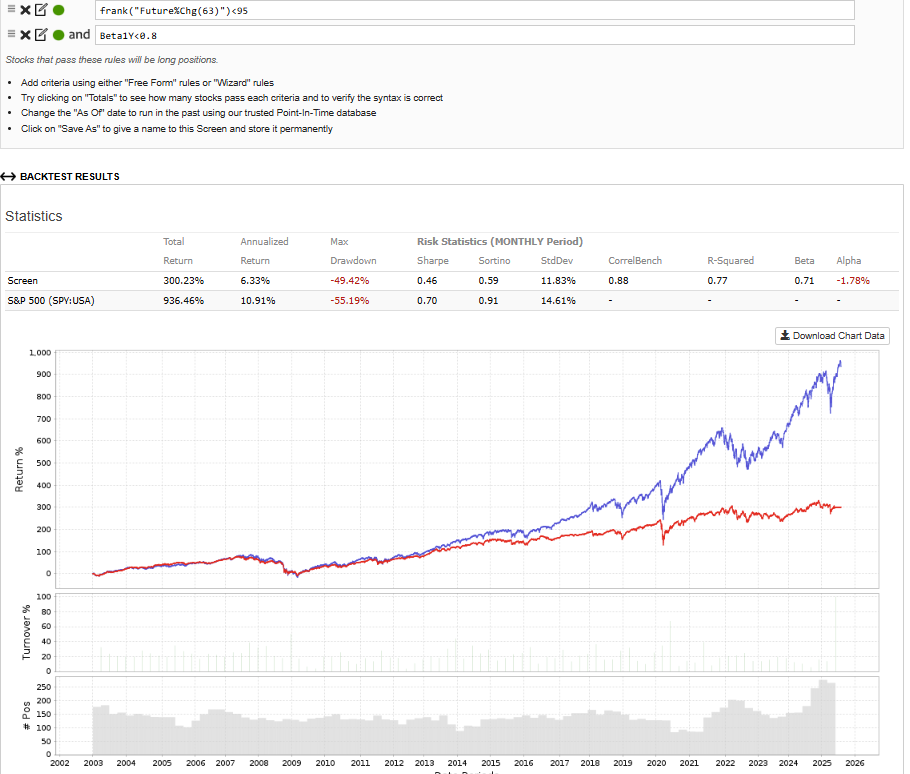
Regardless, it demonstrates how irrelevant it is to run tests or simulations in backtests with too few stocks. There is too much noise and randomness in the market.

The Studies Referenced in the Video:

  1. JP Morgan - "The Agony and the Ecstasy" (2021 & 2024 editions)

  2. Hendrik Bessembinder - "Do Stocks Outperform Treasury Bills?" (2018)

  3. "Why Indexing Works" (2017)

  4. "Mutual Fund Performance at Long Horizons" (2023)

  5. "Underperformance of Concentrated Stock Positions" (2023)

  6. "How many stocks should you own?" (2022)

  7. "Fund Concentration, a magnifier of manager skill" (2022)

What the Studies Tell Us, Summarized in 10 Points:

  1. Nearly half of all stocks end in disaster. 44% of stocks in the Russell 3000 index (a broad U.S. index) from 1980 to 2020 experienced a decline of 70% or more from which they never recovered. The risk of a permanent, massive loss in a single stock is therefore alarmingly high. (JP Morgan)

  2. Most stocks lose to a risk-free savings account. Over half (57.4%) of all U.S. stocks since 1927 have had a lifetime return that is lower than a risk-free Treasury bill (T-bill). Thus, you statistically have a better chance of earning more by keeping your money in a risk-free asset than in a randomly selected individual stock. (Bessembinder)

  3. The entire stock market's gain is driven by a small number of "mega-winners." While most stocks underperform, a small fraction delivers exceptional returns. These few winners pull up the average for the entire market. This explains why it is so difficult to beat an index fund—the probability of picking a loser is statistically much higher than finding one of these rare winners. (JP Morgan & Bessembinder)

  4. Today's winners are often tomorrow's losers. This is one of the most critical points. Stocks that have performed best over the past 5 years have a statistical tendency to underperform the market over the next 10 years. Buying a stock because it "has done well" is a dangerous strategy. (Underperformance of Concentrated Stock Positions)

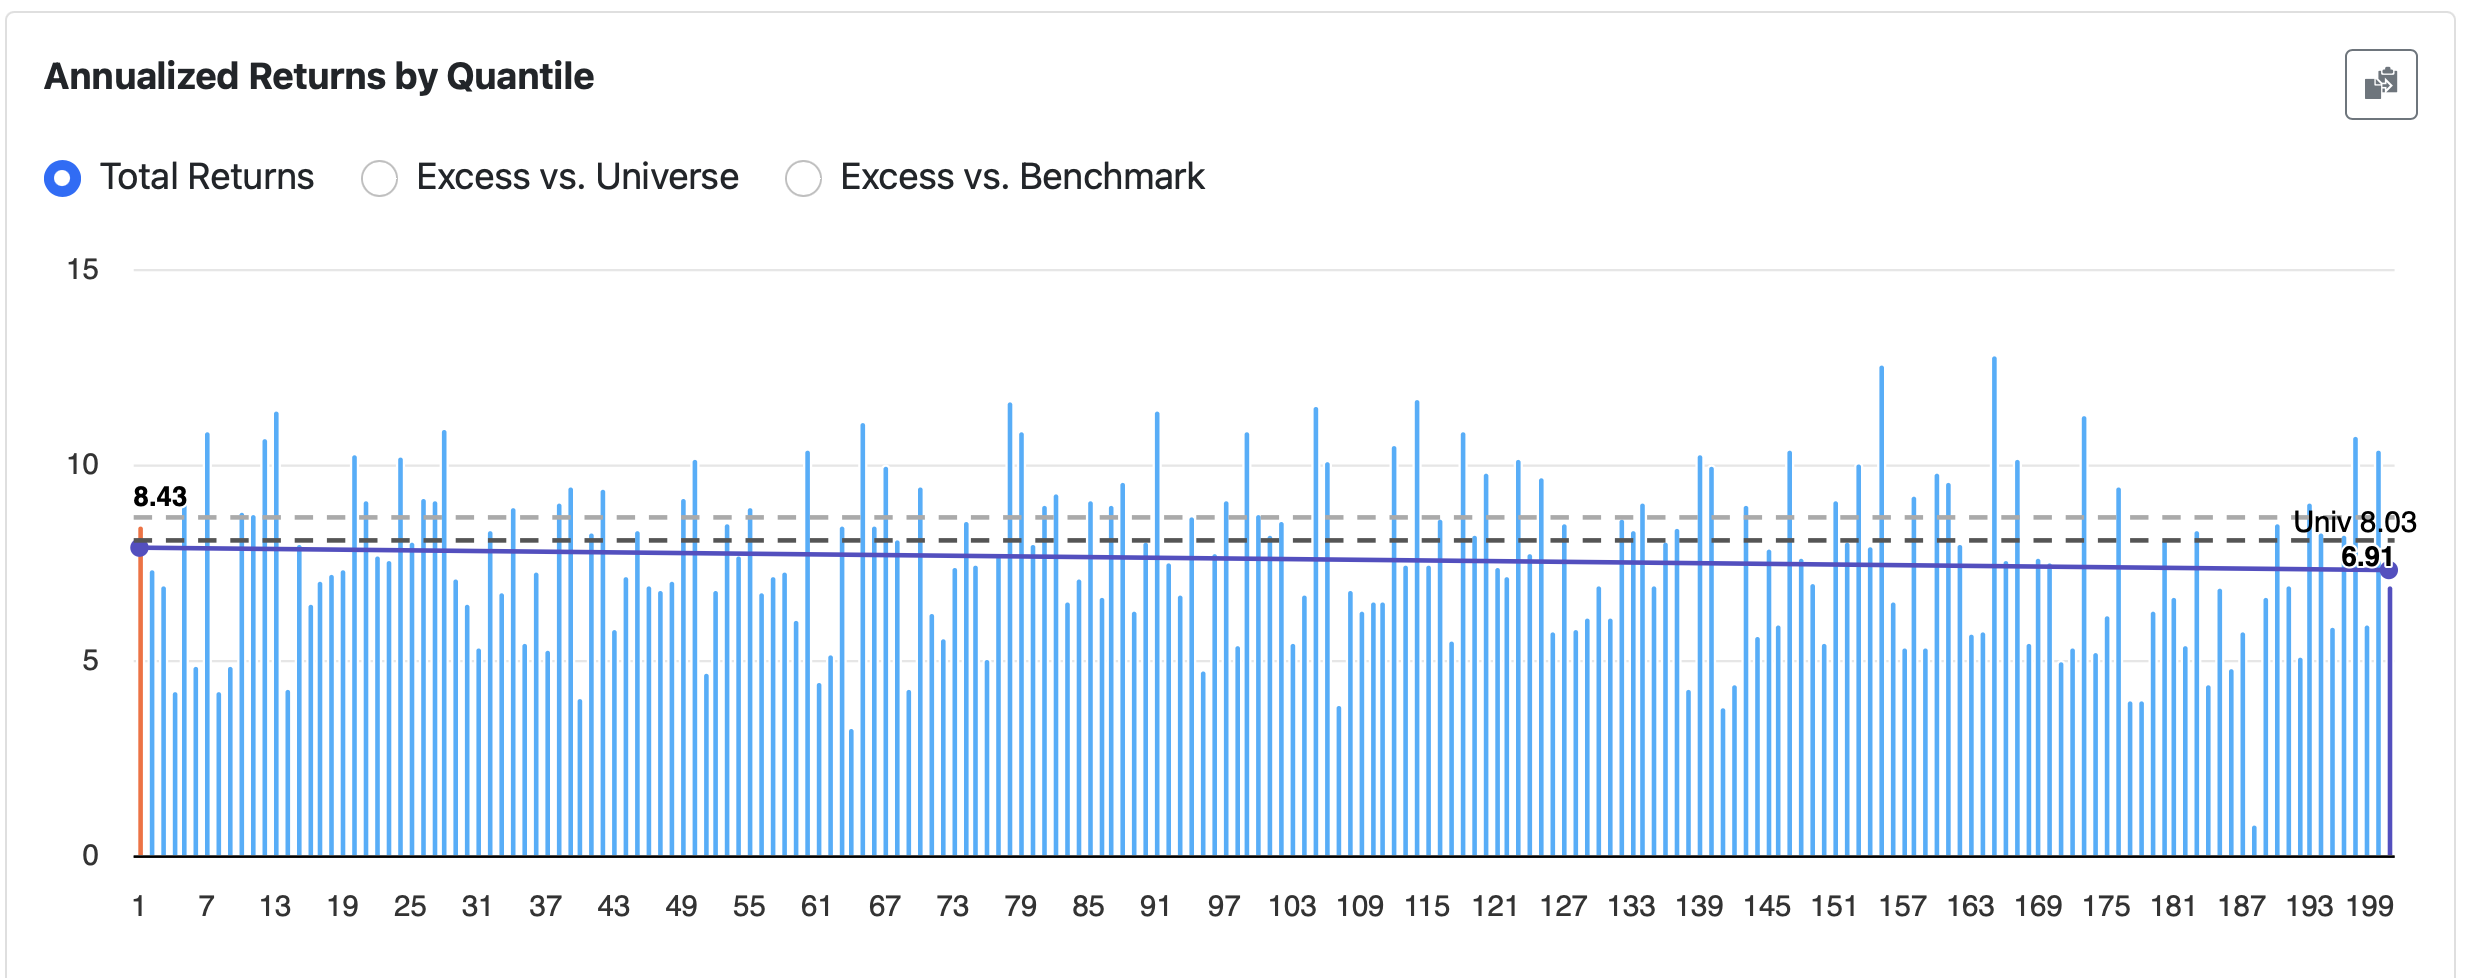
  5. The old rule of "20-30 stocks" is outdated. To truly protect yourself against the worst long-term outcomes, you need far more stocks. Research shows that the worst outcomes (e.g., the 10th percentile) improve dramatically until the portfolio contains around 250 stocks . (How many stocks should you own?)

  6. Concentration punishes the bad more than it helps the good. Increased concentration in a portfolio (fewer stocks) amplifies the outcome. It has a positive effect for those skilled at picking stocks, but an even larger negative effect for those who are not. Since most are not skilled stock pickers, concentration is a strategy that most often leads to poorer results. (Fund Concentration)

  7. Even professional managers struggle to beat the market. Due to the skewness of the stock market, less than half (45.2%) of active funds managed to beat an S&P 500 index fund—and this was before their own management fees were deducted. The odds are stacked against active management from the start. (Mutual Fund Performance)

  8. Catastrophic losses are unpredictable and can happen to "good" companies. Most companies that experienced massive losses had "buy" recommendations from analysts, were profitable, and had reasonable debt levels before their collapse. It is nearly impossible to predict which stock will be the next loser. (JP Morgan)

  9. The mathematical reason why index funds work. When returns are positively skewed (few big winners, many losers), picking a random subset of stocks (stock picking) will almost always increase the probability of underperforming the entire index. Owning the whole market through an index fund is the only way to guarantee you capture the returns of the few winners. (Why Indexing Works)

  10. A diversified portfolio is better than a coin flip against the market. Even a portfolio of 100 randomly selected stocks has historically had less than a 50% chance of beating the market index over a 10-year period. By picking stocks, you statistically have a greater chance of losing to the market than winning. (Bessembinder)

4 Likes

I haven't read much of this literature, but my impression is that most (all?) of the studies are based on strategies that holds a random set of stocks through their entire lifetime (that is, the lifetime of each stock, not the lifetime of the investor).

In real life stocks are not selected at random, and no one holds stocks through their entire lifetime. The results are still interesting, this is not bad science, but I'm unconvinced that it's possible to learn much about real-world portfolio sizing using this method.

3 Likes

This is why you should not randomly pick stocks🙂. Both random selection and indices are full of bad businesses. Indices do well if a minority of great performers exist, but this will vary by country and time period. I have seen indices literally drop 99%

3 Likes

Extremely interesting!!!

I wondered what the effect of rebalancing has on this—something that I do relatively frequently with my ports. I think the rank performance test can answer this.

The is a rank performance test for random() using the easy to trade universe with yearly rebalancing over 24 years.

And chack me on my reasoning, but this is like the results of 200 portfolios rebalanced randomly, with the number of holdings tracked in the second screenshot (which varies a little but averages around 20 stocks). People can see the result for themselves:

Here is a histogram of the distribution (CARG has been decimalized)

This may be pertinent for some of our ports--that in the worst case have no edge and are essentially random, but are rebalanced at least yearly in most cases.

People can draw their own conclusions, but personally, I find the range a little uncomfortably wide. I wouldn’t want to have something this concentrated unless I was confident I had an edge.

As a side note for those wondering whether their models have an edge:
I sometimes run 200 random portfolios over the same period as my model and check whether my results beat the top 5% of those random runs. It’s a simple, non-parametric null hypothesis test — a way to ask whether the model’s performance exceeds what could be expected by chance (i.e., a p-value < 0.05).
Or with the example above, I can just see where my model lands in the histogram — giving me a visual reality check.

1 Like

I’ve made enough mistakes in my life to learn that a portfolio of just 15–20 stocks will eventually fail. If you have a high turnover in your portfolio, I’d say the risk of experiencing massive drawdowns increases dramatically. The reason is simple: if you’re holding that few stocks, you’re most likely chasing CAGR and picking higher-beta stocks than the median. When the market turns sour, you’ll likely end up chasing the wrong stocks. If you where not a CAGR chaser, you would have held more stocks.

Regardless of how much you backtest your strategies here, we’re either overfitting or at least fitting the models to the data. Without hesitation, we’ll discard a model that shows an anomalous drawdown during a strong market, but we’re far less likely to discard a model that shows anomalously high returns during a weak market. The more stocks you hold in a strategy, the harder it becomes to overfit, even if you did overfit, the result wont be as bad as if you overfitted with few stocks.

Among all your friends and family members who’ve had bad experiences in the stock market—how many stocks were they holding? Few or many?


Since I mentioned the high beta stock chaser, I just want to prove a point to what happens if you ton't pick the best stocks with a high beta model.
Below is the SP500, holding all the stocks exept the 5% best performing stocks the comming quarter.

Now if you where a high beta chaser and picked the wrong bets (Beta1Y>1.2), the result is devastating.

If you picked only low beta stocks (Beta1Y<0.8) and picked the wrong bets, you are still surviving. You even had years when you performed just as well as the market with out the comming known winners.

3 Likes

For this reason is important to stress at maximum systems with few stocks, rolling backtest, testing in subuniverses, and universes out of focus, in fact std deviation and low std deviation should increase a lot but with a increase in your reward (high cagr, sortino and sharpe). Of course you can integrate this more agressive systems in a book to reduce volatility and risk

2 Likes

I'm curious how many stocks you think it sufficient/optimal for a retail investor? I've found 20 stocks to work, but all your points on how it's easy to end up with a high beta portfolio are very good.

I've had a good run over the last ten years with very concentrated portfolios. My main strategy right now holds 61 stocks, but 90% of it is in 29 stocks: the other 32 are kind of remnants of stocks I haven't sold out of yet, or stocks I've just barely dipped my big toe into, all with weights under 0.7%. I have more than $4 million in this portfolio, and its CAGR since 2016 is 49%. My hedge fund is similar: 90% of my portfolio is in 29 stocks there too, and my top five positions constitute 48% of my portfolio. And the total equity in that portfolio is close to $17 million. With smaller AUMs I have even more concentrated positions. In the account I'm managing for my kids, 90% of the portfolio is in only 15 stocks, and the top five make up 53% of the portfolio. There's $140K in that portfolio, and it has a CAGR of 60% over the last four and a half years. I can afford to make it much more concentrated because the transaction costs are so low, and the result is a much higher return.

There's nothing wrong with concentrated portfolios. After all, Warren Buffett's portfolios were famously very concentrated. The problems arise when you backtest concentrated portfolios. That's a big no-no. Backtest very large portfolios for the most robust results.

2 Likes

Thank you for all the feedback.

Yes, I agree with what is also being said; it is unrealistic for an investor to both own a stock for its entire lifespan and choose randomly assembled stocks for the portfolio.

Regardless, it is interesting that when they traditionally looked at criteria normally considered good for stocks, it yielded some of the same result: "Most companies that experienced massive losses had "buy" recommendations from analysts, were profitable, and had reasonable debt levels before their collapse. It is nearly impossible to predict which stock will be the next loser." https://www.jpmorgan.com/content/dam/jpmorgan/documents/wealth-management/the-agony-and-the-ecstasy-2024.pdf

JPMorgan study finding:

The report begins by dismantling common myths about which companies suffer catastrophic losses. Many investors believe such failures are confined to:

  • Companies with aggressive management and excessive debt.

  • Companies that have never been profitable.

  • Companies with illogical business models (like WeWork).

  • Companies in obvious "bubbles" or "value traps" that should have been revealed by their valuation.

The study demonstrates that this is incorrect.

  1. They Were Profitable and Had Sound Finances:
  • 54% of the companies were profitable (had positive net income).

  • 63% had a healthy debt level (net debt-to-EBITDA of 2x or less).
    This proves that strong financials alone are not a safeguard.

  1. They Had "Reasonable" Valuations:
  • Most of the companies had "reasonable" forward P/E (Price/Earnings) multiples at their peak. They did not signal an extreme bubble or an obvious value trap.

  • The chart shows that a large portion had a P/E between 10 and 50, an interval often considered normal.

  1. They Came from Seemingly "Safe" Sectors:
  • The sector with the largest number of catastrophic decliners was Healthcare/Biotech .

  • At their peak valuation, over 80% of the companies that later collapsed had a consensus "Buy" or "Strong Buy" recommendation.

Regardless, here is another study that points to other ways to ensure better diversification, and it even goes so far as to say that asset class diversification is not the most important factor, but rather regional and country diversification.

https://papers.ssrn.com/sol3/papers.cfm?abstract_id=4590406

  1. The Optimal Portfolio: The optimal portfolio that provided the highest "utility" (a way of quantifying satisfaction over retirement consumption) was 100% stocks , allocated as 33% in the domestic market (e.g., the US for an American investor) and 67% in international markets.
  2. Superiority Over Traditional Portfolios: To achieve the same expected utility as someone saving 10% of their income in the optimal 100% equity portfolio, an individual with:
  • A 60/40 portfolio (60% stocks, 40% bonds) would need to save 19.3% of their income.

  • A typical target-date fund would need to save 16.1% of their income.

  1. Lower "Risk of Ruin": The paper analyzed the risk of running out of money in retirement (using the 4% rule). The optimal 100% equity portfolio had by far the lowest risk:
  • 100% Equity (Optimal): 7.0% chance of running out of money.

  • 60/40 Portfolio: 16.9% chance.

  • Target-Date Fund: 19.7% chance.

  • 100% Domestic-Only Stock Portfolio: 17.1% chance.

  1. Market Valuations: Even when the stock market is priced at historically high levels, the optimal portfolio changes very little. The recommendation becomes a slight reduction in the domestic stock allocation (from 33% to 16%) and placing 9% in bonds. However, the benefit of this adjustment is minimal. The main point is that even at high valuations, a nearly 100% equity portfolio remains optimal.

  2. Robustness: The 100% equity conclusion remained stable even when the data was changed drastically, for example by:

  • Excluding the US entirely from the dataset.

  • Using only data from after World War II.

  • Excluding countries with extreme events (like Germany, where bonds became worthless).

  1. Leverage: The common theory that one should leverage a diversified 60/40 portfolio to achieve higher returns does not hold up over the long term. If leverage is to be used, it is better to leverage a 100% equity portfolio , but this is only advantageous if the cost of borrowing is very low (such as through derivatives).

Here is more from the study:

The reason a pure equity portfolio is optimal lies in the study's methodology and how it captures the long-horizon properties of different asset classes.

  • International Diversification is Better than Bond Diversification: While traditional theory advocates for diversifying between stocks and bonds, the study shows it is far more effective for a long-term investor to diversify between domestic stocks and international stocks .

  • Bond Properties Worsen Over Long Horizons:

    • Higher Real Risk: The annual variance (risk) of bonds increases with a longer time horizon. They are not as "safe" in real terms as commonly believed.

    • Increased Correlation: The correlation between bonds and domestic stocks rises over the long term, reducing their diversification benefit.

    • Poor Inflation Hedge: Bonds have a strong negative correlation with inflation (-0.78), meaning they lose significant purchasing power during periods of high inflation.

  • International Stock Properties Remain Favorable:

    • Lower Real Risk: The annual variance of international stocks decreases over long horizons.

    • Stable Correlation: Their correlation with domestic stocks remains steady.

    • Better Inflation Hedge: International stocks are nearly neutral to inflation (correlation of -0.01).

  • Superiority in Actual Outcomes: The optimal portfolio beats standard alternatives on all key metrics:

    • Higher wealth at retirement.

    • Lower risk of running out of money (a 6.7% "ruin probability" vs. 16.9% for a 60/40 portfolio and 19.7% for a target-date fund).

    • Significantly larger bequests.

Testing and Robustness: The Conclusion is Extremely Solid**

One of the study's greatest strengths is the number of scenarios tested to see if the conclusion holds. The answer is almost always yes. The optimal portfolio remains ~33/67 stocks under a wide range of assumptions (see Table VII):

  • Modified Data Period: Using only post-WWII data.

  • Excluding the US: Even without the historically strong US data, a pure equity portfolio remains optimal (the domestic allocation increases to 45%).

  • Varying Levels of Risk Aversion: Whether the investor is nearly risk-neutral (gamma=0.5) or very risk-averse (gamma=10), the allocation does not change significantly.

  • Different Savings and Withdrawal Strategies: Changing the savings rate, retirement age, or withdrawal rule does not alter the optimal allocation.

  • Different Household Types: The findings apply to singles, same-sex couples, etc.

  • Correlation with Labor Income: Even if labor income is highly correlated with the stock market (correlation of 0.5), the solution is to reduce the domestic allocation (to 18%) and increase the international one (to 82%), not to buy bonds.

  • Leverage:

    • With a medium cost of borrowing (realistic for a retail investor), it is optimal to leverage the pure equity portfolio by 55% , not a 60/40 portfolio.

    • Only with a very low cost of borrowing (as with derivatives) does it become optimal to include a small allocation (15%) to bonds in the leveraged portfolio.

4 Likes

One of the key things to know is that taking a global historical viewpoint means high and hyper inflation and currency crises due to government miss-management come into play. This kind of thing destroys a fixed-coupon bond.

While equities or real assets (like gold or property) might hedge against inflation by appreciating, fixed coupon bonds often amplify losses. Governments often even deliberately inflate away debt, benefiting themselves at bondholders’ expense—a common tactic historically. The irony is that investors went into bonds to avoid risk in the first place, but they discover that instead they just shifted risk to a different economic driver.

In other words, bonds—sought for their perceived safety—transmute market volatility into inflation risk, a bitter irony that has ensnared countless investors.

4 Likes

The video does a great job highlighting the importance of block bootstrapping — a powerful tool for understanding the range of possible portfolio outcomes.

And you don’t need to understand all the math to benefit from it.

While not necessarily looking at the same things as the paper, you can use the block bootstrapping method yourself — free — using a wide range of assets here: Portfolio Visualizer: Monte Carlo Simulation

Block bootstrapping isn’t new or radical — in fact, Portfolio Visualizer seems to have fully adopted it.

I don’t even see the option to use the old Monte Carlo simulation method anymore — likely for the reasons explained in the video. He makes a strong case.

If you want to expand on this further, ChatGPT can help you get started in Python too.

For example, here is full code for switching from standard bootstrapping to block bootstrapping with Sklearn's random forest. You would consider doing that essentially for the same mathematical reasons expressed in the video: Improving Sklearn’s Random Forest for Stock Data with Block Bootstrapping

This is a great video — and a reminder that we can adopt and extend powerful tools from academic research.. In many cases, it’s as simple as heading over to Portfolio Visualizer's free site.

Screenshot from Portfolio Visualizer:

BTW, thanks @yuvaltaylor for your post.

Here’s my take:
If you upload any simulation data into Portfolio Visualizer’s Monte Carlo tool (via the optional upgrade), most of the concerns raised in the video no longer apply. For example, even with a 100-stock version of my simulation (along with other assets), Portfolio Visualizer estimates that I can withdraw a substantial portion of my portfolio each year — indefinitely — with zero risk of ruin.

That’s striking — and possibly the clearest endorsement for P123 I can offer.

After all, who wants to have the good fortune to live to 100, only to go broke somewhere along the way? Why even take that chance if you don't have to?

I’m confident Yuval and others would see similar results. And importantly, this uses the exact same method outlined in the video.

Having an edge makes a HUGE difference. The key is uploading a realistic simulation.

4 Likes