I did some digging and it doesn’t appear that Open/Hi/Low/Close functions are actually adjusted for dividends, in contrast to how I read the documentation.
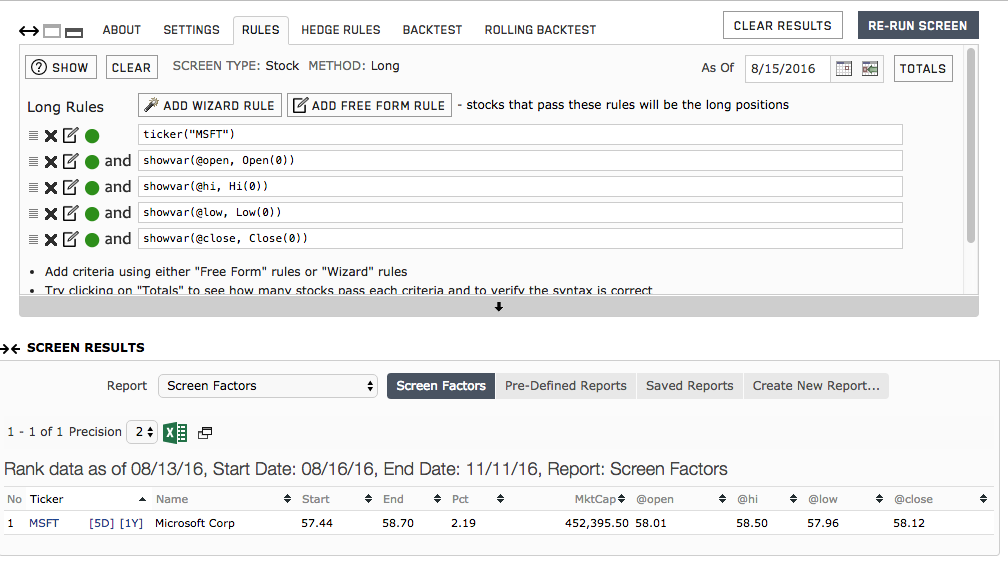
Note that MSFT went ex-div on Aug 16th, 2016 to the amount of $0.36. Looking at the Close via ShowVar(@close, Close(0)), and setting the date to 8/15/2016, I see a close value of $58.12.
However, double checking this on stockcharts.com (which makes a big deal of their dividend adjusted time series charts), I inspect August 15, 2016 and see the close price was $57.76.
Doing the math: 58.12 - 0.36 = $57.76
Open, Hi, and Low are all off by the same amount (price of dividend) vs stockcharts.com.
P123 is correct. Future dividends and splits are reversed out in order to make the screen point in time. To do otherwise would make the screener fairly useless. The ex-div date was the 16th, not the 15th, so a closing price of $58.12 on the 15th is correct.
If future dividends are reversed out, wouldn’t that mean that P123 is not correct in this case? Shouldn’t the 0.36 be subtracted from the unadjusted close price of 58.12 on Aug 15th (to give $57.76), given that div went ex on Aug 16th (a future dividend from Aug 15th’s perspective)?
Incidentally, it looks like Yahoo is getting this wrong as well now: http://finance.yahoo.com/quote/MSFT/history?p=MSFT. Their “Adj Close” column doesn’t show any adjustments before dividends. However they’re regular (unadjusted) “Close” column shows the same (incorrect) amount that P123 Screener shows: $58.12.
If you look at stockcharts.com, it shows the adjustment as I would expect: $58.12 - $0.36 = $57.76 (for Aug 15th).
Why would you expect to see the divided deducted from the close price on the 15th, prior to issueing the dividend? That would mean that the future dividends were not reversed out. Put yourself in the shoes of a trader on the 15th. Should he/she see a price of $58.12 or $57.76? The screener should give what the trader would see on the 15th… $58.12.
1.) As I read the documentation, it says “Price series are adjusted for dividends.” To my mind that implies that historical prices are adjusted to account for dividends.
2.) To make calculations work across ex-dividend dates (which is what I assume the point of the documentation note in #1). If I calculate the ratio close(0)/close(10) and dividend goes ex after close(5), my close-to-close total return is incorrect, unless I additionally account for the dividend amount. This rapidly becomes somewhat painful if I have to account for multiple ex-div dates (ie over a longer span of time).
When the doc states “adjusted for dividends”, I’m not sure how else to interpret that.
For some context, I worked at a large quant desk for many years and “adjusting for dividends” meant exactly what I’ve described here. So the data seems inconsistent with what the docs say. Maybe it means something else here in P123?
Does this also mean Open/High/Low/Close prices aren’t adjusted for splits either? ie, if MSFT split 2:1 after the close on Jun 15 2016 then I would see close(0)/close(1) value of 0.5 on Jun 16 2016 (assuming no other price movement from trading)?
Is there another more appropriate way to calculate the close-to-close (or open-to-open, hi-to-hi, low-to-low) total return across one or more ex-dividend and/or split dates?
I think that you are underestimating the sophistication of P123.
When P123 evaluates a price series on a specific date in history, the price used for that date is historically correct i.e. “Point in Time”. This is absolutely necessary for simulations and backtests to be useful. Imagine having a buy/sell rule such as Price >= 5. When backtesting this rule, it would be total nonsense to use this rule on an adjusted time series that has gone through share splits. The same can be said for rules involving Volume. Given your many years of experience, I’m sure that you understand this.
When you use the screener, the screen function has to operate on data that is historically correct (i.e. not adjusted data) for the date in history that you provide, otherwise the screener will give you garbage. This is a completely different situation to a stock chart, where data may be unadjusted (Yahoo charts for example), or adjusted series as stockcharts.com probably does. Reversing out future splits is not an option for charting applications because it is only valid for a single point in time.
This does not mean that dividends are not accounted for. If you review a simulation list of transactions, you will see that the dividend payments are listed. They are also accounted for with the screener backtest, and for ranking system performance.
Now this all being said, you have to be careful when using stock prices in rules. If you try to do a historical % change in price such as Close(0)/Close(200), it won’t include dividends - I believe it does adjust for splits however. If you want dividends included in he calculation then use the function TotalReturn or one of its variations.
I have an enormous amount of respect for P123, and am in no way underestimating its sophistication. It’s quite an impressive platform.
I am simply striving to clarify my understanding of these functions according to the wording of the documentation and my experience with time series and backtests in general.
And after a bit more digging, it seems Open/High/Low/Close actually do adjust for dividends and splits. It’s the screener’s historical engine that does not. ie, the screener maintains “Point in Time” characteristics using the “As Of” date, but the Close function will make an adjustment if you send it back in time w/respect to the “As Of” date.
Note the “close_1” variable (Close(1)) is the close of 1 day prior to 8/16 - ie 8/15, and it’s showing $57.76.
Now move the Point in Time one day back - before the $0.36 div - by changing “As Of” to “8/15/2016”.
Notice the “close_0” variable (Close(0), most recent close) - which is now 8/15 - is showing $58.12
The difference is $0.36 - exactly the amount of the dividend.
So, if you use Open/High/Low/Close to reach back in time, it adjusts for dividends and splits. (If you want to confirm for splits, check out NFLX around 7/15/2015, when it did a 7:1 split. You’ll see the same behavior).
This makes a lot more sense now. So a Close(0) / Close(200) would actually return the total return from 200 days ago to now.
Nice work P123! Thanks for your help Steve & Walter!
One related point to be aware of, which I think is still an issue: The win / loss statistics for closed positions can differ between a screen and a simulation or portfolio. This is because a screen will associate a dividend with its stock due to the price adjustments, giving you the total return per stock. Simulations and portfolios account for dividends in the sim or port’s total return but do not account for dividends when calculating return per stock. So a stock which is, for instance, bought for $10 per share that gives a dividend of $1, then is sold for $9.50 per share, will appear as a win in a screen and a loss in a sim or port. The average profit per trade can be understated in a sim or port as a result. And the percentage of winning trades can be understated.
This was reported some time ago by me and the response was that it was a known issue on a “to do” list, but it likely has low priority. I haven’t seen a post indicating a fix, so assume it is still an issue. Just be aware…
To make this even more confusing trade prices for portfolios are calculated as (Hi+Lo+2*Close)/4.
Simulation will use trade prices as specified, Open, Close, or Avg of(Hi+Lo).
So you will never get the same performance when a portfolio is saved as a simulation.
This is incorrect. Close(x) returns prices adjusted for future dividends. CloseExDiv(x) returns prices unadjusted for dividends.
Note that using a rule like
Close(0)>5
isn’t a problem. Because it’s looking at prices point in time, every Close(0) is unadjusted for future dividends – there is no future from the point of view of the computer.
EDIT: Which is the response for the rest of the thread, by the way. Close(0) is unadjusted for the future because there’s no future; remember, we’re always looking at everything from the point of view of the as-of date. Close(0+x) is adjusted for whatever happened between x trading days ago and “today,” meaning the as-of date.
I think the best way to think about it is that everything is always stated in terms of the as-of date. If you’re looking at MSFT with an as-of date of 8/15/2016, it’s sitting on 8/15/2016. It knows nothing about 8/16/2016 or later at all, so it’s going to express everything in 8/15/2016 terms.
So in this case, if you run it with an as-of date of 8/15/2016 when there’s an 8/16/2016 dividend, then Close(0) will equal the close on as-of 8/15/2016. If you run Close(1) on as-of 8/16/2016, then you’ll see that number less the dividend.