Hello,
I thoroughly enjoy Portfolio123 and its community and wanted to get your opinions on a strategy for the USA, and if I missed something. I am puzzled with the following strategy which is kinda disappointing for the last 1-2 years.
No buy rule, two sell rules: 1) in case of corporate action and 2) rankpos sell rule + minimum holding for tax reasons (I can remove such tax rule and get similar results) + limit of weight for one stock (which I can also remove and get similar results).
This is built on a 800+ stocks universe, microcaps with minimum and maximum liquidity and excluding usual suspects such as chinese stocks, MLPs, REITs or financials.
Classic ranking. Ranking has equal weighted categories, with components within each node equal weighted. I removed each of the node categories (sentiment, value, quality, technical, size, etc.) and I still get strong results. Factors are known. I selected what seemed to make sense and originally tested on last 10 years prior to simulating on last 25 years. I also tested the ranking system on Canada universe which seems good (without liquidity filter).
This is a 50 stocks strategy. 50 stocks in order to increase my chances of capturing outliers in live trading (indeed, last few years one stock represented a massive amount of the gains).
Even if already using 50 stocks, I used evenid to split in 2 universes and there is still outperforming on last 10 years or last 5 years (less so than if using full universe). Testing on last 3 years, EvenID=0 is giving me great results and evenId=1 market results.
Is it just bad timing or am I missing something here, as results since 01/01/2025 seem not exciting (also illustrated by rolling test)? ML causing it? Overfit?
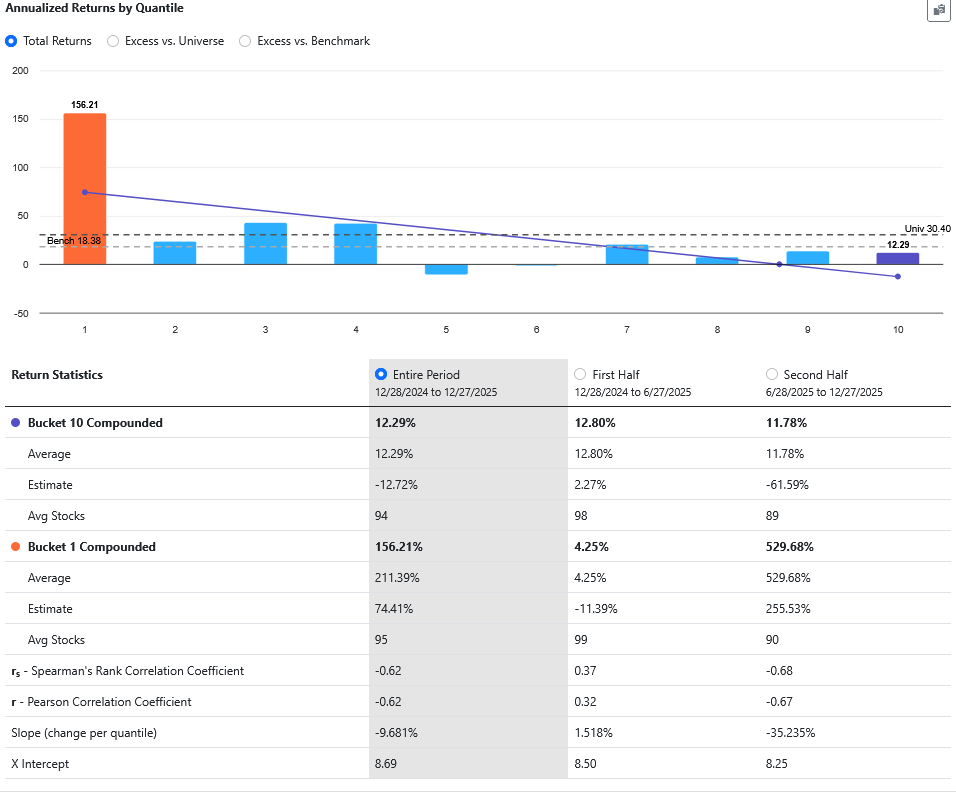
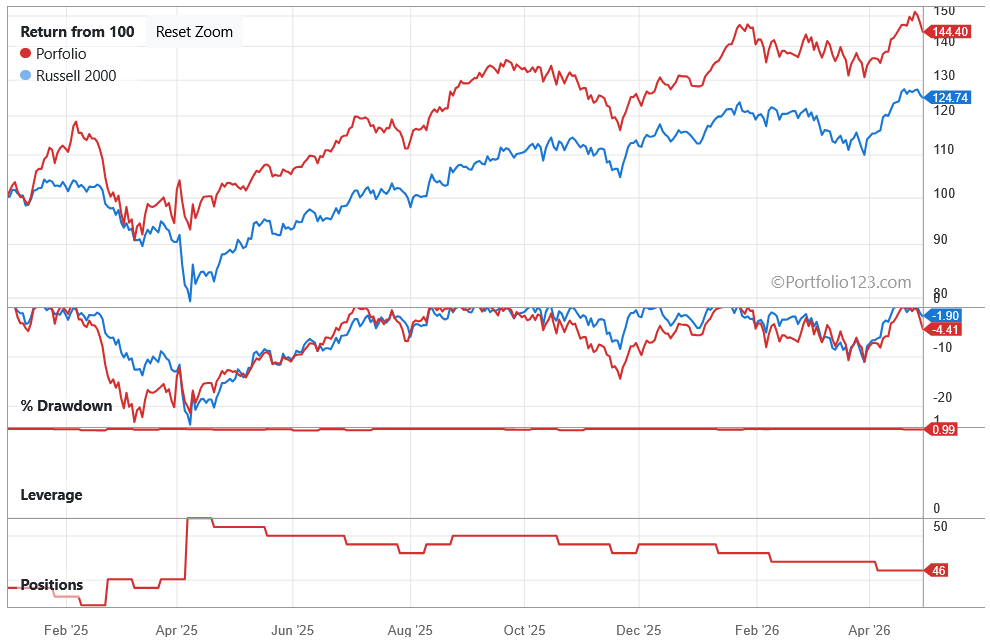
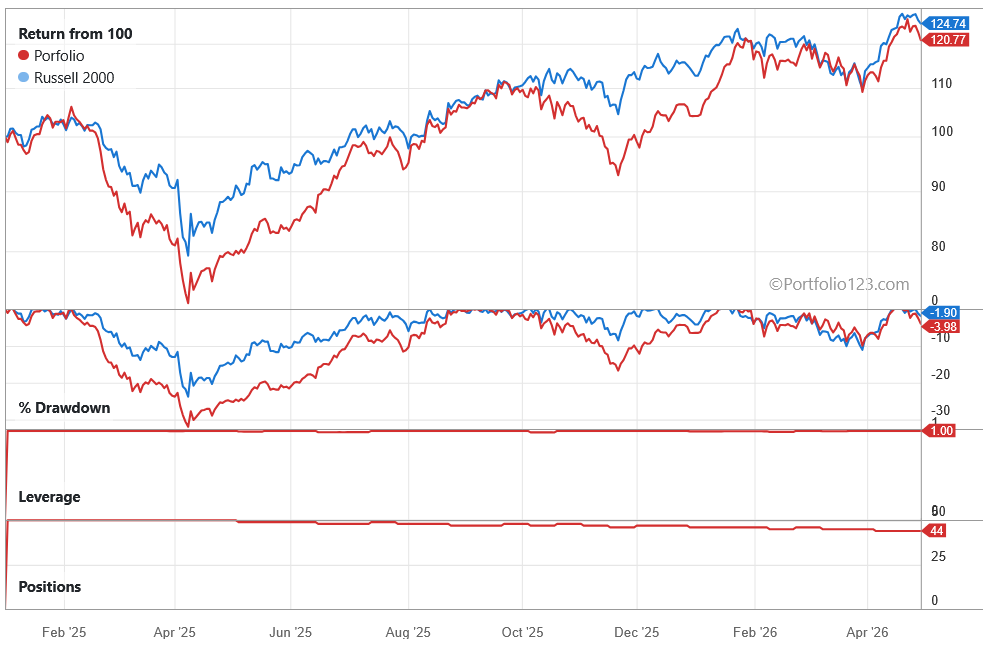
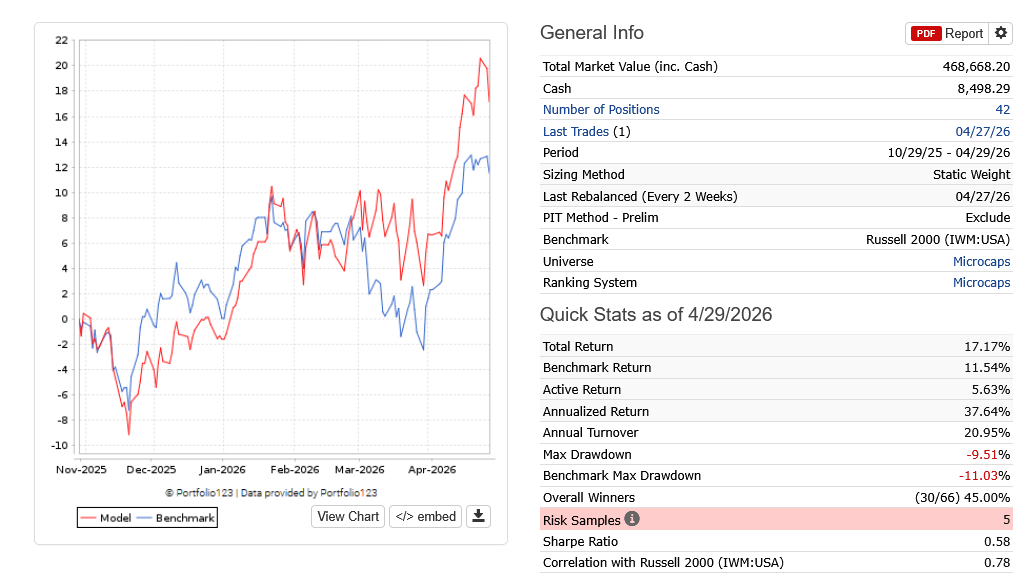
Sim results, for last 6 months
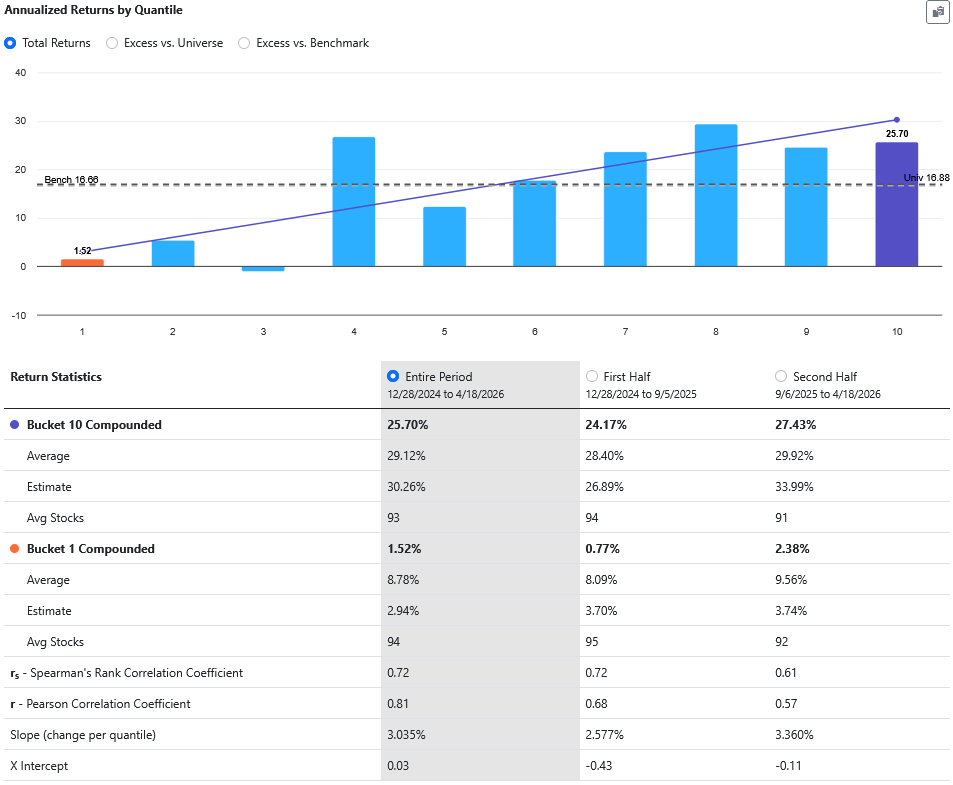
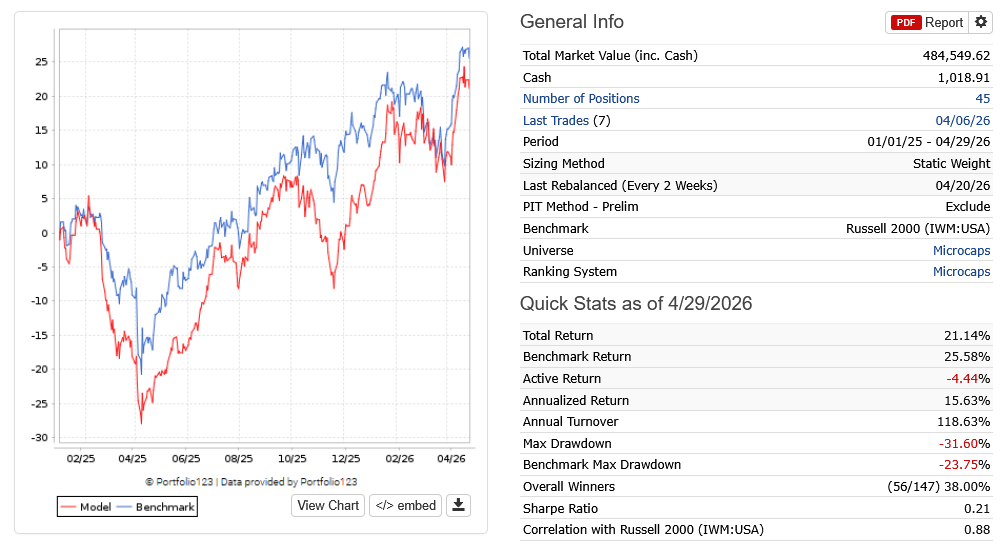
Sim results, since 01/01/2025
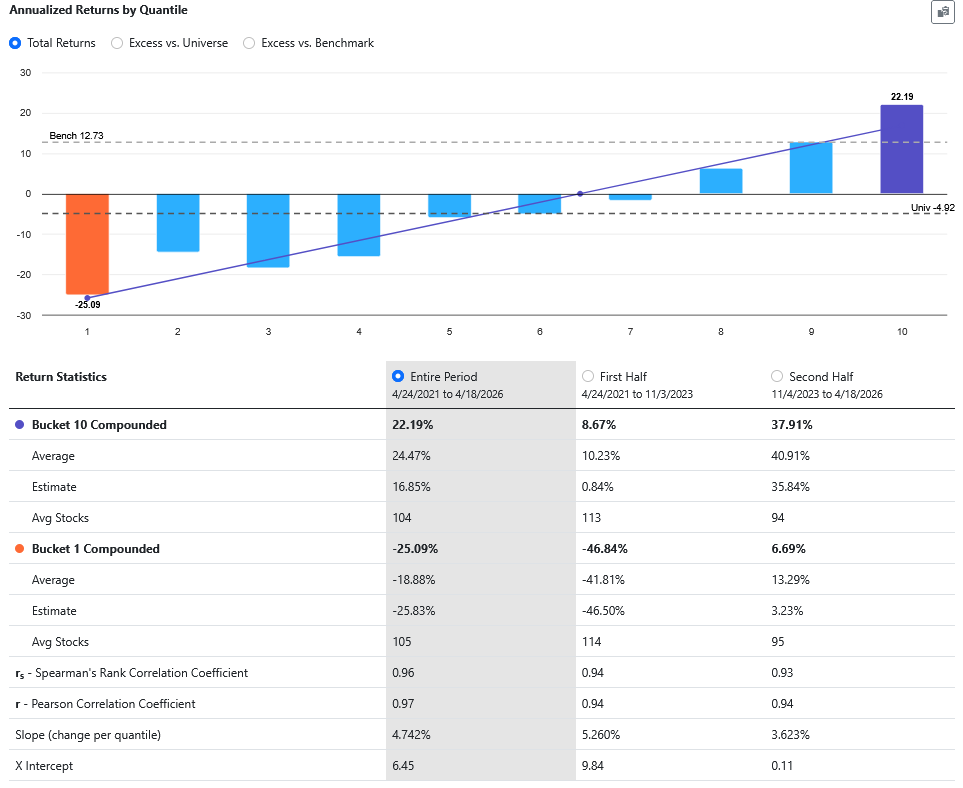
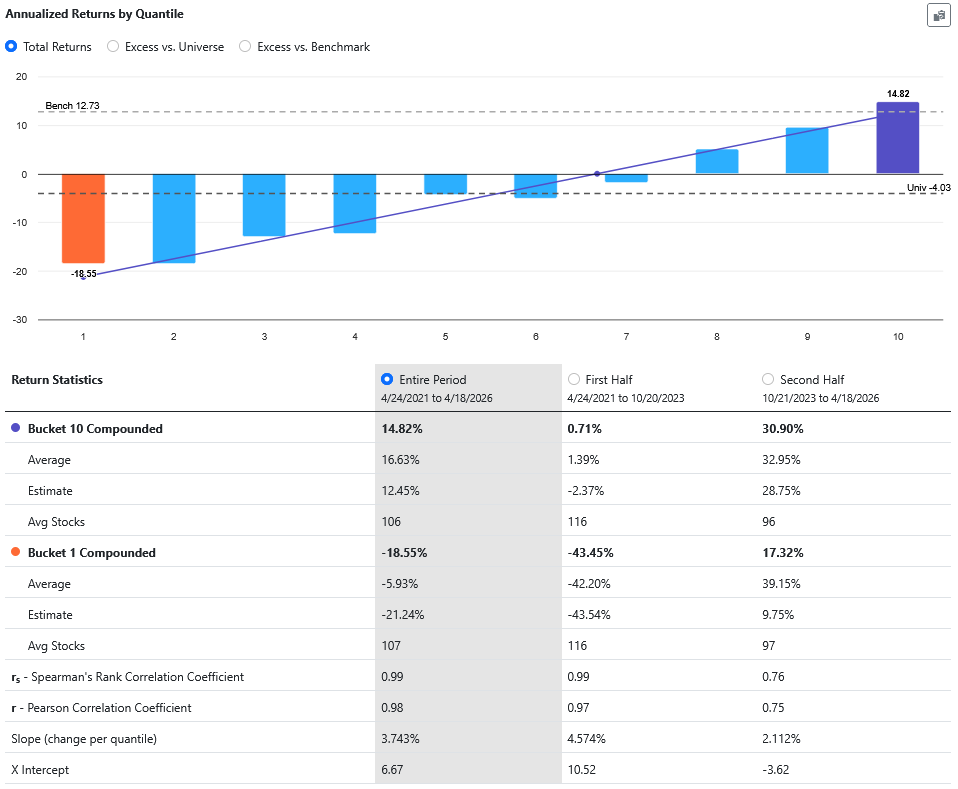
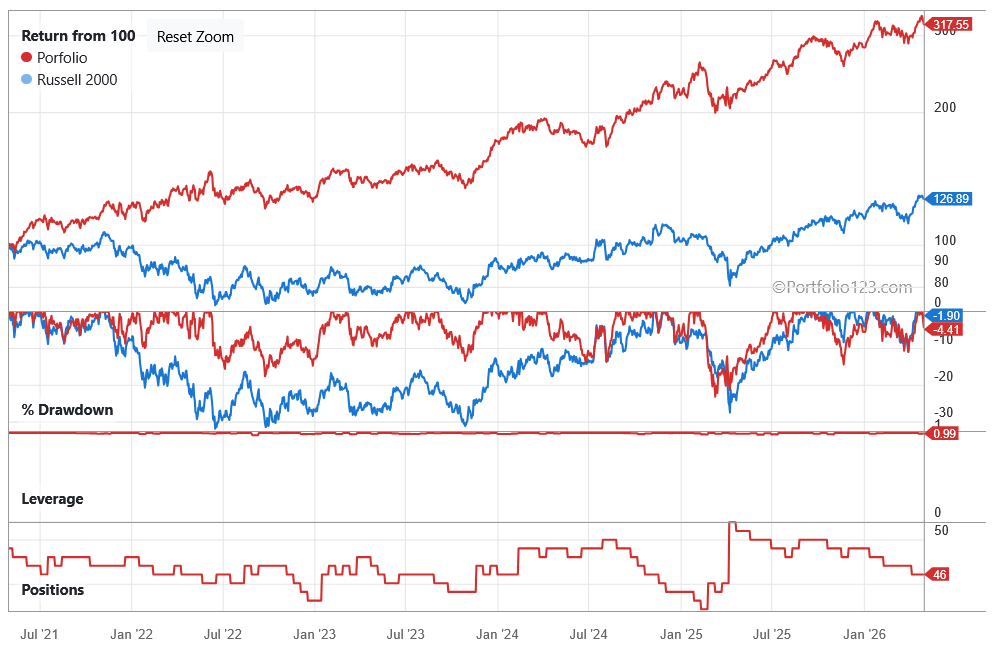
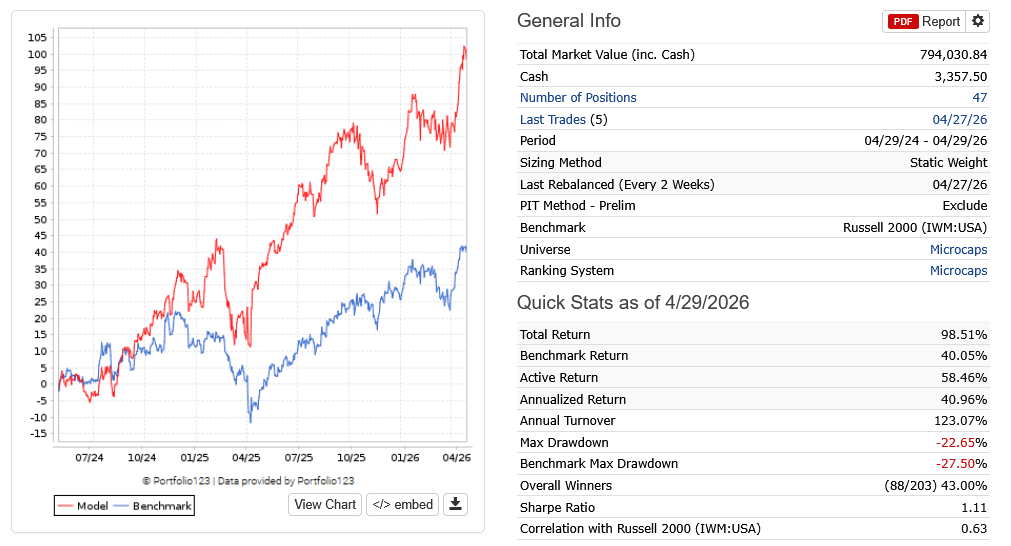
Sim results, for last 2 years
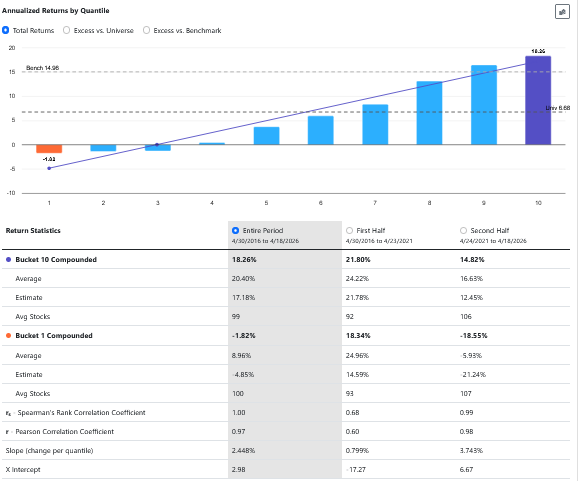
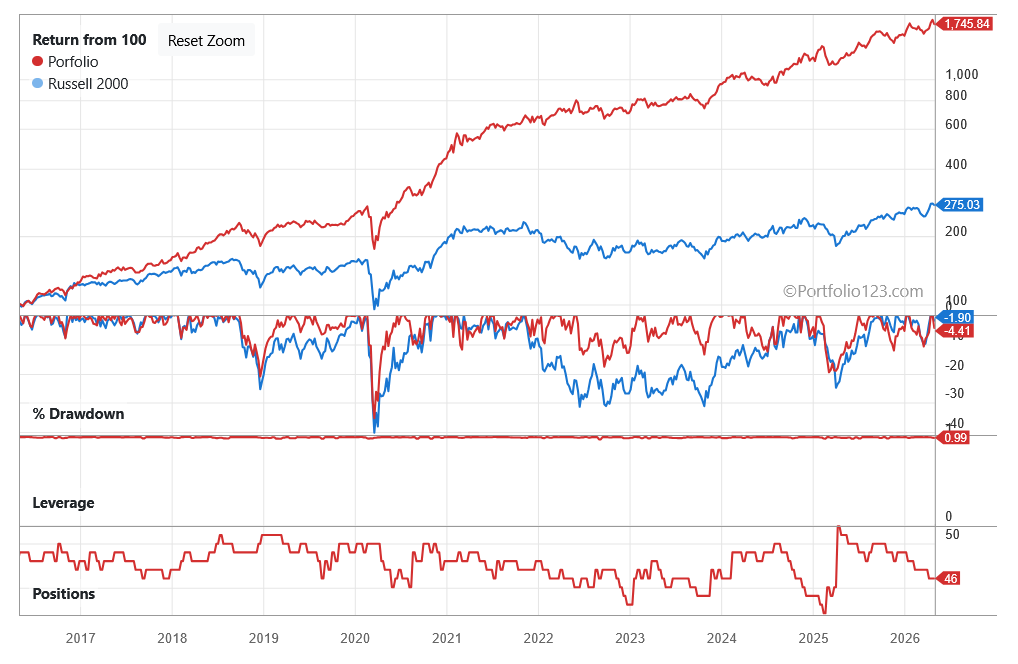
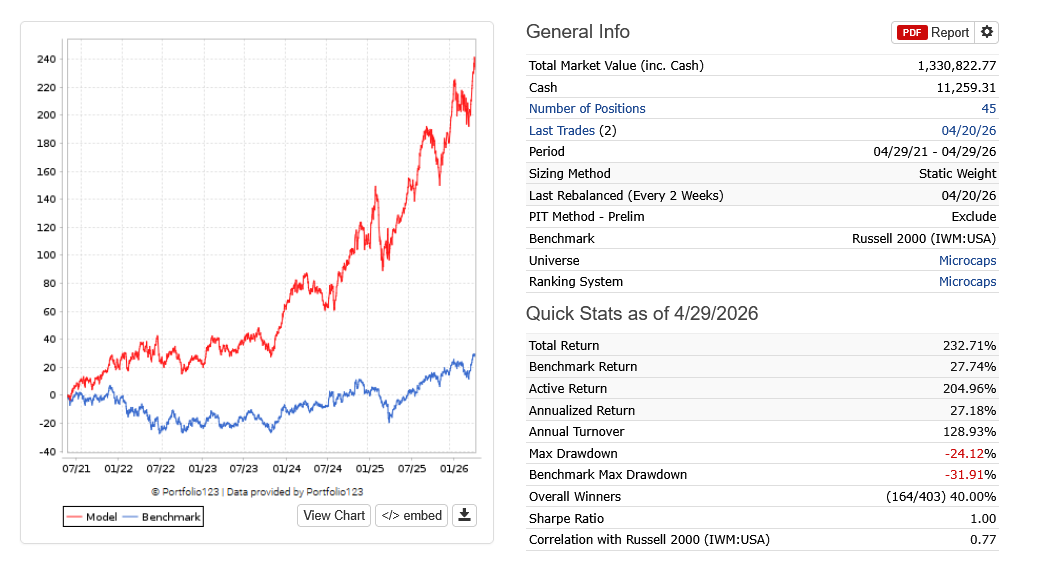
Sim results, for last 5 years
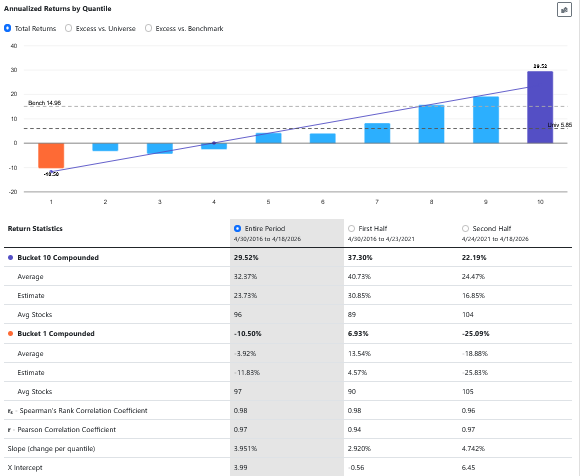
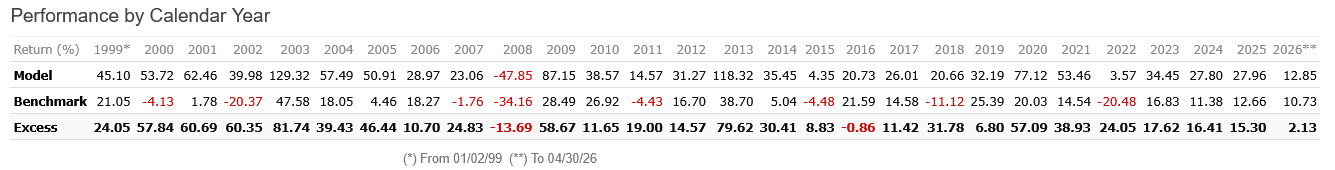
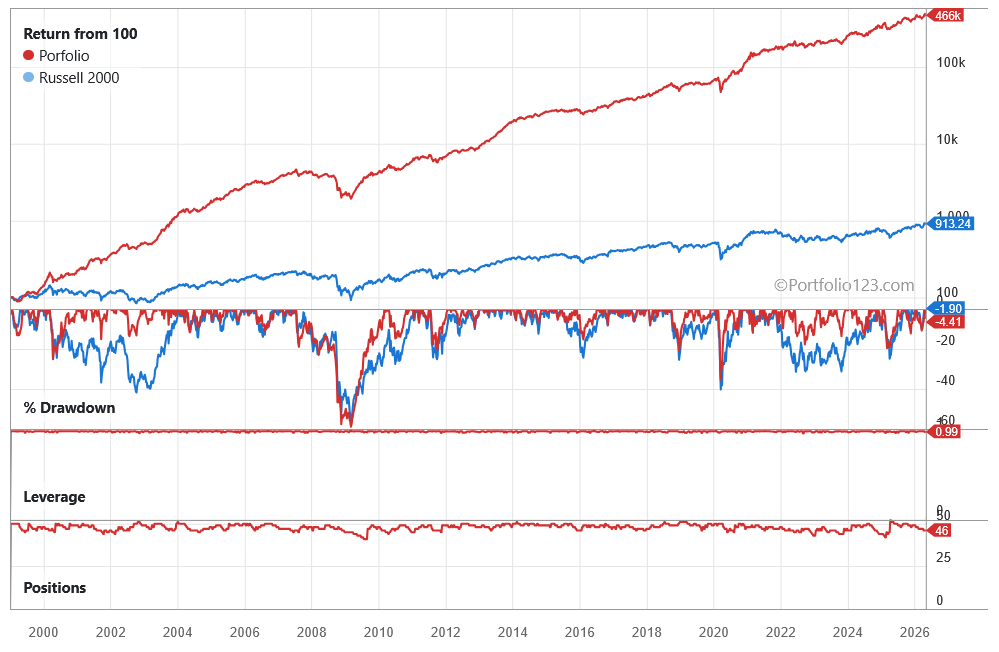
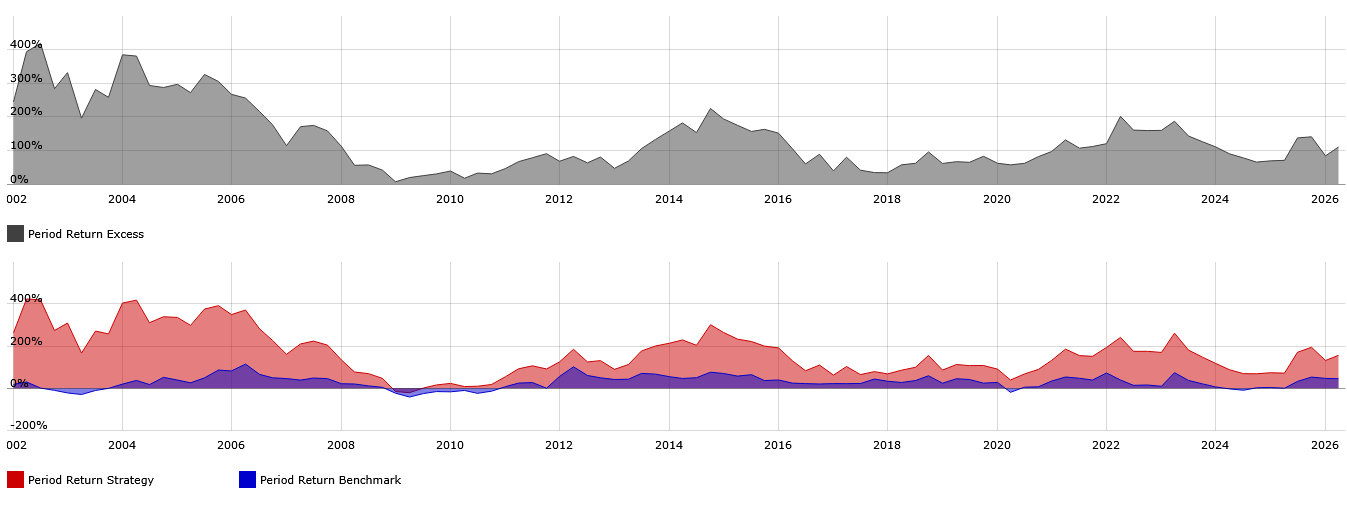
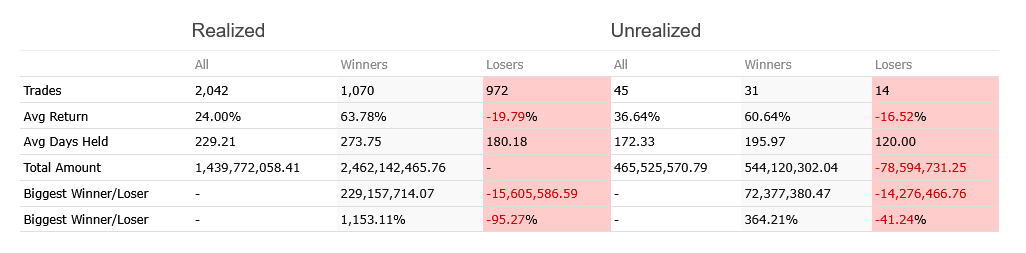
Sim results, since 1999
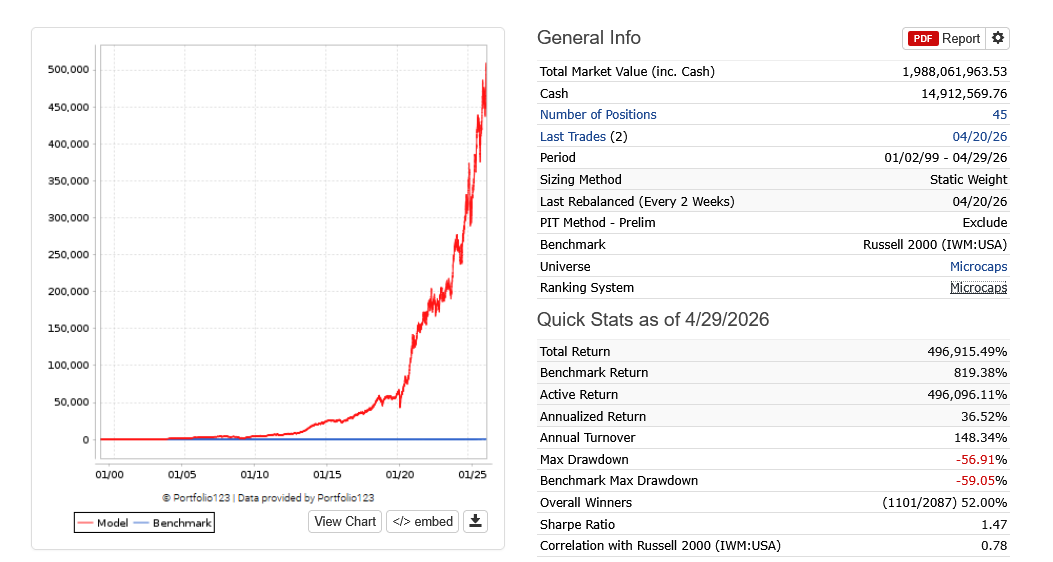
Trading since 1999
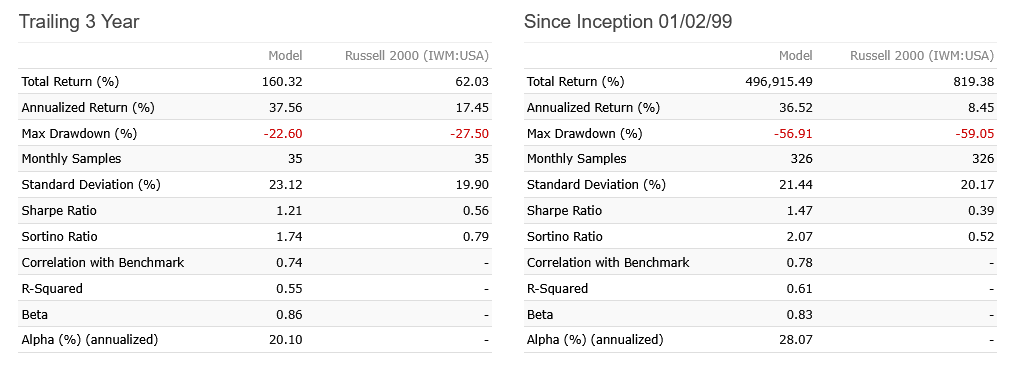
Risk measurements
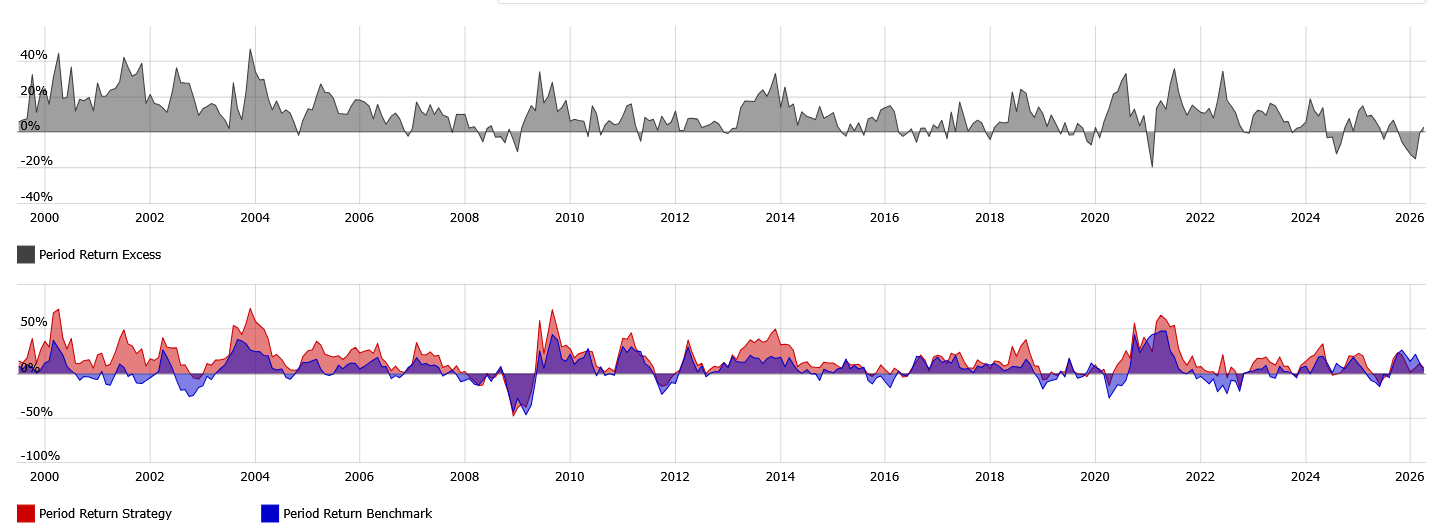
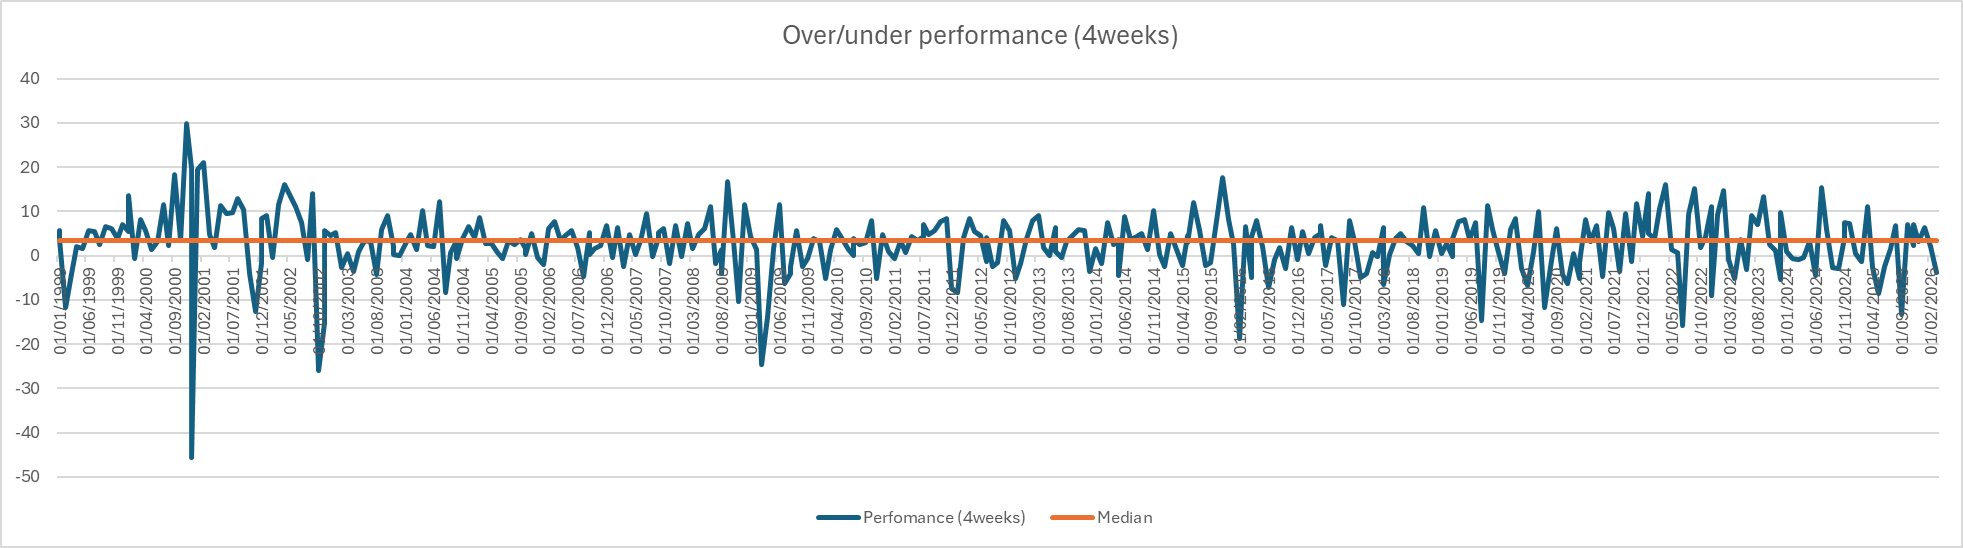
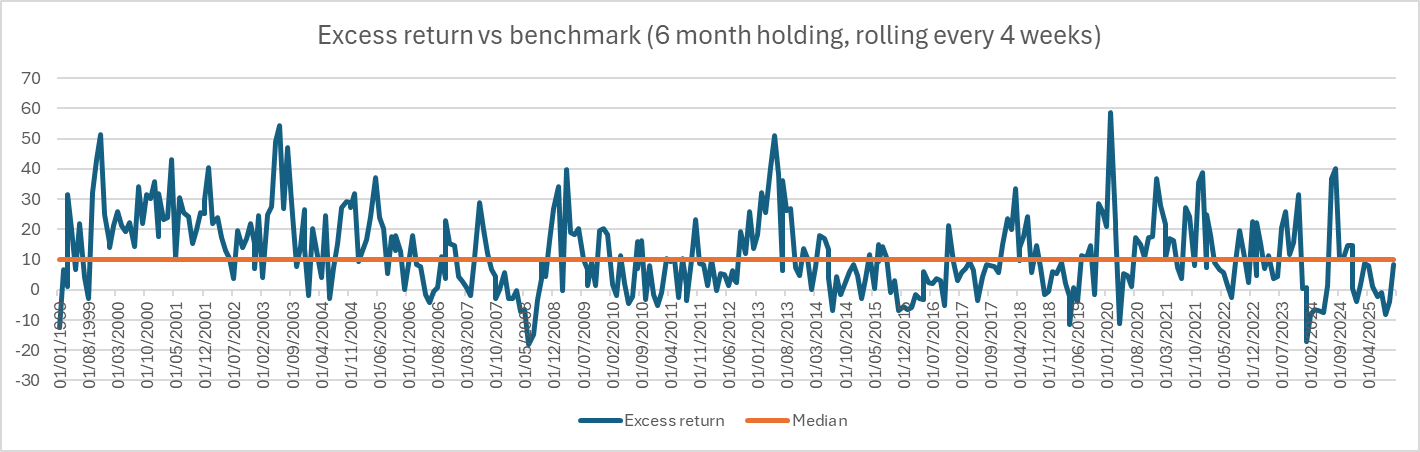
6 month holding, every month, rolling back test
(never was as bad as since 2025)