Thank you Piotr for taking your valuable time to reply. It is very helpful.
I just had a look at the average monthly returns for the S&P 500 from 1950 to 2000. I stopped at 2000 because we can run sims at P123 from 1999 onward. So here is what you would have known in 2000 to prevent survivorship bias for a P123 sim:
| Month | Actual 1950-2000 Average Return |
|---|---|
| January | 1.56% |
| February | 0.15% |
| March | 1.04% |
| April | 1.12% |
| May | 0.02% |
| June | 0.19% |
| July | 0.94% |
| August | 0.04% |
| September | -0.48% |
| October | 0.56% |
| November | 1.37% |
| December | 1.71% |
So expect a low return for May. In fact there is no point to ever stay in an S&P 500 index fund from May to October. The best months for the S&P are Nov, Dec, & Jan. (BTW. ChatGPT's data for this is incorrect.)
Check out my model "The iM Seasonal Multi-Sector Investment Strategy"
https://imarketsignals.com/2025/the-im-seasonal-multi-sector-investment-strategy/
Here is the table for Gold. The monthly performance is from 1968 to 2000. Prior to 1968 the gold price was fixed at $35. One can see that Jan and Feb are good months for Gold. Also May looks good, much better than the S&P 500.
| Month | GOLD 1968-2000 Average Return |
|---|---|
| January | 1.00% |
| February | 1.69% |
| March | -0.69% |
| April | 0.74% |
| May | 1.33% |
| June | -0.24% |
| July | 0.64% |
| August | 0.14% |
| September | 2.34% |
| October | -0.32% |
| November | 0.15% |
| December | 1.78% |
1 Like
He's a student of history, and he's been warning for a while about the coming clash with China and the demise of the American Empire. From what I can see, he's got it right, and we are headed down the tubes as the world's leading country. Just because he's seen this for a decade and has discussed it openly doesn't mean it is market advice for the coming week. He's talking in terms of decades and centuries, but what he's been warning about may be coming to fruition in 2025.
I read his book. Very interesting.
But anyone that followed his doom and gloom advice 15 years ago would have missed out, big time.
There is a 100% chance that the US and its currency will eventually collapse: this year, in 10 years, in 1000 years?
But trying to time that is pointless IMO. I suspect every member here feels the same, or they would not be here.
Tony
1 Like
Pitmaster,
Since you have a PhD in Machine Learning, I am interested to know what you think about something that was mentioned in this article (re-post from above) published by CAIA,
"And there is, in fact, considerable reason to believe that virtually all linear regression-based studies in the investment finance field are wrong.1"
1 See “Alphas and the Choice of Rate of Return in Regressions”; Edhec-Risk Institute Research Insights, June 2014.
Should we put more focus on non-linear regression instead for future P123 enhancements?
Thanks for sharing your view in advance.
Regards
James
Edesess makes a good argument in favor of modifying how we measure alpha. I like his idea a lot. Basically, when we measure alpha, we use straight linear regression and capture the y-intercept. Edesess proposes that we first transform both the portfolio and the benchmark returns by using the logarithm of the return plus one. This relatively simple transformation significantly improves the regression results. I don't know that I would call it very non-linear, though.
For example, here's a linear regression run on a leveraged portfolio using monthly returns.
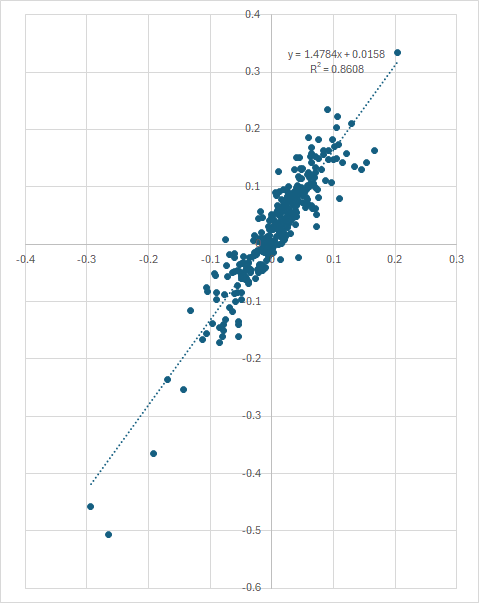
Now here's the same data but using logarithmic returns as Edesess suggested:
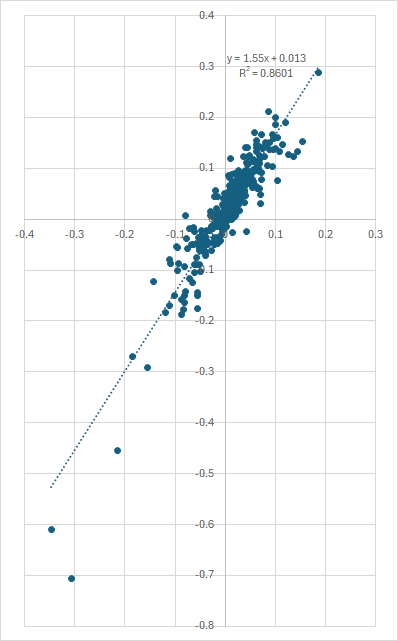
You can draw your own conclusions here . . .
1 Like
I think linear models can work quite well—when the data is actually linear. Yuval makes an excellent point: transformations (log-transformation in this case) can sometimes convert non-linear relationships into linear ones. But that’s just the beginning of what’s possible with P123.
P123 Classic already functions somewhat like a non-parametric regression—essentially a rank-based or ordinal approach. By ranking both predictors and the target, it naturally reduces sensitivity to outliers and avoids assumptions about the data’s distribution.
Whoever designed the original P123 Classic framework was clearly sophisticated. It’s an elegant system. The real challenge today is how best to optimize the rank weights—and whether that process can be effectively automated.
Even if you don’t fully accept the analogy to non-parametric or ordinal regression, I doubt anyone would describe the Classic model as strictly linear.
Now, with the AI/ML module, we have access to far more powerful non-linear methods (e.g., LightGBM), along with both parametric and non-parametric feature normalization options.
—
So what’s the practical takeaway?
Log-transforming data before applying z-score normalization— especially since returns are often modeled as log-normal --might be worth exploring. That said, in most cases, the impact may be minor. And when using ranks as predictors—or tree-based models like LightGBM—these transformations are irrelevant.
Still, it’s a simple and worthwhile experiment for P123 to test—especially since the suggestion came from a P123 staff member on what is now a truly advanced AI/ML platform.
In any case, whether your data is linear or non-linear, P123 already offers a flexible and powerful toolkit for tackling both.
1 Like
Hi Yuval,
I'm having trouble understanding your post and hope you can explain a little more. What are the two axis labels here? The fit for these does not seems significantly different. R2 for both regressions are the same?
Thanks
The y-axis is the portfolio return and the x-axis is the benchmark return. The R2 for both regressions is indeed very close because log-transformation doesn't alter small returns a huge amount. Between -20% and 20% log-transformation makes very little difference.
1 Like
I apologize for getting your PhD wrong, it should be PhD in Applied Econometrics and not PhD in Machine Learning (from the Linkedin page you put on the forum before).
In case you have missed it, I have copied my earlier post, pls kindly share with us your opinion about Edesess's point about linear regression/non-linear regression.
Thanks again for your help.
Regards
James
Hi James,
Thank you for posting the article from EDHEC-Risk. Unfortunately, it is no longer available.
The CAIA article doesn’t delve much into econometrics—it mainly critiques the Bridgewater fund for charging high fees while delivering disappointing results.
By the way, May just ended, and SPY returned +6.28%.
2 Likes
Pitmaster,
Here is the paper.
Pls take a look and comment if you have time.
Many thanks.
Regards
James
Alphas and the Choice of Rate of Return in Regressions
papers.pdf (189.1 KB)
Hi James, Thank you for uploading this paper.
Right, continuously-compounded excess returns seems to better suit as a target for OLS regression. This choice helps ensure that beta estimates are statistically meaningful and not merely spurious artifacts of skewed or heavy-tailed return distributions.
However, I adopt a different approach. I develop models for distinct market segments locally in Python, and the choice and design of the target variable depends on several factors. I do not use machine learning, OLS, or complex weight optimization techniques. Instead, I rely on a relatively simple but direct optimization process. I focus more on feature engineering, and economic intuition rather than finding precise weights.
I often use a winsorized average of multiple future return periods, normalized to a common time horizon. This helps reduce the influence of outliers, improves robustness across different forecast horizons, and maintains alignment with the primary objective: maximizing long-term CAGR.