Getting back to the point of this thread–ranking systems–I’ve designed one that I hope will work for large caps in the future, though of course I have no assurance that it will. If you do a performance test over the last ten years, rebalancing monthly, the top decile of the S&P 500 gets a CAGR of about 20%. If you do a simulation buying the top 20 stocks in the S&P 500 and holding them until they are no longer in the top 50, also rebalancing monthly, you also get a CAGR of about 20% over the last ten years, with about 1.15X turnover. If you run this on some of the bigger universes than the S&P 500, the results are generally better.
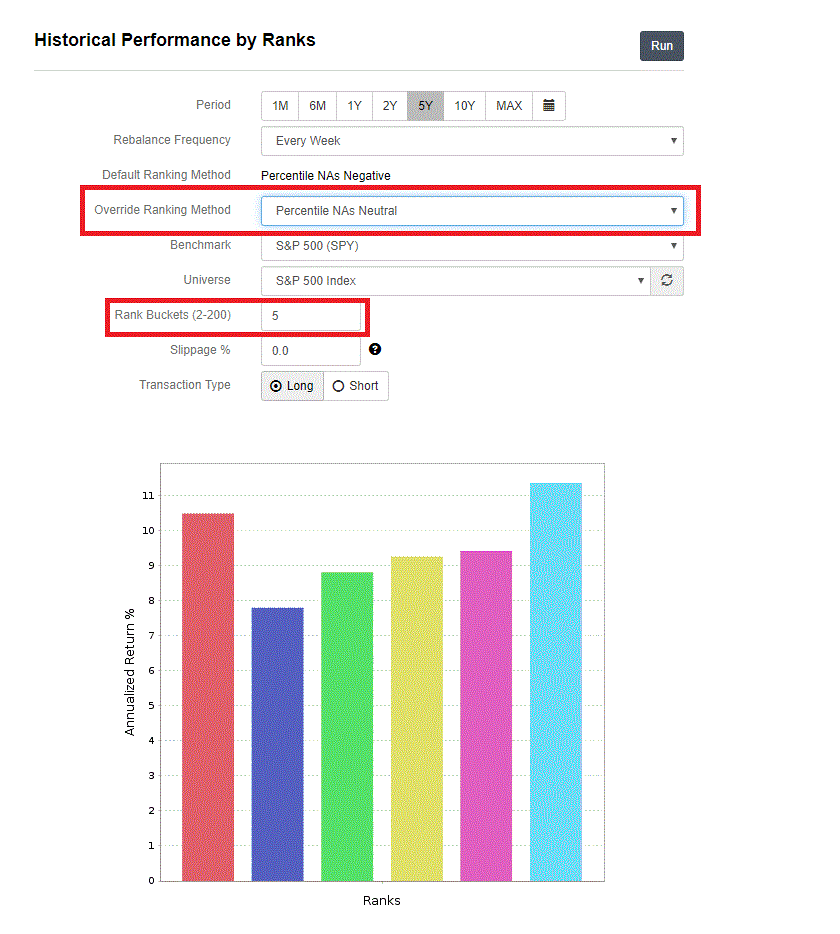
The ranking system is here: https://www.portfolio123.com/app/ranking-system/352291 and it’s public. Please note: you MUST use NAs neutral with this system because that’s the way I designed one of the factors (R&D to market cap). A lot of industries don’t report R&D expenses, and I don’t want them to suffer unduly because of that. The simulation is also public: https://www.portfolio123.com/port_summary.jsp?portid=1572963. Check out the holdings. This simulation has held Home Depot for almost eight years so far.
I’ll just explain a few things about the system.
There are four growth nodes, at 5% each, and four value nodes, also at 5% each. Most of the ranking depends on quality (40%), though I also have one size, one sentiment, and one technical node.
To measure growth, I take the current figure, subtract an equivalent from a year ago, and divide by the latter; however, I add “max(n, abs(” before the denominator to eliminate the chance of dividing by zero, a tiny number, or a negative number.
To calculate actual earnings, I subtract 80% of special items. If you don’t want to do this, you can eliminate that part of the formula.
I use different formulae for free cash flow and for enterprise value than the P123 standard. I like to include acquisitions and divestitures in free cash flow, and I like to give a minimum value to negative-EV companies. Also, all my value ratios use fully diluted shares. So you’ll see those differences in my formulae.
There’s one ratio here which is completely original to me, and which I believe nobody has ever used before. Can you guess which one it is? You may want to discard that one since no professors or investors have actually tested it. I like it, though.
I turned all the value ratios on their heads, with price in the denominator. You can reverse me if you’re used to doing things the other way. I like to think of value as a kind of yield.
I designed this as a basis for you to play around with. I think you could add a lot of other factors and get better and more robust results. You could also eliminate factors that you have no use for or think are just too weird. But maybe this is a good start in terms of how to think about evaluating large caps.
I’ve always believed that success comes to those who dare to be different. That’s what I’ve done with this system. But it’s not difference for difference’s sake. It’s difference because using tried and true metrics no longer works terribly well for companies that are analyzed to death, like those in the S&P 500.