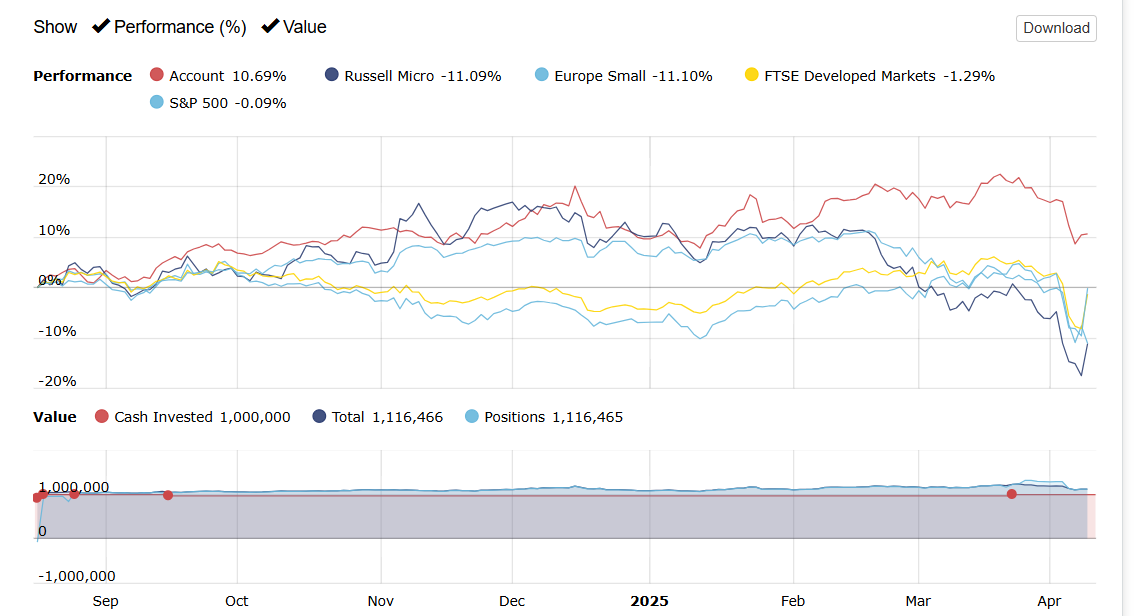
I recently utilized the system's default Core System strategy on a demo account and found that you can beat the market with an extremely simple default strategy.
And, I use the European Core Combination for European markets and the default Core Combination for North American markets. not tied to market picks.
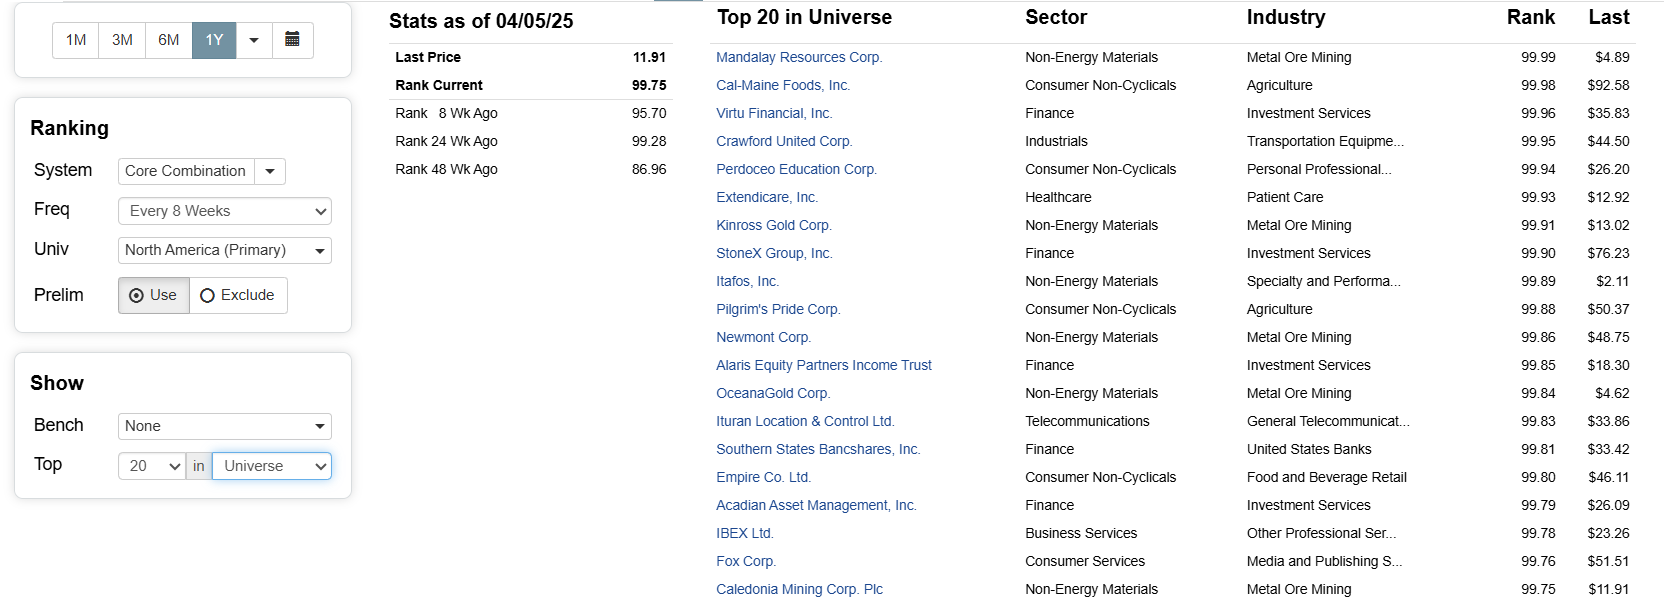
The rule is to select stocks that appear in the top 20 in the universe at the time and have a market capitalization of less than $300 million (the upper limit of the microcap universe), but still have enough liquidity to trade. If those stocks fail out of the top 40, I will sell them.
I didn't even operate this demo account for a couple of months (mid-October 2024 to mid-March 2025) and still beat the market. Even though I didn't fully account for my trading costs, when accounted for, this is still a good enough result.
In short, factor investing doesn't require uniqueness, cleverness, and effort to succeed. It only needs the "low-hanging fruit" of the past and "simple screening factors" to be good enough, without needing to rely on innovation that “may or may not work out”.
The last of these factors, if inverted (favoring lower coskewness with the VIX, longer term), seems to be quite effective. But I don't understand it. Could one of you perhaps explain it to me? I'm pretty new to the whole concept of skewness, kurtosis, and coskewness. When I asked ChatGPT, it replied,
High negative coskewness with the VIX
The asset tends to have extreme negative returns when the VIX spikes.
That is: when fear and volatility increase, this asset may plunge.
Implication: This asset is exposed to tail risk and performs poorly during market stress.
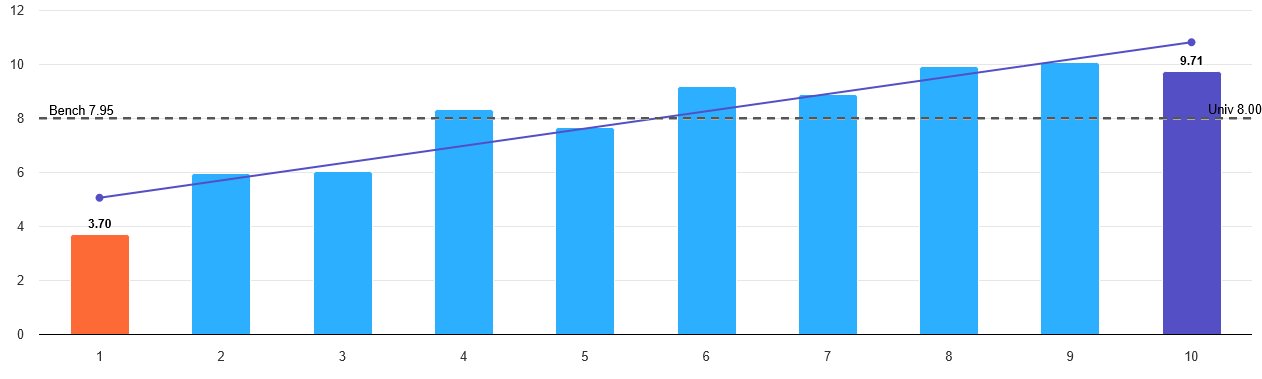
But a performance chart (with this one factor, lower better) shows that stocks with a very negative coskewness with the VIX outperform stocks with a high coskewness by leaps and bounds:
Edit: I just notice that the outperformance was particularly pronounced during 2003, 2009, and 2020, all periods when the VIX really spiked. So I'm guessing the outperformance is because these stocks got really cheap during the downturn and massively outperformed during the recoveries. Maybe?
This metric is new to me too—but really interesting observation, and I think you must be onto something.
When I look at the equation, I interpret it like this:
Stocks with high negative coskewness with market volatility tend to experience outsized drawdowns when market volatility spikes. That is, their worst returns tend to coincide with moments of market-wide stress.
So if the stock drops disproportionately during a volatility spike—but not because of something fundamentally wrong with the company—then once the volatility passes, you might expect mean reversion.
Of course, sometimes the stock’s decline is justified. For example, in today’s market, it could be hit by volatility and exposure to something like Chinese imports. But in general, high negative coskew with market volatility may highlight stocks that fell hard during a panic and are now poised to rebound.
It could be useful when paired with:
Quality metrics, to rule out broken businesses.
A timing condition, like volatility subsiding, to avoid stepping in early (during the early portion of the drawdown).
If so, maybe this factor helps build a “bounce-back” model. Working title if it ever becomes a designer model?
Who Says I Can’t Catch a Falling Knife?
Just a guess based on what the math and your sim seems to be saying. I'll be interested in what you find if you pursue this further.
I’d love to explore topics like skewness and coskewness more too, but running the factor formulas for it takes such a long time with the custom formulas we have currently.
I would be especially interested to understand how low volatility and low coskewness relate as factors. Both seem to work individually, but that seems contradicting at first sight: companies with low price movements outperform on average, but so do stocks that drop a lot in value when the market (or vix) is volatile.
Seems true. Pitmaster's formulas in his ranking system never finished running or I closed the computer before seeing the results for sure. I am not very patient though.
You should test it on smaller universe or/and use shorter lookback period to get faster results.
I experimented with these formulas and did not find any interesting results. They neither decrease volatility or increase return on systematic basis. They seem to work better on bigger caps.
One may experiment with some variations:
cosk(20) - cosk(100) (difference between short and long cosk)
abs( 70 - FRank("cosk") and lower values (prefer mild values)
Eval(FRank("cosk") >=50, FRank("cosk"),100-FRank("cosk")) and lower values (prefer either higher or lower)
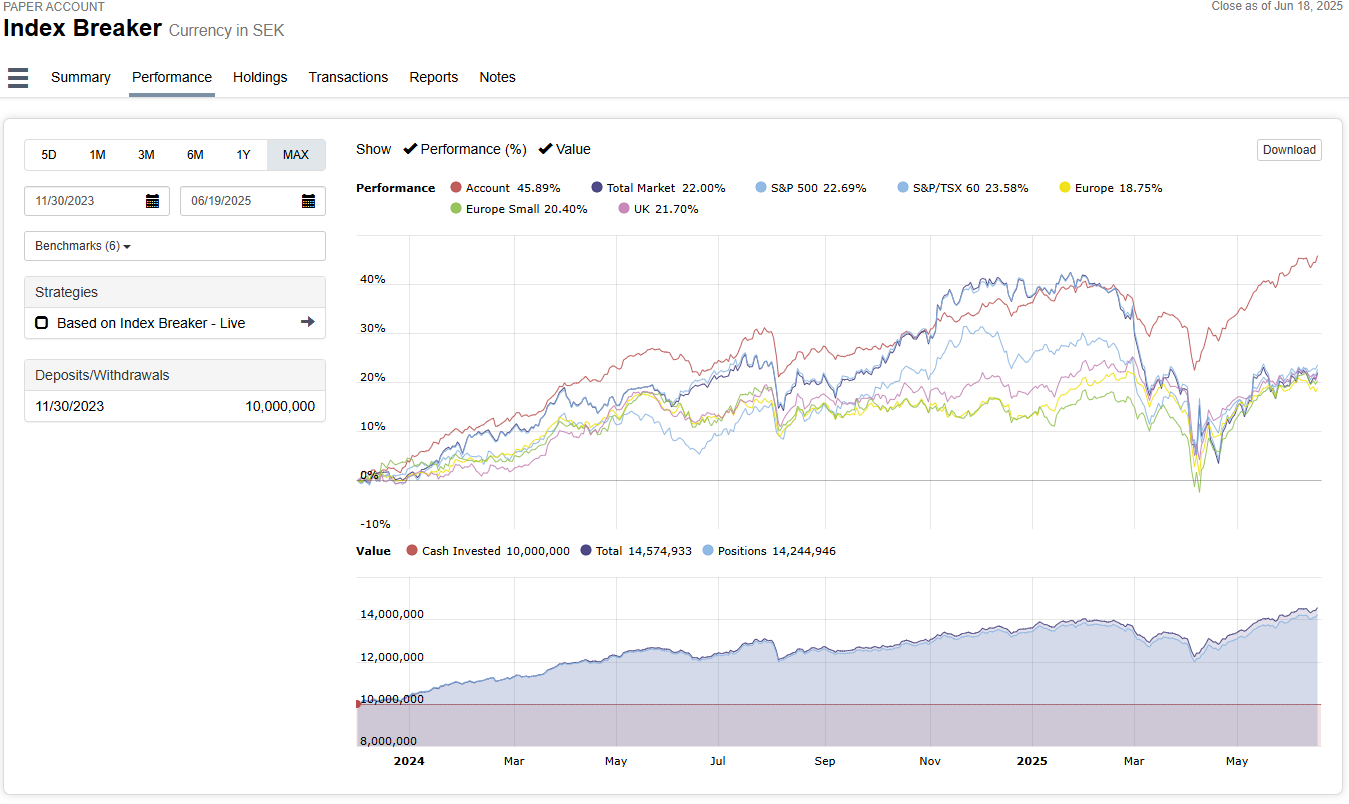
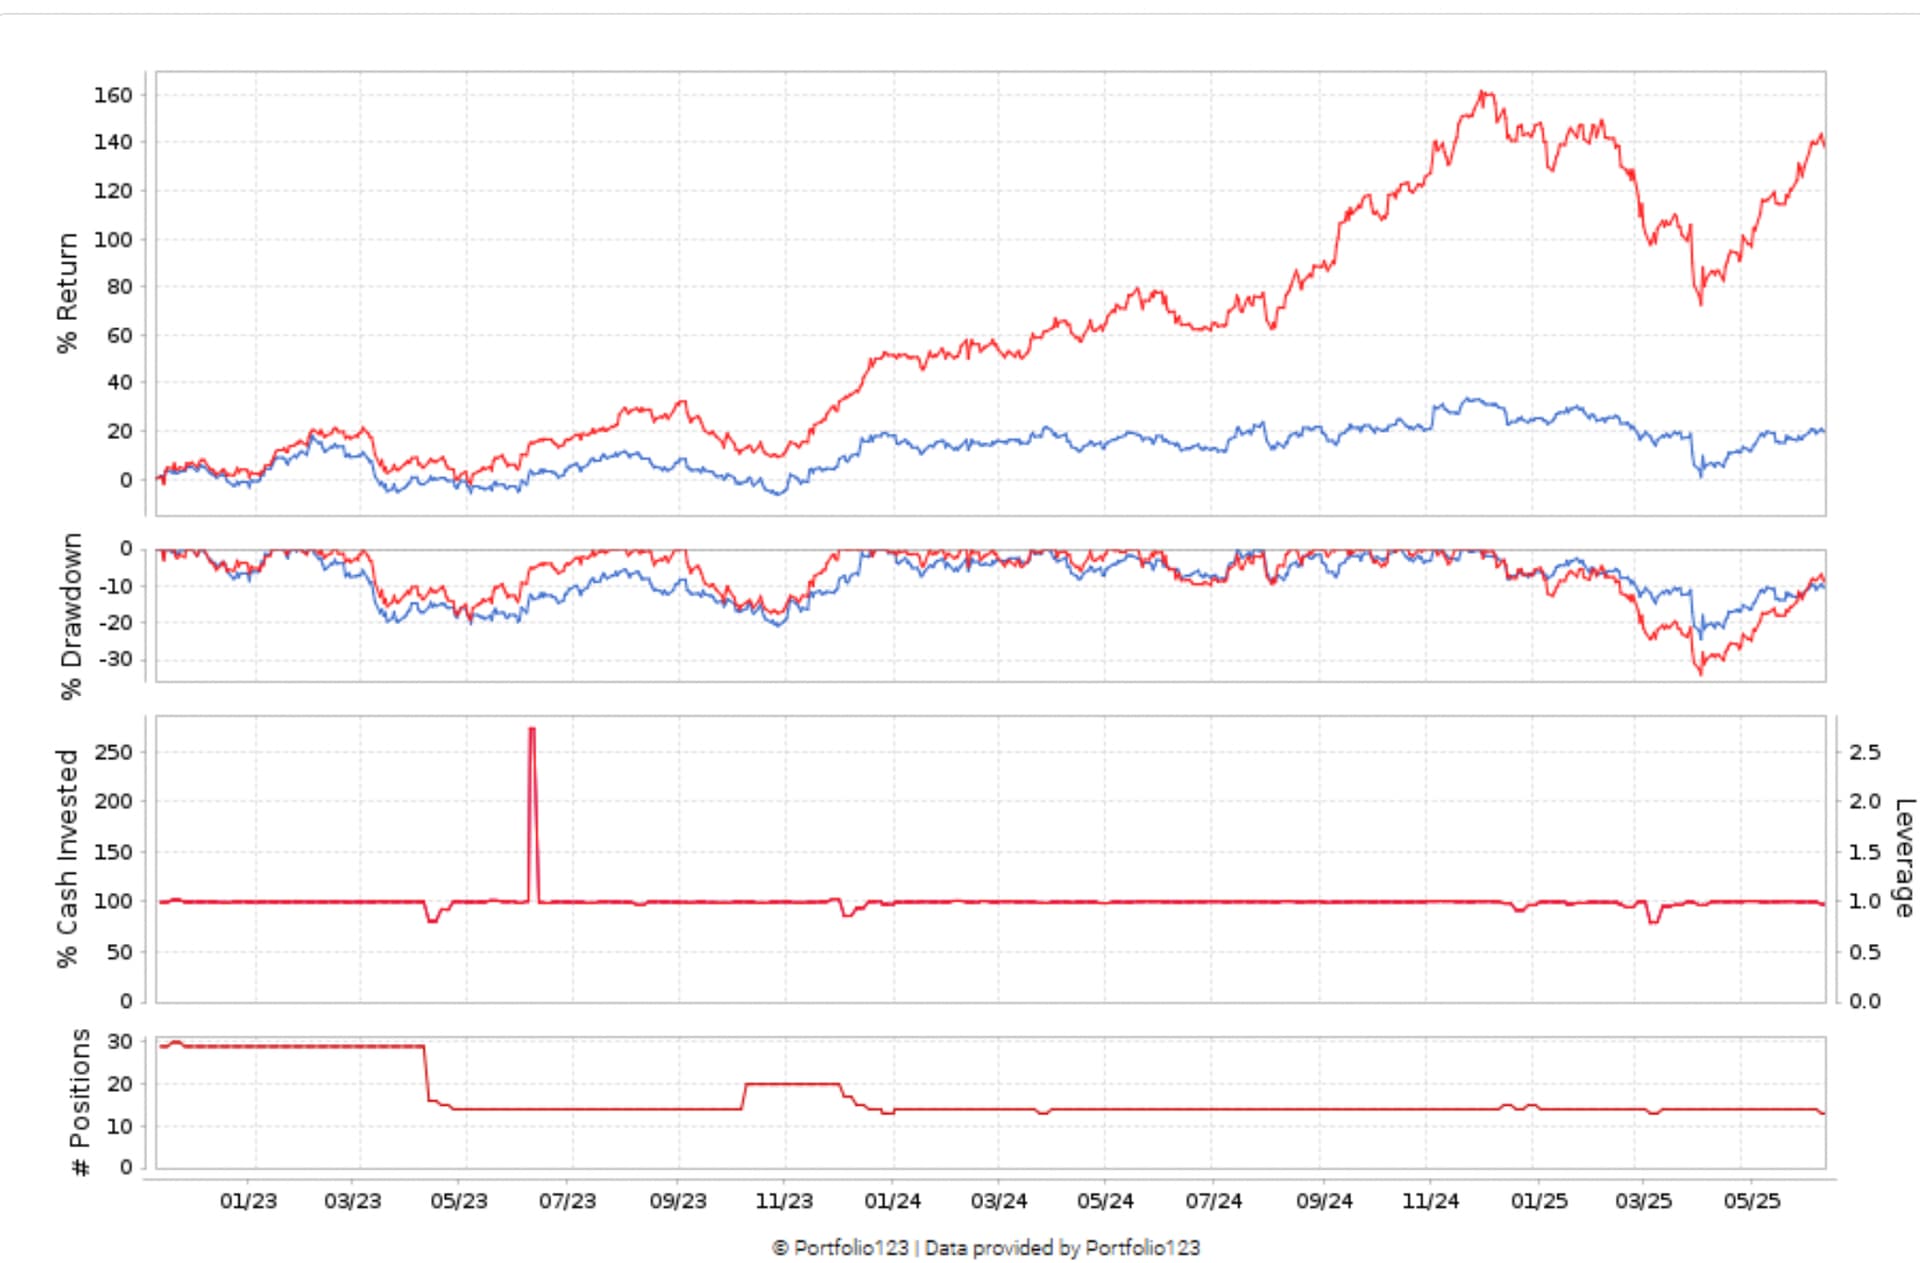
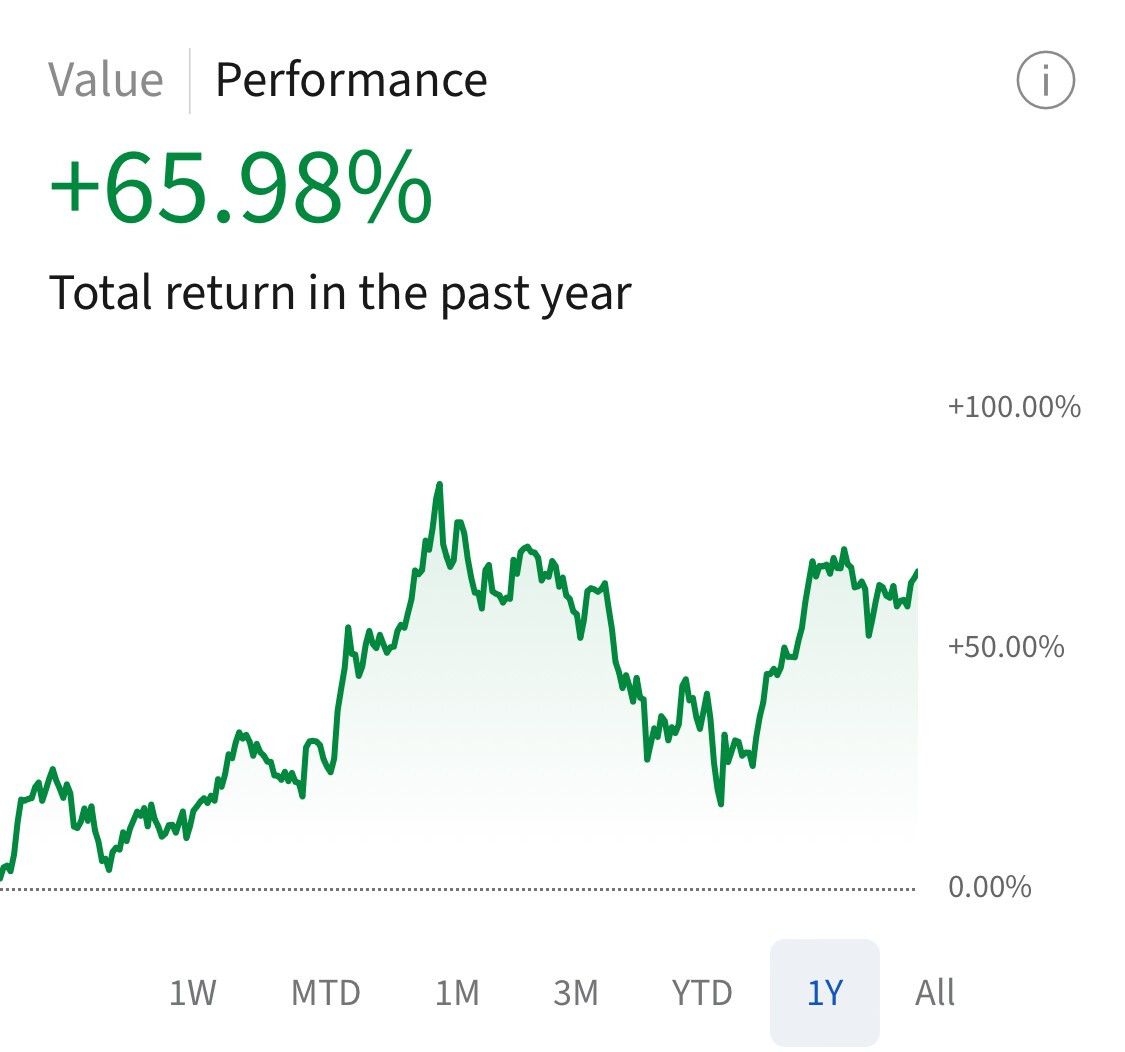
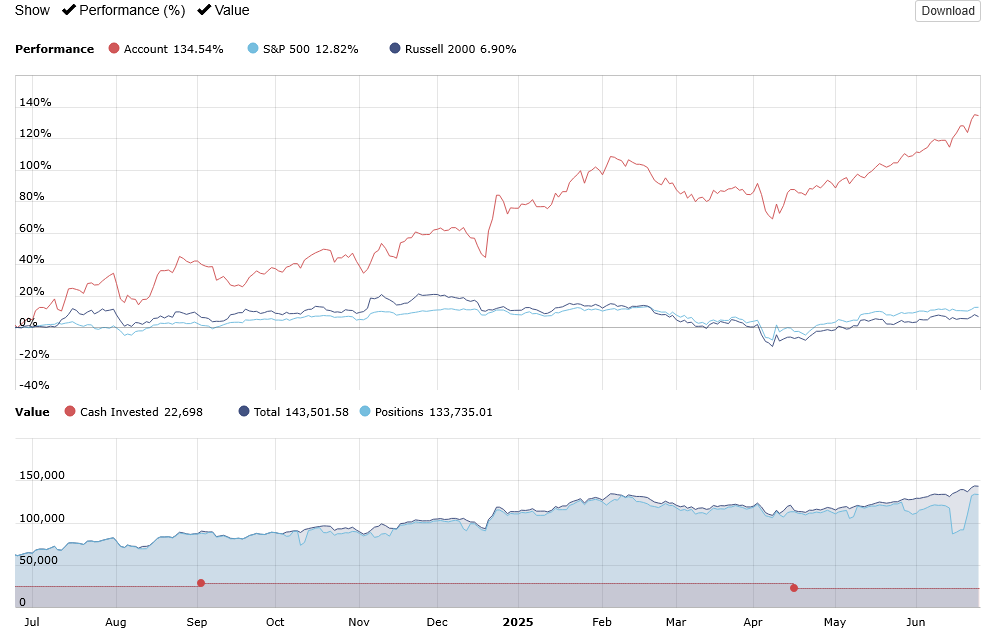
Just want to share results from a simple strategy I have keept alive on a paper live account. It's mainly based on the "Core Combination" Ranking system with a size factor and trades the "Easy to Trade North Atlantic" Universe and hold 500stocks. Last few month it has taken off, to me that indicates that we are in a period where factor investing is favourable.
We had a delay because we needed ETF constituent data
Why would you need ETF constituent data for a risk model? Can't you use historical RBICS classifications instead?
Guess the answer depends on what's going into your risk model. If it's industry factors only, seems like RBICS is all you need. Any information you can share on what type of risk model you're building would be appreciated.