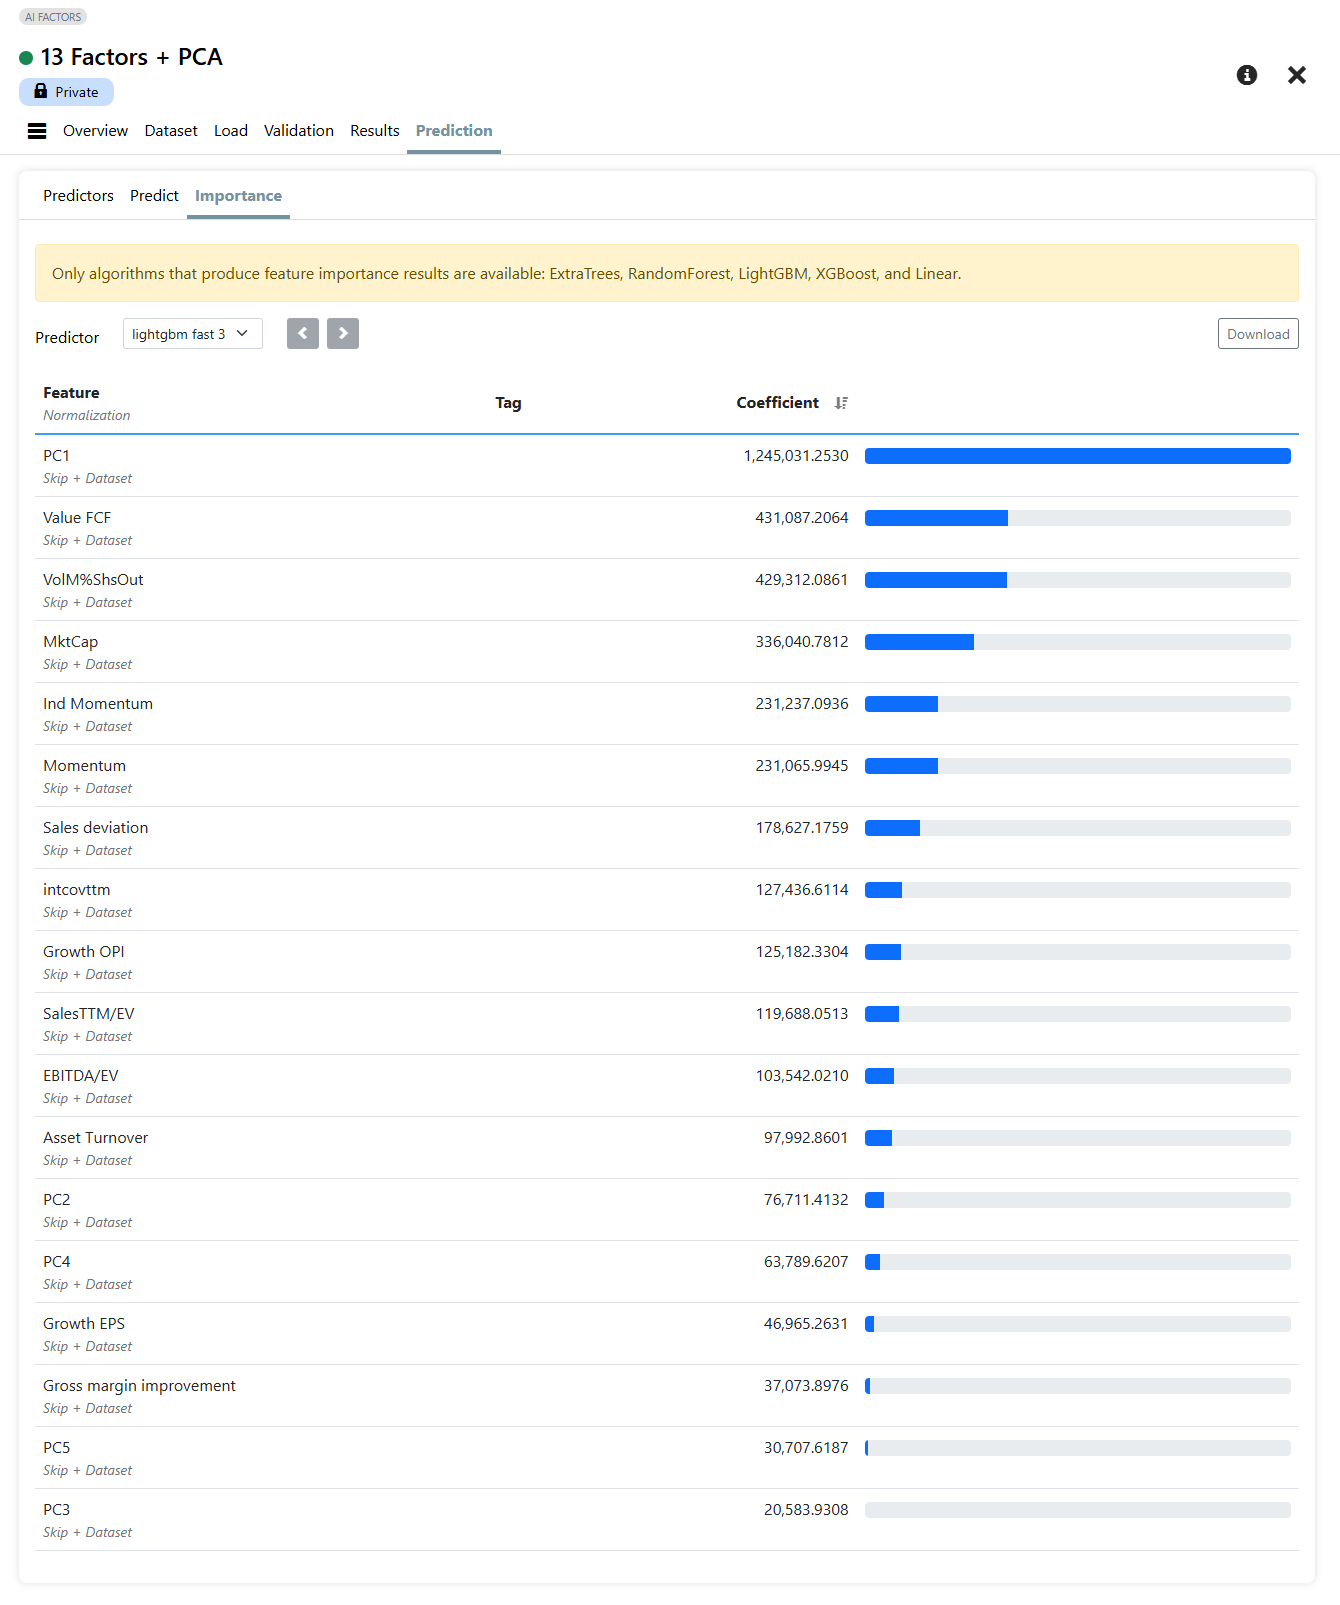
@Scifospace came with a brilliant idea to break down the result from a Principal Component Analysis (PCA) Components to new factors for P123.
While PCA is excellent for uncovering the "true" underlying drivers of stock returns by reducing multicollinearity and distilling correlated factors into independent components, translating the math into Portfolio123 formulas is incredibly tedious.
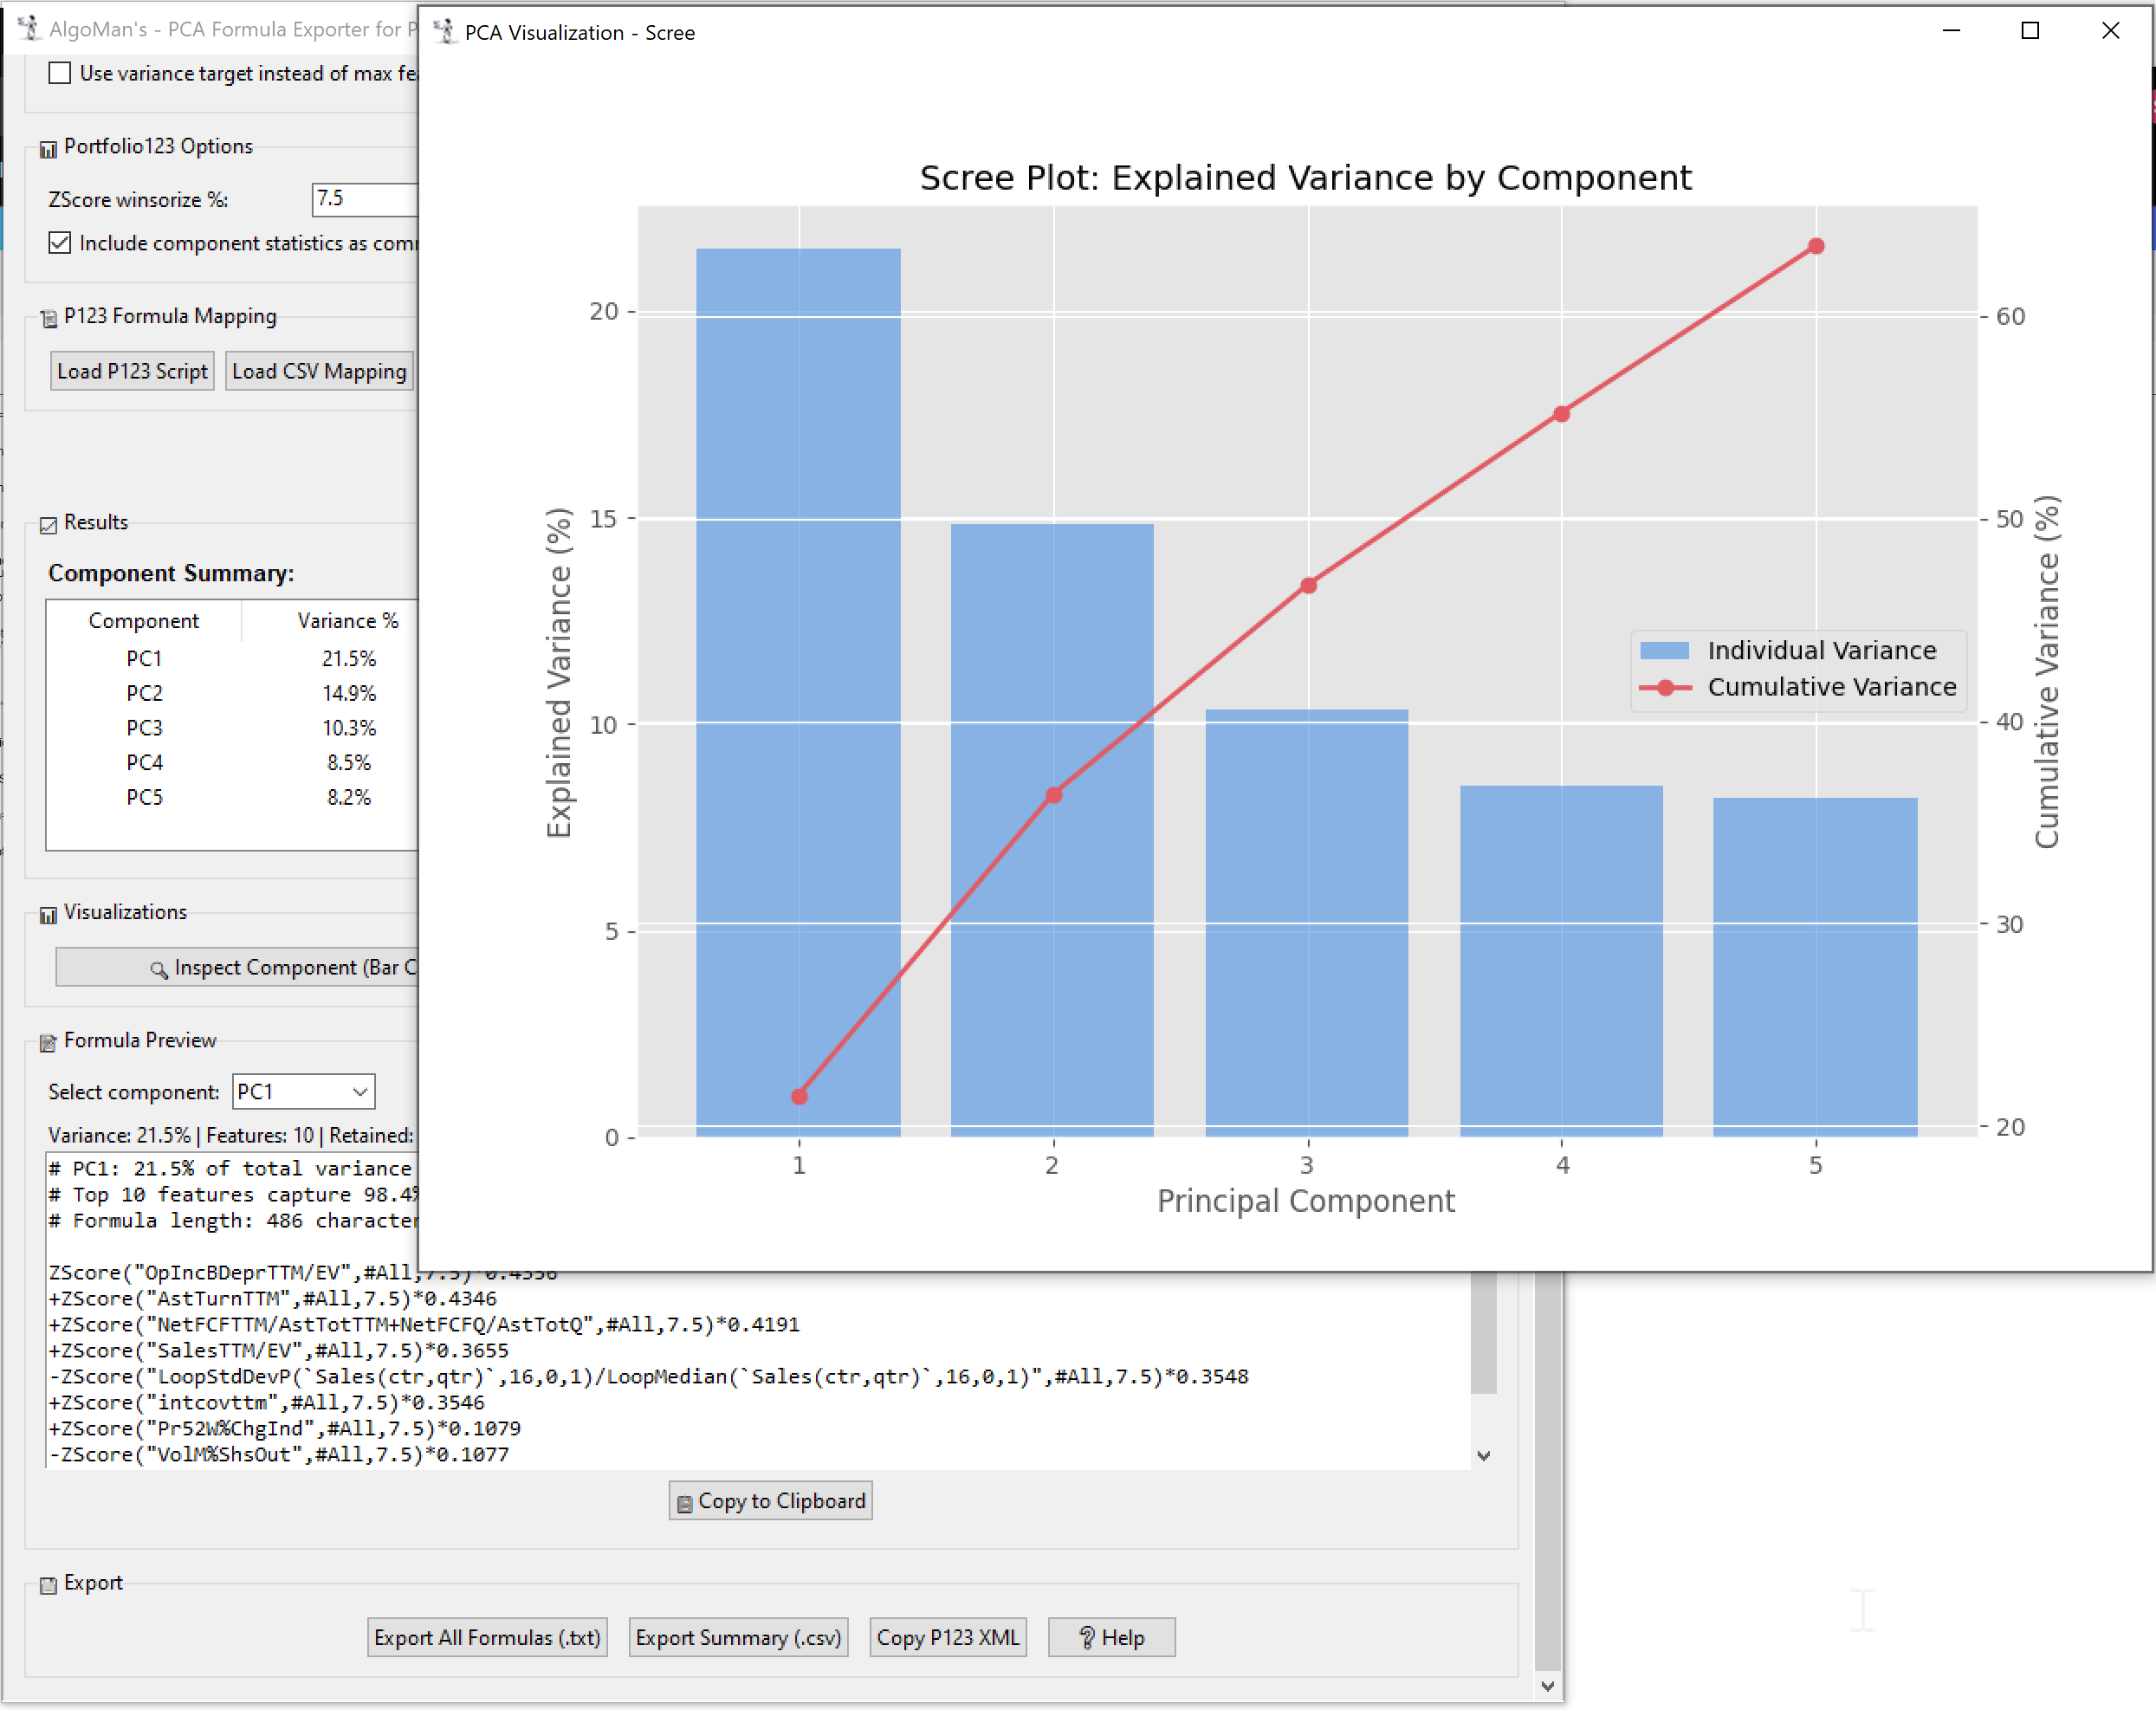
To make this effortless, I built a small desktop application: PCA Formula Exporter.
What it does: It takes your factor data (CSV export from Portfolio123), performs PCA, extracts the components, and automatically generates weighted formulas ready for Portfolio123. You can copy/paste them into a Linear Ranking System or use the "Copy P123 XML" feature to import a complete multi-component setup in seconds.
Key Features:
-
Automatic Weighting: Converts PCA eigenvectors into weighted P123 formulas.
-
Mapping Support: Import your original P123 ranking system XML or a CSV mapping to replace factor names with their actual formulas
-
XML Export for P123: Generates ready-to-import XML code for a new ranking system, with weights scaled proportionally to explained variance (summing to 100%).
-
Visualization: Includes Scree plots (explained variance) and Heatmaps to see which factors are clustering together.
-
Constraint Management: Automatically handles P123 character limits and scales weights to sum to 100%.
Quick Demo: I put together a short video showing the workflow—from performing the analysis to importing the XML into a Ranking System: https://x.com/AlgoManX/status/2008892694194765968
How to use it in short:
-
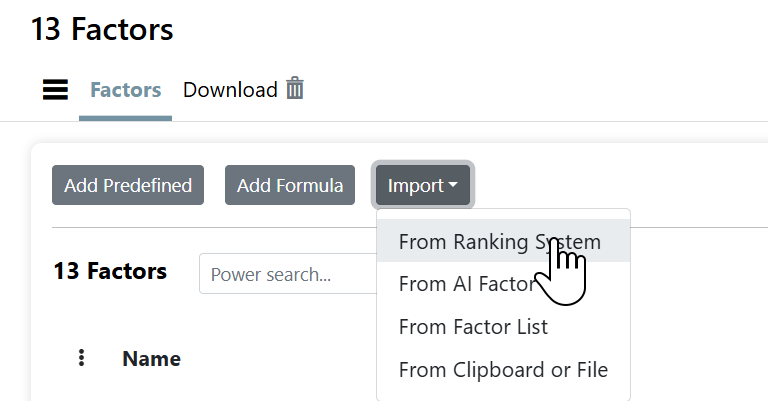
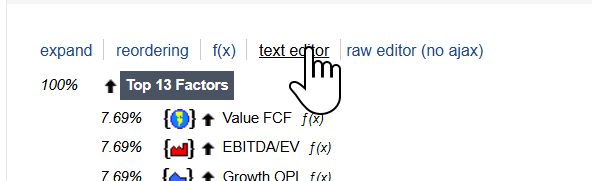
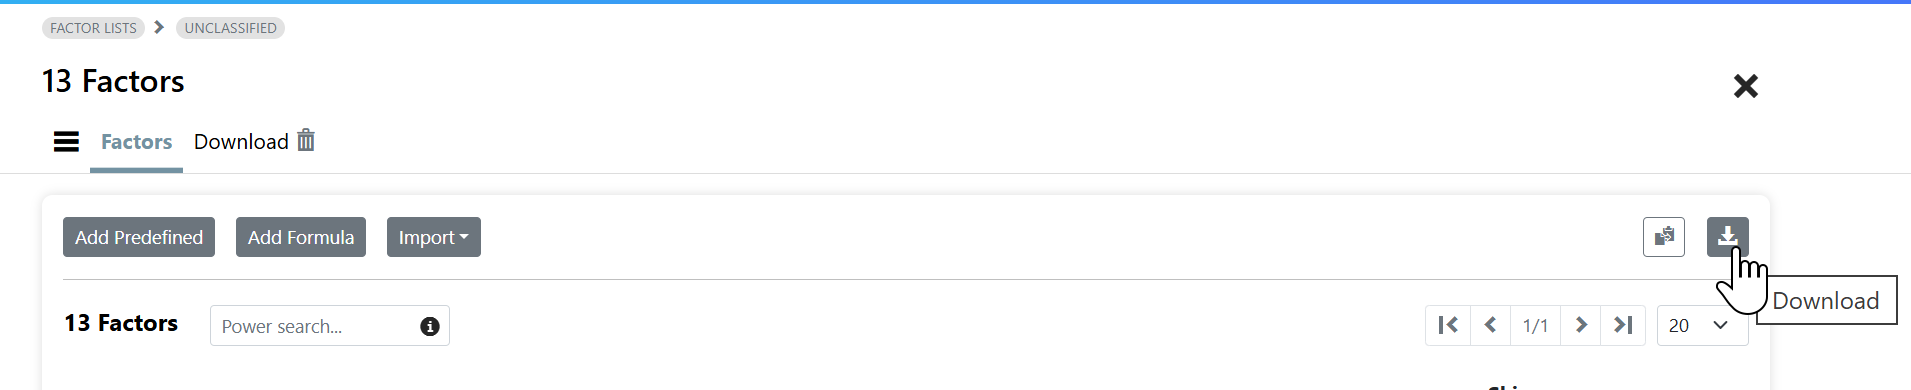
Upload a CSV from factor Download.
-
Run the Analysis.
-
Copy the generated formulas to a new P123 (classic) Ranking system.
I haven’t tested it extensively yet, but initial runs look promising. It works best with 10-30 factors—too many can exceed P123's character limits unless you tighten thresholds or use variance targeting to prune minor loadings.
Before asking questions, check out the built-in Help section (bottom of the app window) for detailed guidance, best practices, and troubleshooting.
Please use this thread to share your results, findings, or suggestions when using the app. I'd love to hear how PCA-based rankings perform in your backtests!