I am trying to do the following:
- Chart the Median PE of R2000 vs Median PE of SP500 over time
- Chart the Median PE of the Cheapest Quintile of R2000 vs. the same data for SP500.
How do I go about doing this?
Any help appreciated
I am trying to do the following:
How do I go about doing this?
Any help appreciated
Hi RTNL, Not exactly what you’re wanting, but this might be of use as a template. It’s currently setup to looking at IWM and PE from companies w/ non-zero earnings. I think that variation of calc is often what is quoted by outside sources, but there are many ways to calc variations of mkt valuation. Chart tab has the visuals. Can change the universe and settings to restrict just to SPY if desired. It’s under the aggregate series in the menus.
https://www.portfolio123.com/app/series/summary/8281?st=1&mt=8
thank you, I was hoping to show the comparison on the same chart. I appreciate the info, and I can certainly use it
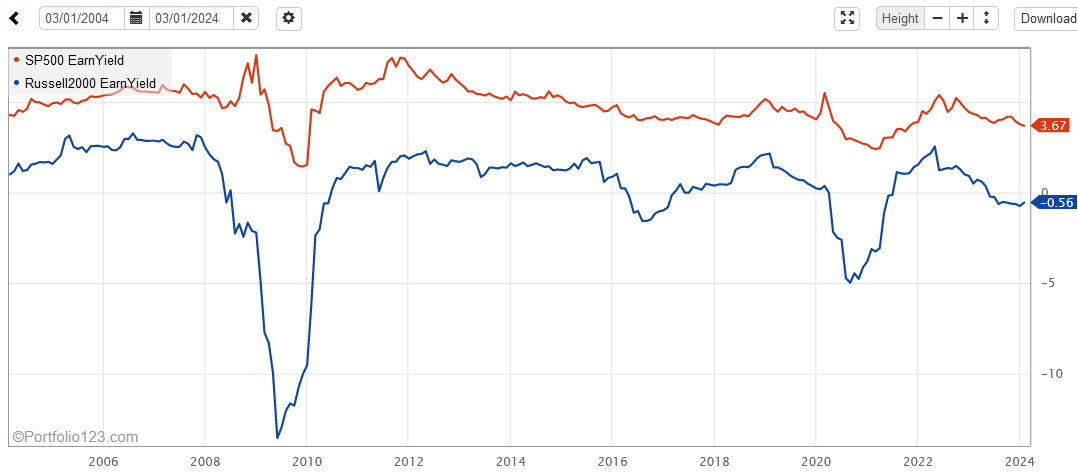
I never understood why everyone uses the PE for index valuation. The Russell 2000 has a large number of companies with negative eps and in a recession that number increases. Why would you not want to include those? If all the companies in the R2k had a negative EPS and 1 had a PE of 5, does that make the R2k cheap? I use EarnYield instead.
The R2k has what I consider outliers where either a very small price or very small eps causes the ratio to be extreme, so I write the formula like this:
UnivCapAvg(“Between(EarnYield,-1000,1000)”,“EarnYield”)
Then create an agg series for the R2k and for the SP500 and you can display them in the Fundamental chart. Formulas in the Fundamental chart are like: Close(0,GetSeries(“EarnYield SP500”)) where EarnYield SP500 is the name of the agg series I created.