This is way better ...
Any Jupyter notebook can be turned into a webapp with ipywidgets. We can host these open-sourced notebooks , and any outside user can interact via a webpage . They never see the code so it's safe for us to host.

This is way better ...
Any Jupyter notebook can be turned into a webapp with ipywidgets. We can host these open-sourced notebooks , and any outside user can interact via a webpage . They never see the code so it's safe for us to host.
Artifacts currently struggle with pulling from APIs directly. They work best when you upload a CSV, and Claude interacts with that file inside the Artifact. So for now, you’d need to run your API script locally first, then upload the resulting file for Claude to analyze.
That’s where Voilà comes in — it supports API integration directly. It runs a notebook server-side and shows users only the widgets and outputs, never the code.
I’m experimenting with Voilà using a downloaded Rank Performance CSV, and that’s been working well. But I can definitely see how API integration would be helpful for repeated or batched runs
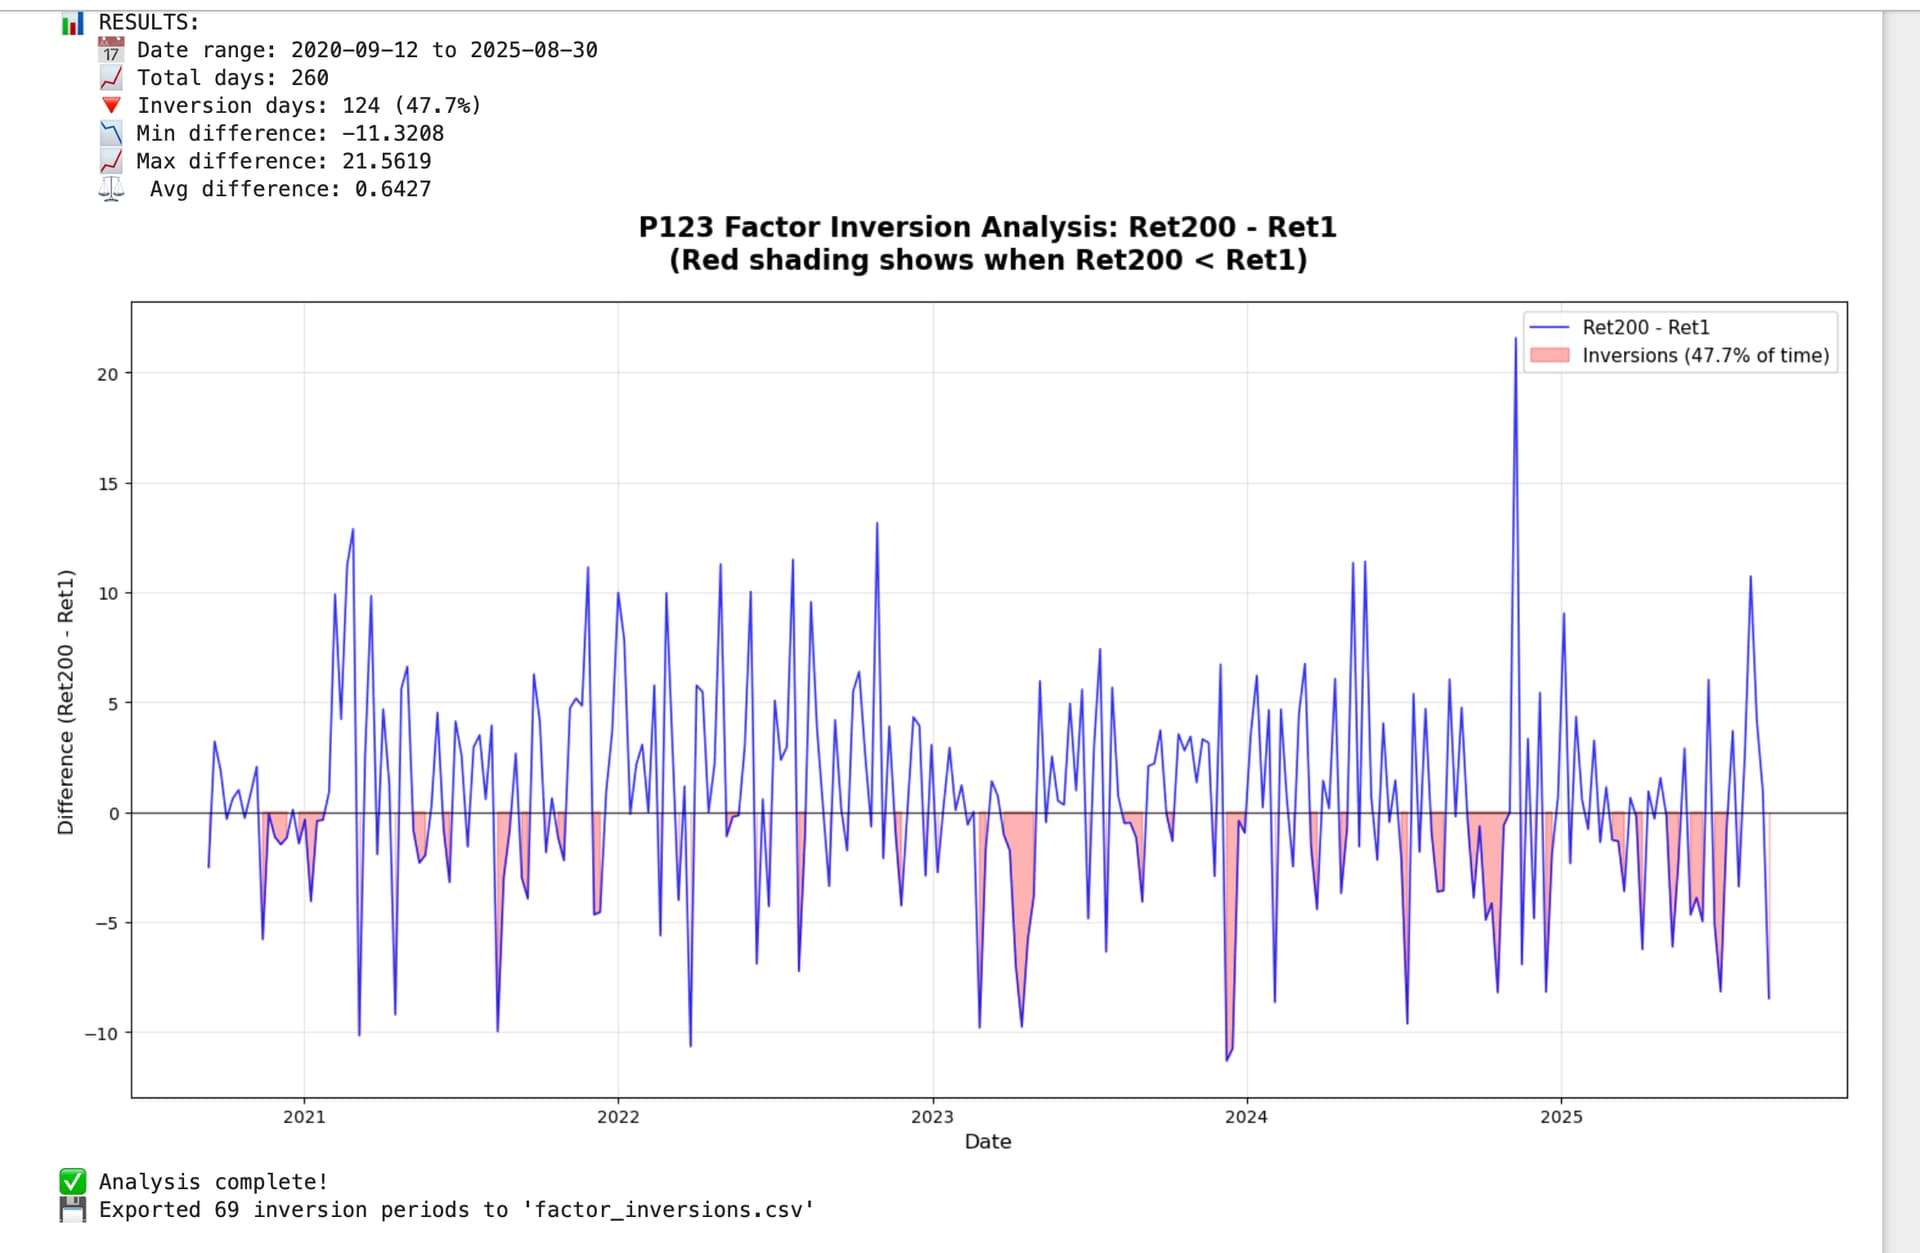
Here’s a working version of my current script. It visualizes “factor inversions” — periods when Ret1 > Ret200. You will need to update the file path and use pip install voila in your environment.
import os
import pandas as pd
import numpy as np
import matplotlib.pyplot as plt
import warnings
warnings.filterwarnings('ignore')

# ---------- Configuration ----------
CSV_PATH = '/Users/JamesRinne/Desktop/Voila.csv'  # Change this path if needed
ROLLING_DAYS = 0  # Set to 0 for no rolling average, or 20 for 20-day average

# ---------- Analysis Function ----------
def analyze_inversions(csv_path, rolling_days=0):
    """Analyze P123 factor inversions (Ret200 - Ret1)"""

    print("🚀 P123 Factor Inversion Analysis")
    print("=" * 50)
    print(f"📁 Loading: {csv_path}")

    # Check if file exists
    if not os.path.exists(csv_path):
        print(f"❌ File not found: {csv_path}")
        print(f"📂 Current directory: {os.getcwd()}")
        return None

    # Load and process data
    df = pd.read_csv(csv_path)
    print(f"✅ Loaded: {df.shape[0]} rows, {df.shape[1]} columns")

    # Validate columns
    required = ['Period', 'Ret1', 'Ret200']
    missing = [col for col in required if col not in df.columns]

    if missing:
        print(f"❌ Missing columns: {missing}")
        print(f"📋 Available: {list(df.columns)}")
        return None

    # Process data
    df['Period'] = pd.to_datetime(df['Period'])
    df = df.sort_values('Period').reset_index(drop=True)
    df['Diff'] = df['Ret200'] - df['Ret1']

    # Rolling average if requested
    if rolling_days > 0:
        df['Diff_Roll'] = df['Diff'].rolling(rolling_days, min_periods=rolling_days//5).mean()

    # Analyze inversions
    mask = df['Diff'] < 0
    inversion_days = int(mask.sum())
    total_days = len(df)
    inversion_rate = inversion_days / total_days

    # Results
    print(f"\n📊 RESULTS:")
    print(f"   📅 Date range: {df['Period'].min().date()} to {df['Period'].max().date()}")
    print(f"   📈 Total days: {total_days:,}")
    print(f"   🔻 Inversion days: {inversion_days:,} ({inversion_rate:.1%})")
    print(f"   📉 Min difference: {df['Diff'].min():.4f}")
    print(f"   📈 Max difference: {df['Diff'].max():.4f}")
    print(f"   ⚖️  Avg difference: {df['Diff'].mean():.4f}")

    # Create plot
    plt.figure(figsize=(15, 8))

    # Main difference line
    plt.plot(df['Period'], df['Diff'], linewidth=1.2, color='blue',
             label='Ret200 - Ret1', alpha=0.8)

    # Rolling average if enabled
    if rolling_days > 0 and 'Diff_Roll' in df.columns:
        plt.plot(df['Period'], df['Diff_Roll'], linewidth=2.5, color='red',
                linestyle='--', label=f'{rolling_days}-day rolling average')

    # Zero line
    plt.axhline(0, color='black', linestyle='-', linewidth=1, alpha=0.7)

    # Shade inversion periods
    plt.fill_between(df['Period'], df['Diff'], 0,
                    where=(df['Diff'] < 0), alpha=0.3, color='red',
                    label=f'Inversions ({inversion_rate:.1%} of time)')

    # Formatting
    plt.title('P123 Factor Inversion Analysis: Ret200 - Ret1\n(Red shading shows when Ret200 < Ret1)',
              fontsize=16, fontweight='bold', pad=20)
    plt.xlabel('Date', fontsize=12)
    plt.ylabel('Difference (Ret200 - Ret1)', fontsize=12)
    plt.legend(fontsize=11)
    plt.grid(True, alpha=0.3)
    plt.tight_layout()
    plt.show()

    print("✅ Analysis complete!")

    # Export inversion periods to CSV
    if inversion_days > 0:
        # Find contiguous inversion runs
        runs = []
        in_run = False
        start = None

        for i, is_inversion in enumerate(mask):
            if is_inversion and not in_run:
                in_run = True
                start = i
            elif not is_inversion and in_run:
                runs.append((start, i-1))
                in_run = False

        if in_run:  # Handle case where data ends during inversion
            runs.append((start, len(mask)-1))

        # Create export data
        if runs:
            export_data = []
            for start_idx, end_idx in runs:
                segment = df.iloc[start_idx:end_idx+1]
                export_data.append({
                    'start_date': segment['Period'].iloc[0].date(),
                    'end_date': segment['Period'].iloc[-1].date(),
                    'length_days': len(segment),
                    'min_difference': segment['Diff'].min(),
                    'avg_difference': segment['Diff'].mean(),
                    'max_difference': segment['Diff'].max()
                })

            export_df = pd.DataFrame(export_data)
            export_df.to_csv('factor_inversions.csv', index=False)
            print(f"💾 Exported {len(runs)} inversion periods to 'factor_inversions.csv'")

    return df

# ---------- Run Analysis Automatically ----------
try:
    result_df = analyze_inversions(CSV_PATH, ROLLING_DAYS)

    if result_df is not None:
        print("\n" + "=" * 50)
        print("🎉 SUCCESS! Analysis completed.")
        if os.path.exists('factor_inversions.csv'):
            print("📁 Check 'factor_inversions.csv' for detailed inversion periods.")
        print("=" * 50)

except Exception as e:
    print(f"❌ Error: {e}")
    import traceback
    traceback.print_exc()
Here is the screenshot for a single feature Rank Performance test (EV to Sales):
Can you set up the API within Voilà from here?
Who's that question for?
Voilà just renders Jupyter notebooks, including interactive widgets (like ipywidgets ), as dynamic web pages. That's it. The code is in the JN which of course can use P123 APIs.
Thanks for introducing me to Voilà, Marco!
Just to clarify, my question was meant for Korr, who had asked me about Artifacts, file uploads, and API support:
As you probably know, Artifacts use CORS, which makes using external APIs difficult or impossible unless they’re configured for cross-origin requests (which P123’s API currently isn’t).
What I was trying to do was make Korr aware that, unlike Artifacts, Voilà lets you use both local CSVs and APIs—depending on what works best for your setup.
I’m not actually sure whether Korr prefers local files or the API—but if he does want API access, I was suggesting that he could modify the code I shared to do that. He’s probably more comfortable with the P123 API in Python than I am.
Also, you’re absolutely right that Voilà can be used to build shareable apps that never expose the code—a big security and collaboration advantage over Artifacts. I didn’t emphasize that in my post, but it’s an important distinction.
Marco,
Thanks again for your thoughts on how members can collaborate more easily.
I think having a set of downloads that members can use to customize their own features is a win for everyone—whether a feature gets integrated into P123 later or not. The Rank Performance test download is an example. Whether feature inversion gets added to the Rank Performance test later or not, we can customize that feature now, using the download. We can have this feature--with mild download and upload work on a member's part—now. And we can share this (and other) features with Voila and potentially other methods.
Using Voila is a valuable, practical suggestion on how to implement this, I think. I had trouble getting Voilà working with an earlier script and just used a regular Jupyter Notebook to get my output (above). Here’s a fully functional Voilà implementation that might help illustrate your idea to members.
It loads a P123 Rank Performance Test CSV (e.g., 5-year, 200-bucket) and visualizes factor inversions — periods when Ret200 < Ret1. Users just upload the file and click “Run Analysis”. Voilà handles the rest.
No code is visible to the user, and everything runs client-side. This demo works on my MacBook using Jupyter, and if Voilà is ever integrated into P123, members could use it to create and collaborate on new features without needing to share raw code. After 'pip install voila' in your environment:
# --- Voilà App: P123 Factor Inversion Viewer (Ret200 − Ret1) ---
import traceback
import os
import io
import pandas as pd
import numpy as np
import matplotlib.pyplot as plt
import warnings
from IPython.display import display
from ipywidgets import Button, IntSlider, Text, FileUpload, Output, VBox, HBox, Label

warnings.filterwarnings('ignore')

# ---------- Widgets ----------
csv_path = Text(
    value='/Users/JamesRinne/Desktop/Voila.csv',
    description='CSV Path:',
    layout={'width': '520px'}
)

rolling_days = IntSlider(
    value=0,
    min=0,
    max=100,
    step=5,
    description='Rolling:',
    layout={'width': '300px'}
)

uploader = FileUpload(
    accept='.csv',
    multiple=False,
    description='Upload CSV'
)

run_btn = Button(
    description='Run Analysis',
    button_style='success'
)

out = Output()

# ---------- Main Function ----------
def analyze_inversions(df, rolling_days=0):
    df['Period'] = pd.to_datetime(df['Period'])
    df = df.sort_values('Period').reset_index(drop=True)
    df['Diff'] = df['Ret200'] - df['Ret1']

    if rolling_days > 0:
        df['Diff_Roll'] = df['Diff'].rolling(rolling_days, min_periods=rolling_days//5).mean()

    mask = df['Diff'] < 0
    inversion_days = int(mask.sum())
    total_days = len(df)
    inversion_rate = inversion_days / total_days

    # Print summary
    print(f"📅 Date range: {df['Period'].min().date()} → {df['Period'].max().date()}")
    print(f"📈 Total days: {total_days:,}")
    print(f"🔻 Inversion days: {inversion_days:,} ({inversion_rate:.1%})")
    print(f"📉 Min difference: {df['Diff'].min():.4f}")
    print(f"📈 Max difference: {df['Diff'].max():.4f}")
    print(f"⚖️  Avg difference: {df['Diff'].mean():.4f}")

    # Plot
    plt.figure(figsize=(14, 6))
    plt.plot(df['Period'], df['Diff'], label='Ret200 - Ret1', linewidth=1.5, color='blue')
    if rolling_days > 0:
        plt.plot(df['Period'], df['Diff_Roll'], linestyle='--', linewidth=2.0, color='red',
                 label=f'{rolling_days}-day Rolling Avg')

    plt.fill_between(df['Period'], df['Diff'], 0, where=(df['Diff'] < 0), color='red', alpha=0.3, label='Inversion')
    plt.axhline(0, color='black', linewidth=1)
    plt.title('Factor Inversion: Ret200 - Ret1')
    plt.xlabel('Date')
    plt.ylabel('Difference')
    plt.legend()
    plt.grid(True, alpha=0.3)
    plt.tight_layout()
    plt.show()

    # Export inversion periods
    runs = []
    in_run = False
    start = None
    for i, is_inv in enumerate(mask):
        if is_inv and not in_run:
            in_run = True
            start = i
        elif not is_inv and in_run:
            runs.append((start, i - 1))
            in_run = False
    if in_run:
        runs.append((start, len(mask) - 1))

    if runs:
        export = []
        for s, e in runs:
            seg = df.iloc[s:e+1]
            export.append({
                'start_date': seg['Period'].iloc[0].date(),
                'end_date': seg['Period'].iloc[-1].date(),
                'length_days': len(seg),
                'min_diff': seg['Diff'].min(),
                'avg_diff': seg['Diff'].mean(),
                'max_diff': seg['Diff'].max()
            })
        pd.DataFrame(export).to_csv('factor_inversions.csv', index=False)
        print(f"\n✅ Exported {len(runs)} inversion periods to 'factor_inversions.csv'")
        print("📁 Download via /files/factor_inversions.csv")

# ---------- Callback ----------
def run_analysis(_):
    out.clear_output()
    with out:
        try:
            # Priority: uploader > path
            if uploader.value:
                content = list(uploader.value.values())[0]['content']
                df = pd.read_csv(io.BytesIO(content))
                print("📂 Loaded from uploaded file")
            else:
                path = os.path.expanduser(csv_path.value.strip())
                if not os.path.exists(path):
                    print(f"❌ File not found: {path}")
                    return
                df = pd.read_csv(path)
                print(f"📂 Loaded from path: {path}")

            # Check required columns
            for col in ['Period', 'Ret1', 'Ret200']:
                if col not in df.columns:
                    print(f"❌ Missing column: {col}")
                    print(f"Found: {list(df.columns)}")
                    return

            analyze_inversions(df, rolling_days.value)

        except Exception as e:
            print("❌ Error:", e)
            traceback.print_exc()

run_btn.on_click(run_analysis)

# ---------- Display UI ----------
display(VBox([
    Label("📊 P123 Factor Inversion Viewer: Ret200 - Ret1"),
    HBox([Label("Upload (optional):"), uploader]),
    HBox([csv_path, rolling_days, run_btn]),
    out
]))