TL:DR: Do you want to know if your signal is statically significant and do you want to know how much variation there is in it? (see poll at bottom)
Longer version:
Recently, I’ve spoken to Marco on ideas to strengthen the platform. From my perspective, two critical pieces are missing:
- A Risk Model
- Portfolio Construction Module/Techniques
To test this, I built some tools and want to see if others here want it.
A motivating example:
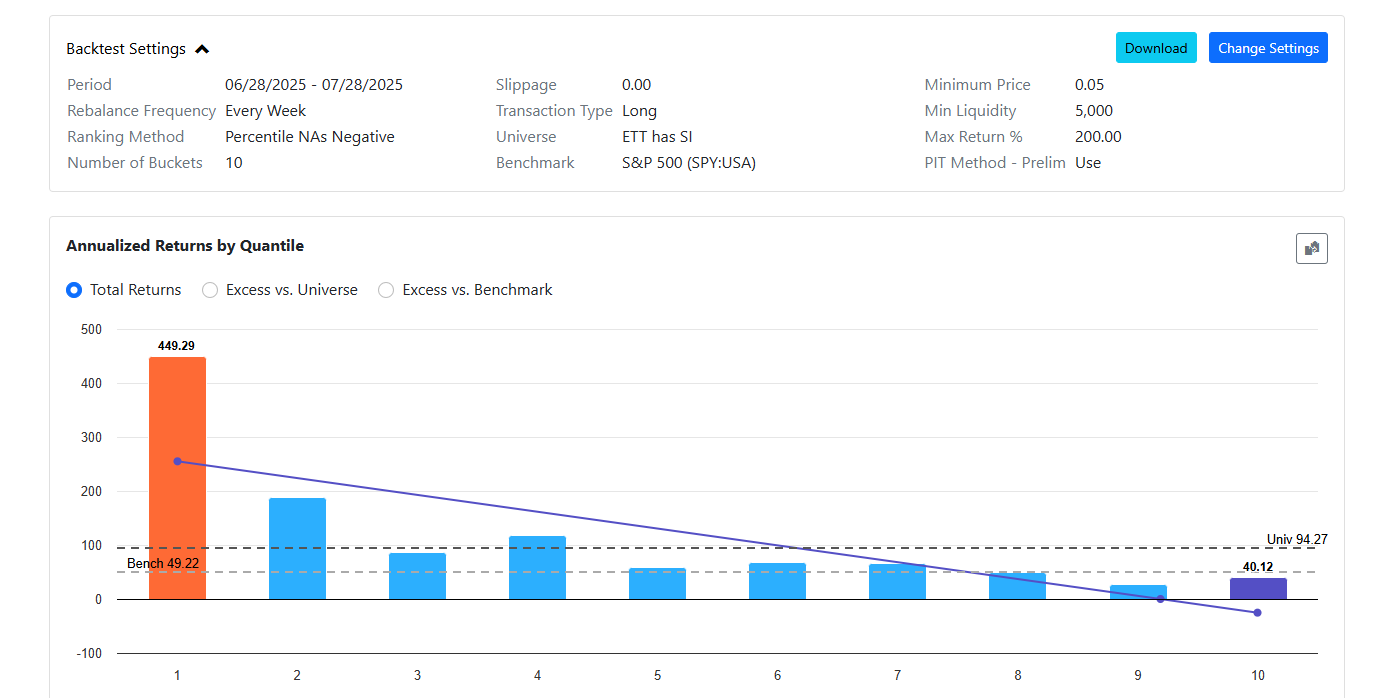
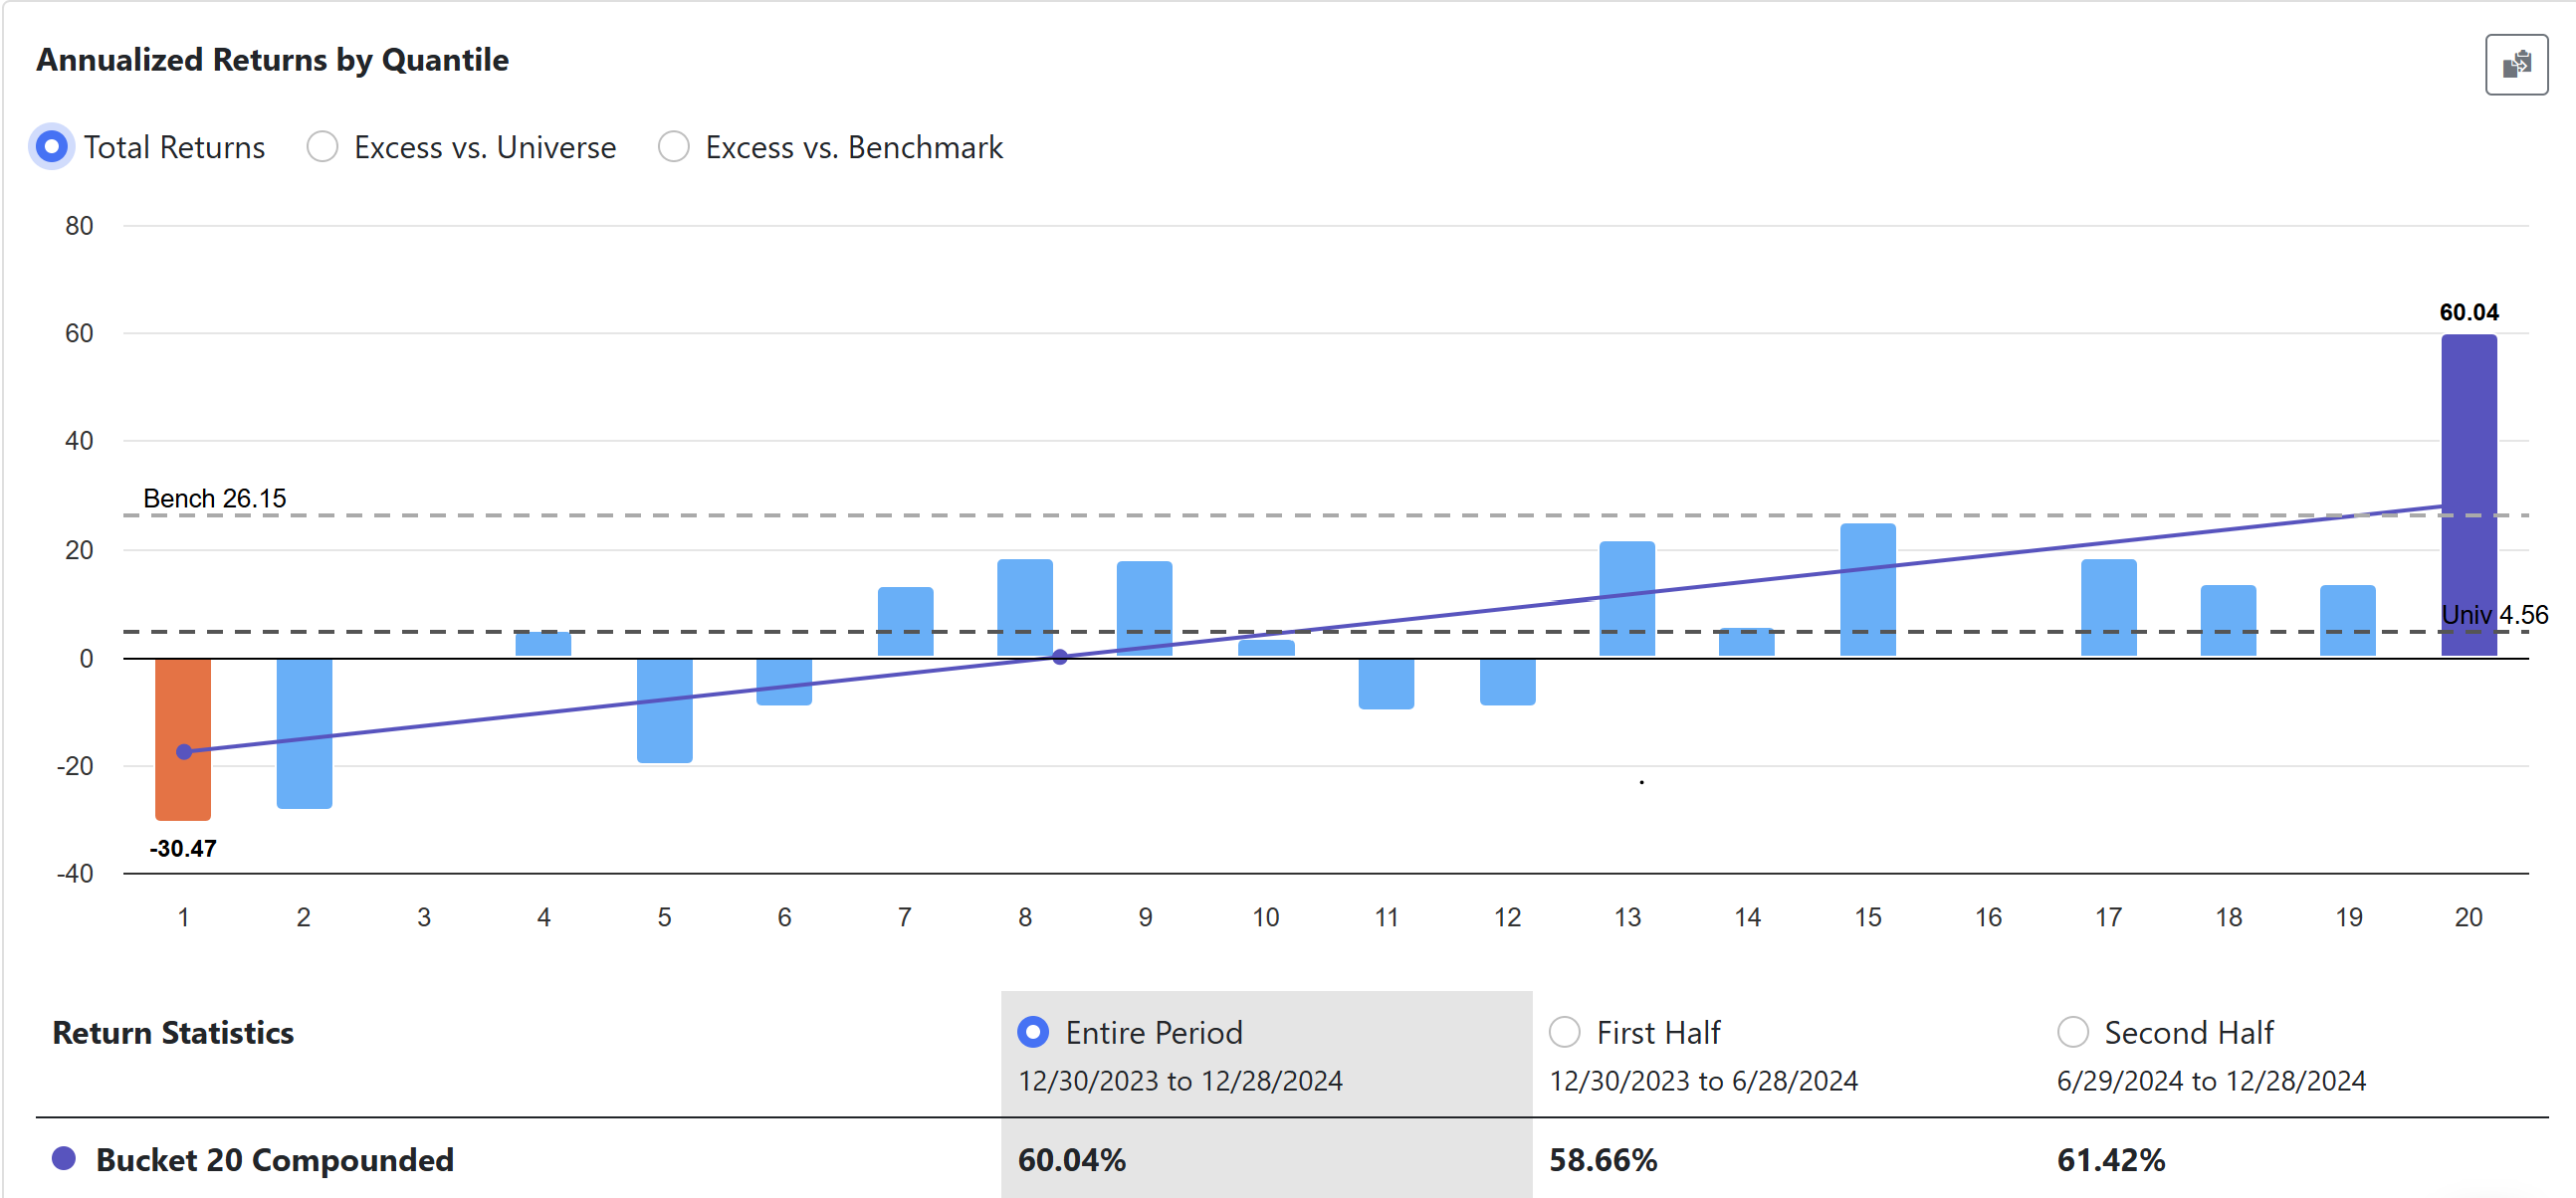
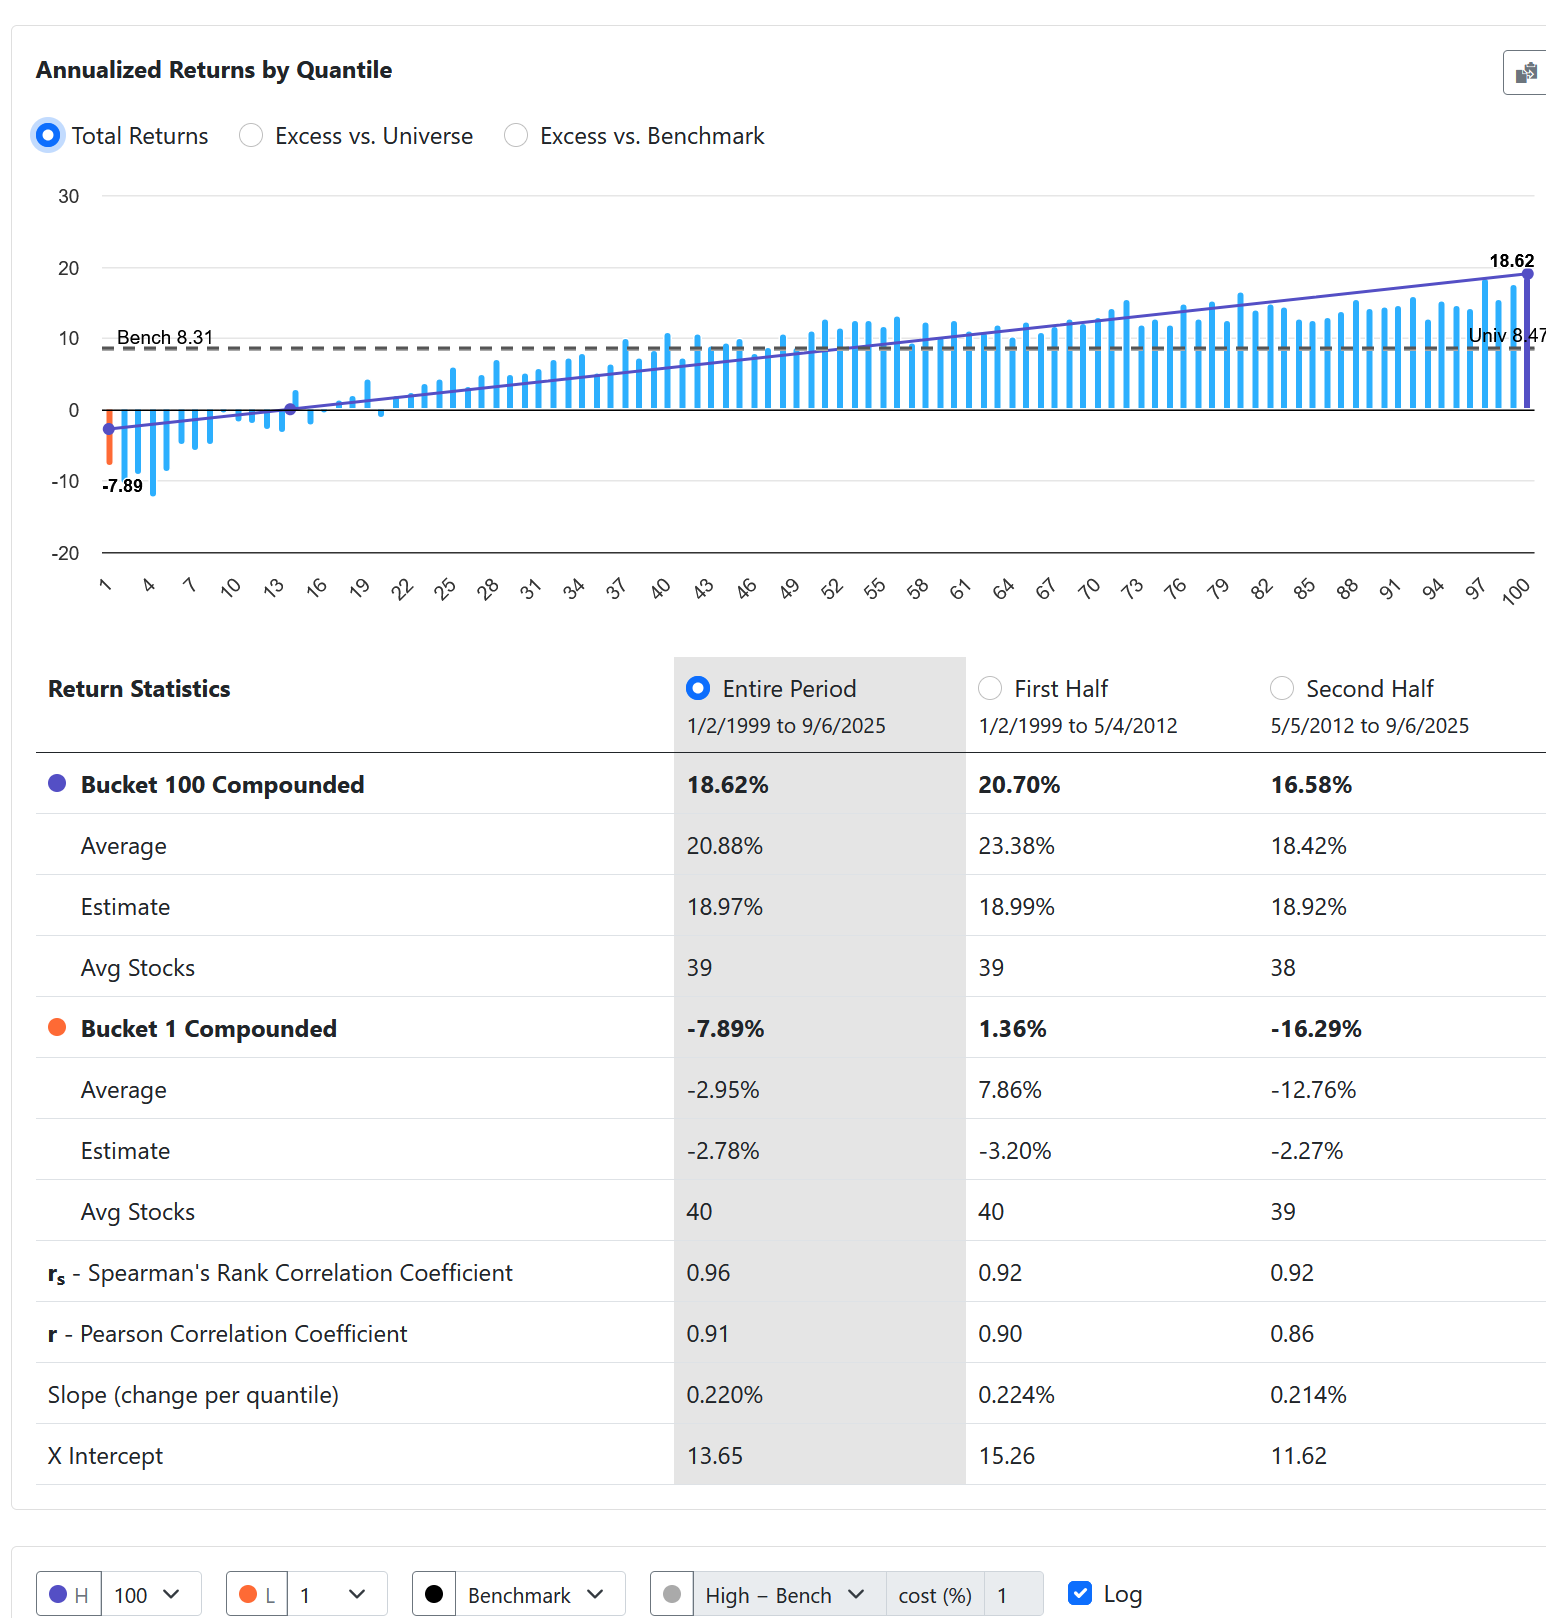
Say you’ve built a ranking system with a nice-looking performance chart. The top bucket beats the bottom bucket, it monotonic, so it looks like you’ve got a clean signal. Let's look at the p123 composite (a good model):
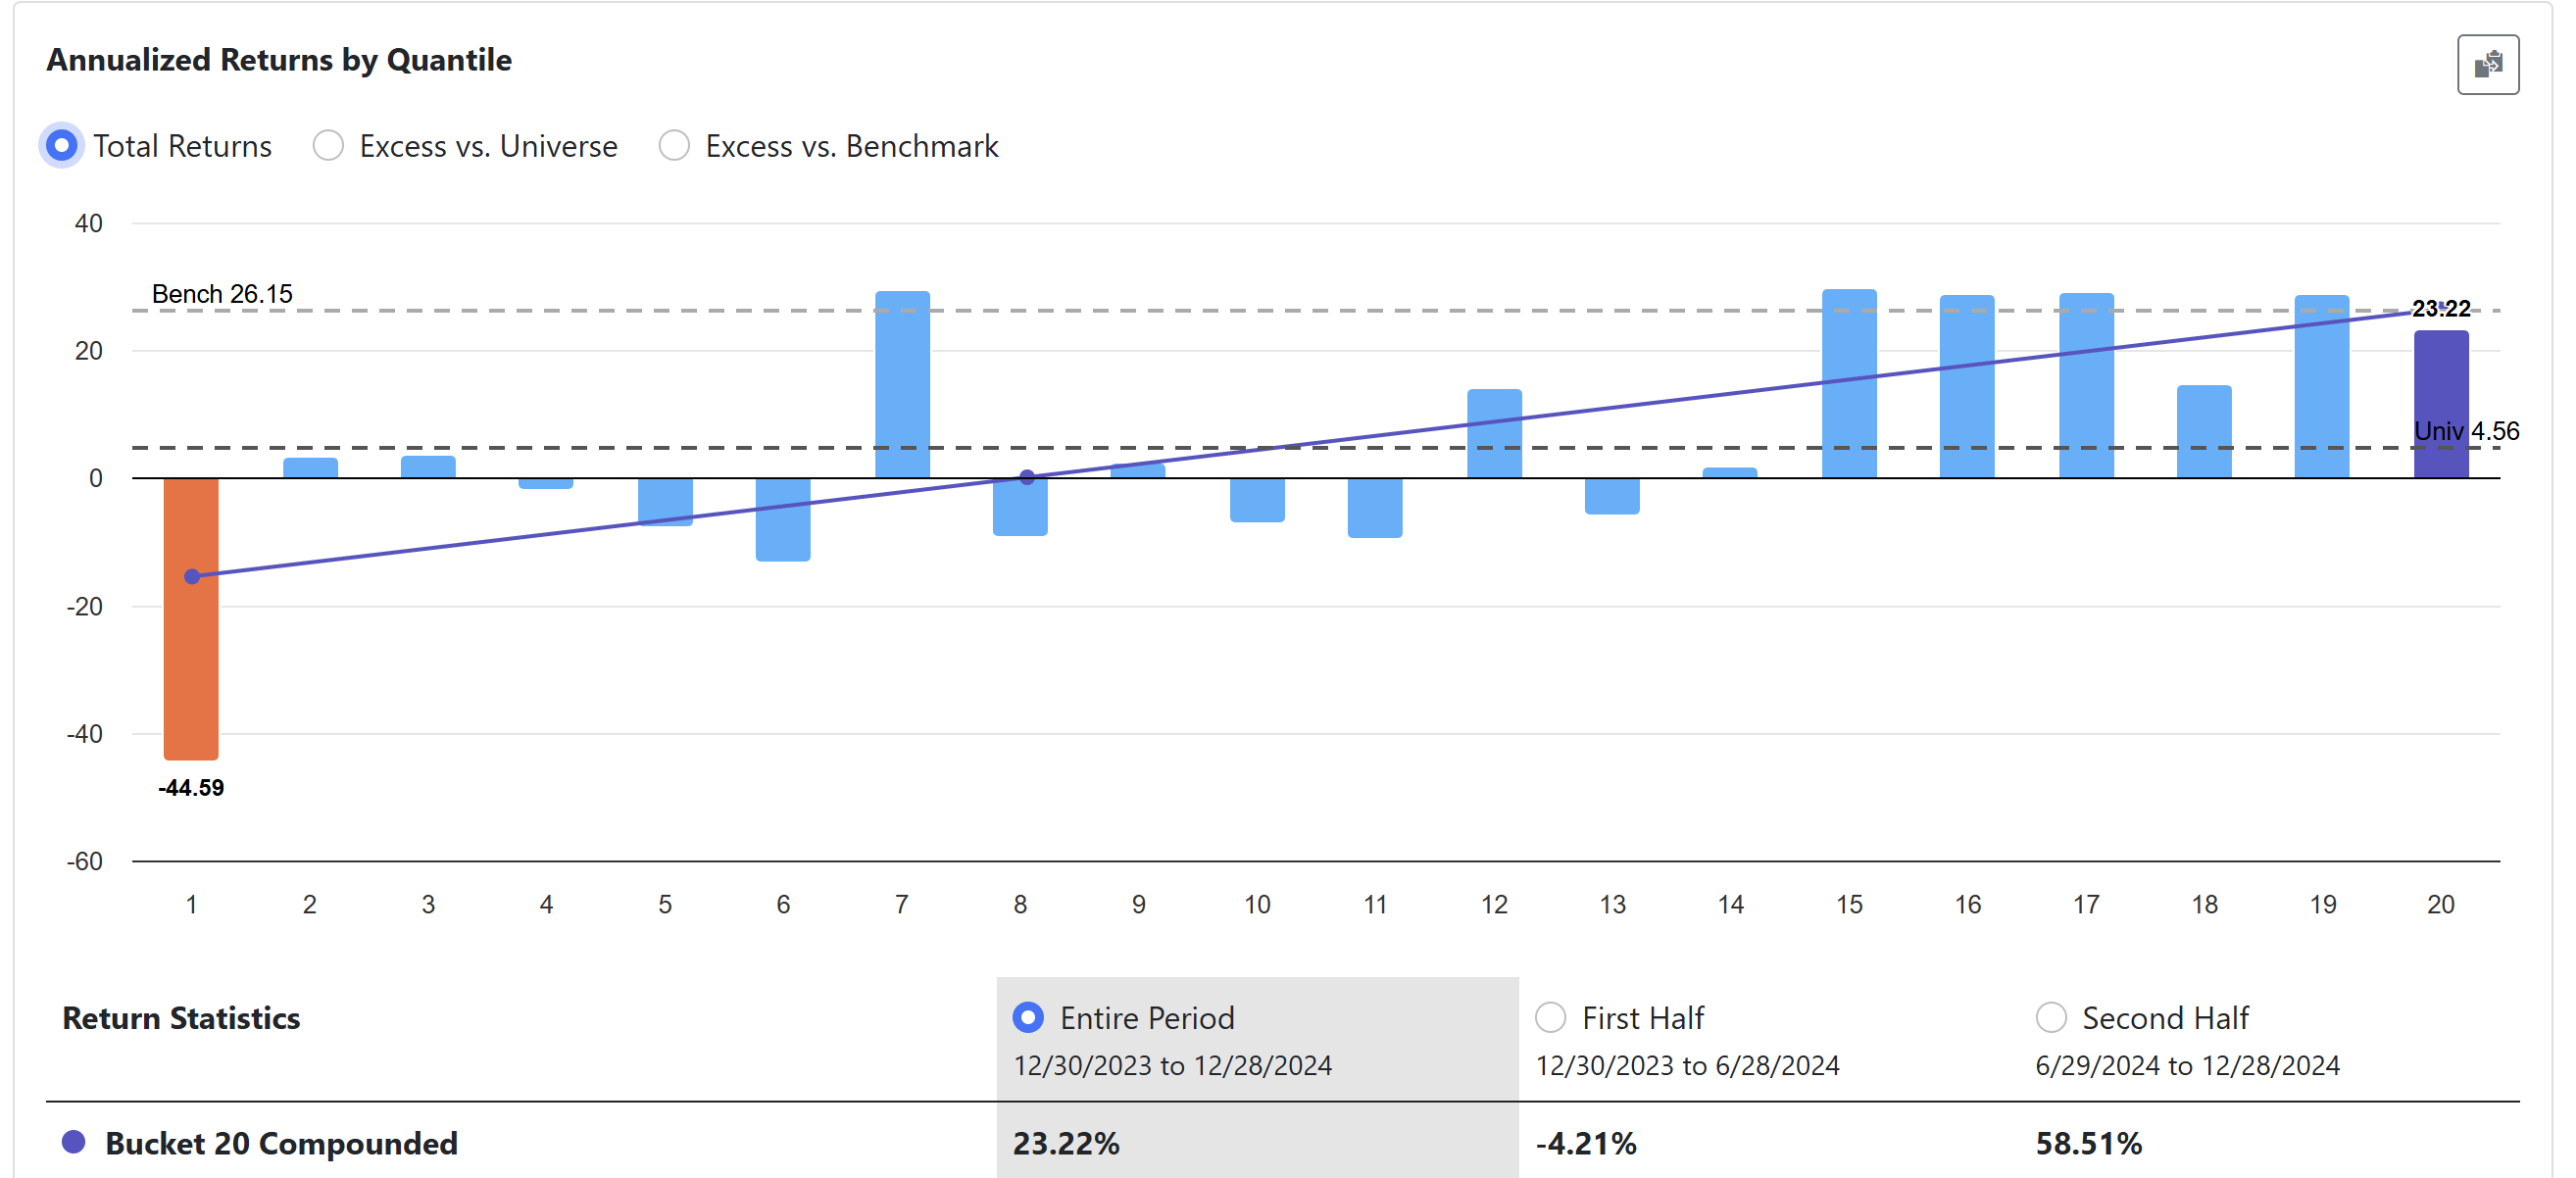
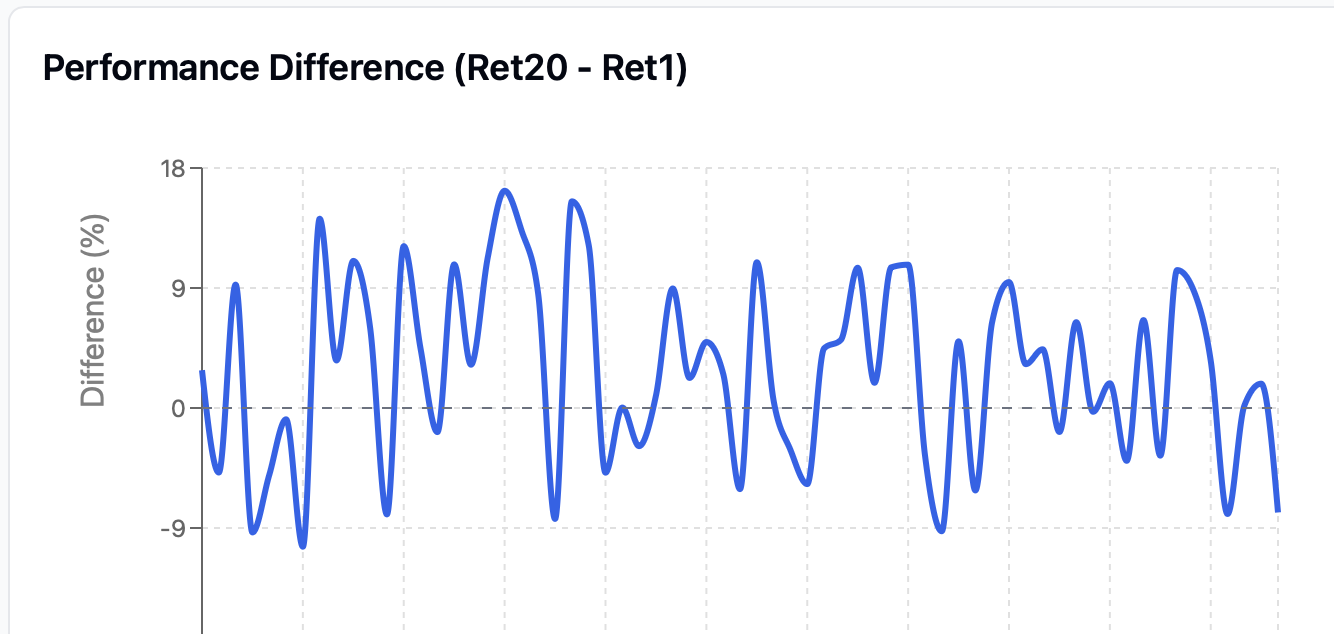
But what happens when you actually trade it?
- Sometimes the signal flips: the bottom bucket outperforms the top.
- Sometimes that “inversion” lasts weeks or months.
- Sometimes the recovery is quick, other times it drags on.
- And last but perhaps most importantly, if you only hold 20 stocks, the real spread can be far messier than the smooth chart you see in research. Most IC's are <.05 (i.e. individual stock predictions are not strong so you need to make many independent bets to realize that backtest, assuming it holds out of sample).
This feature would automatically show you:
- How statistically significant your signal really is (vs. just noise)
- The exact periods when your signal inverted, how deep it went, and how long recovery took
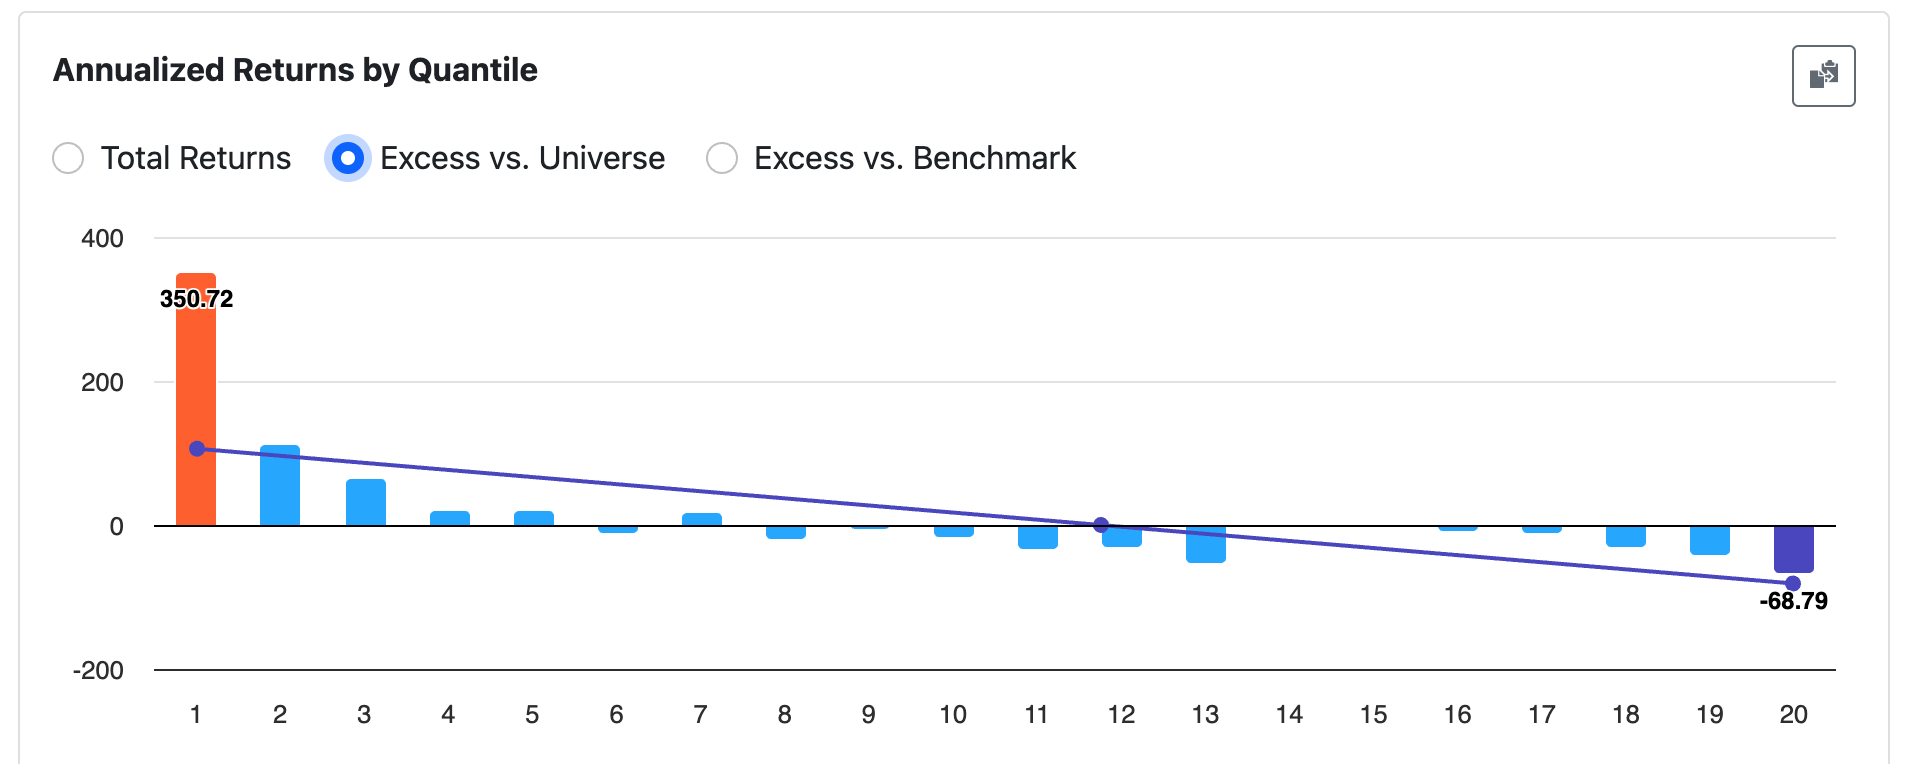
- Statistical Top–bottom bucket spread adjusted for all buckets.
Why it matters: almost all signals are noisy. Current charts can give a false sense of security, like the future will look as clean as the backtest. By surfacing the messy periods, these tools help in two ways:
- You can improve your signals by studying when and why they break.
- You can manage expectations better during inevitable drawdowns.
Factor inversions, drawdowns, etc. have plagued the platform, imo. Here is some output using the community composite ranking system and the traditional bucket performance. We'd explain the stats for users in plain language.
This is a first cut but the heavy lifting is done. A thumbs up or down if you'd like this would be helpful.
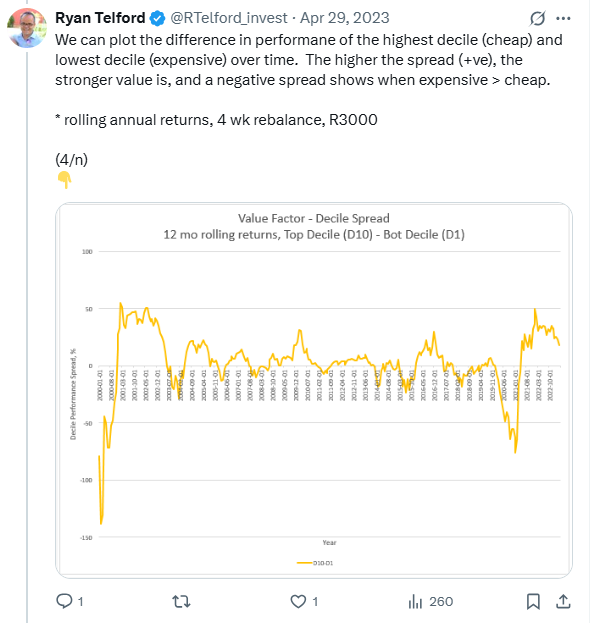
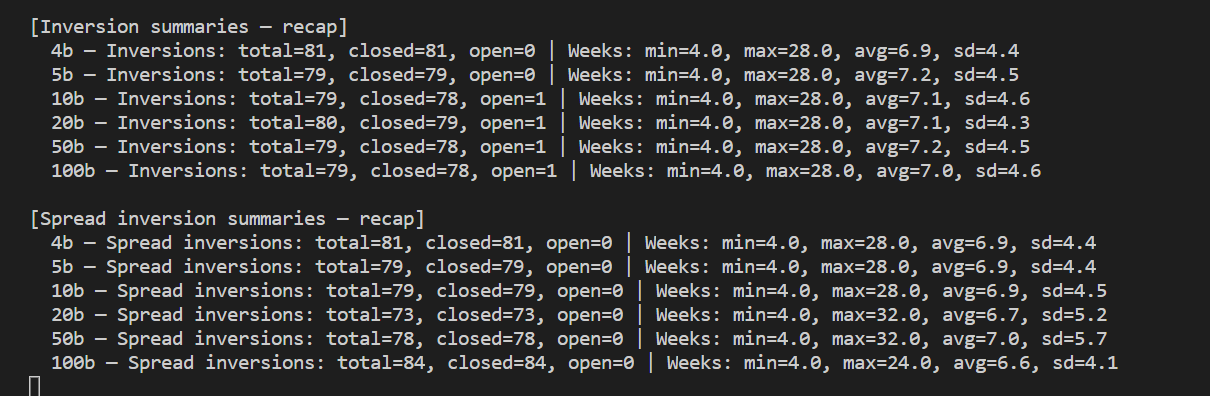
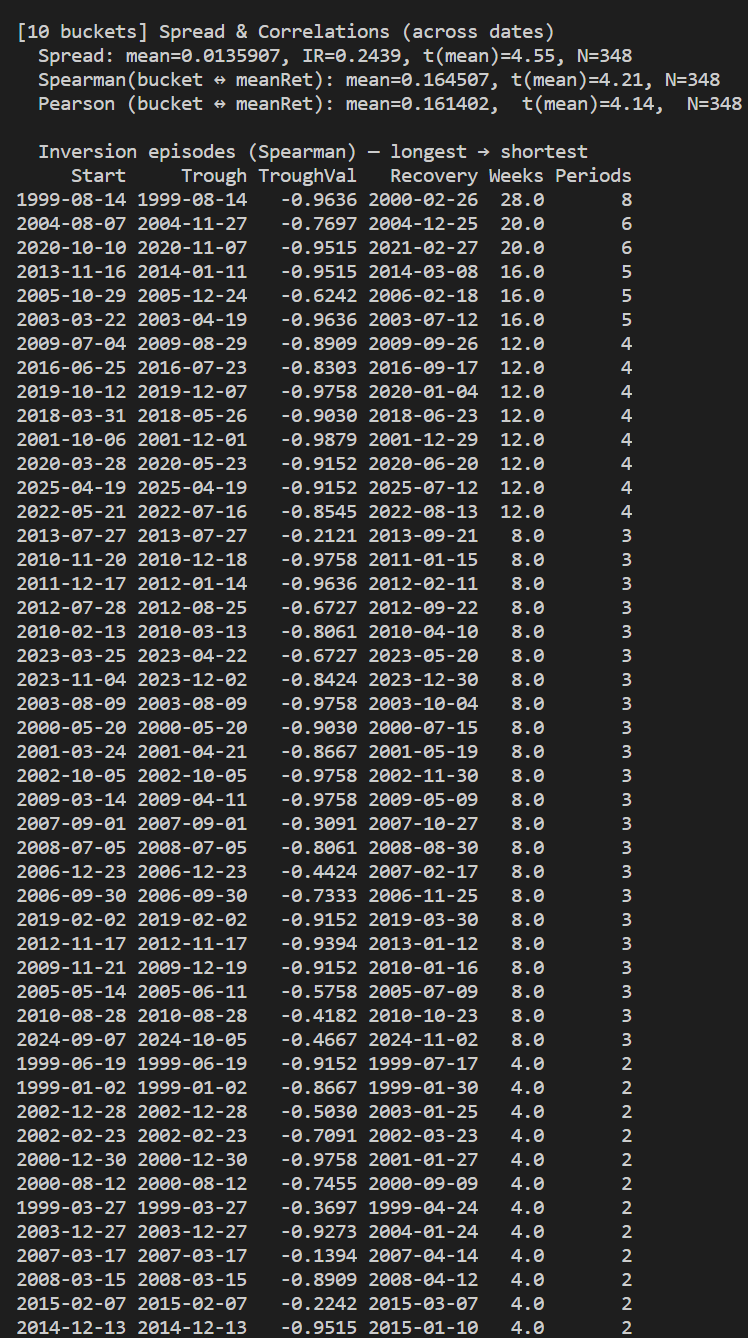
Notice how often 10 buckets invert. These would be times you'd be lagging the market or losing money.
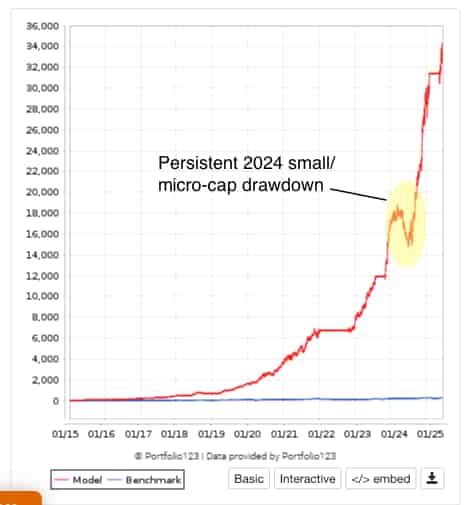
Here's some of the inversion people were talking about this year:
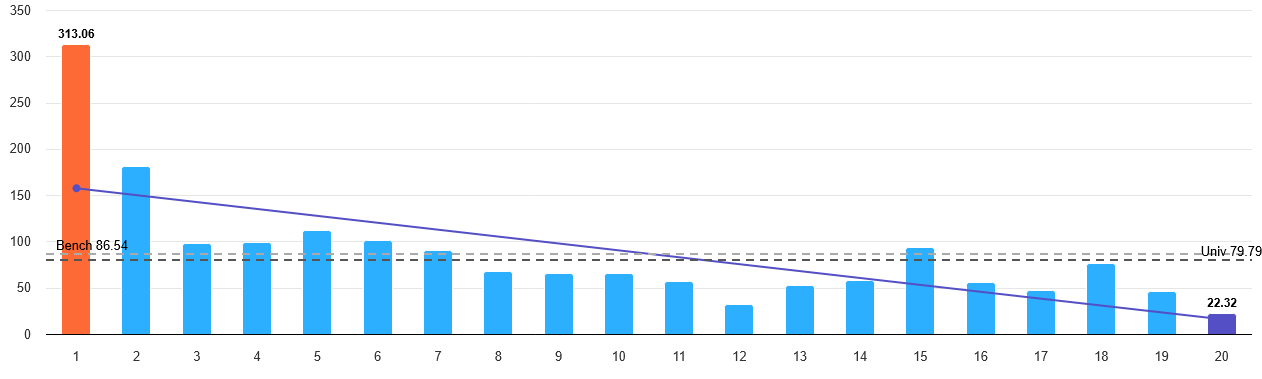
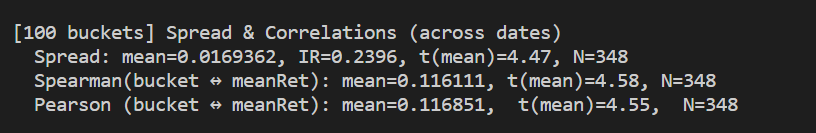
Here are some stats using 100 buckets (notice how low IR is).
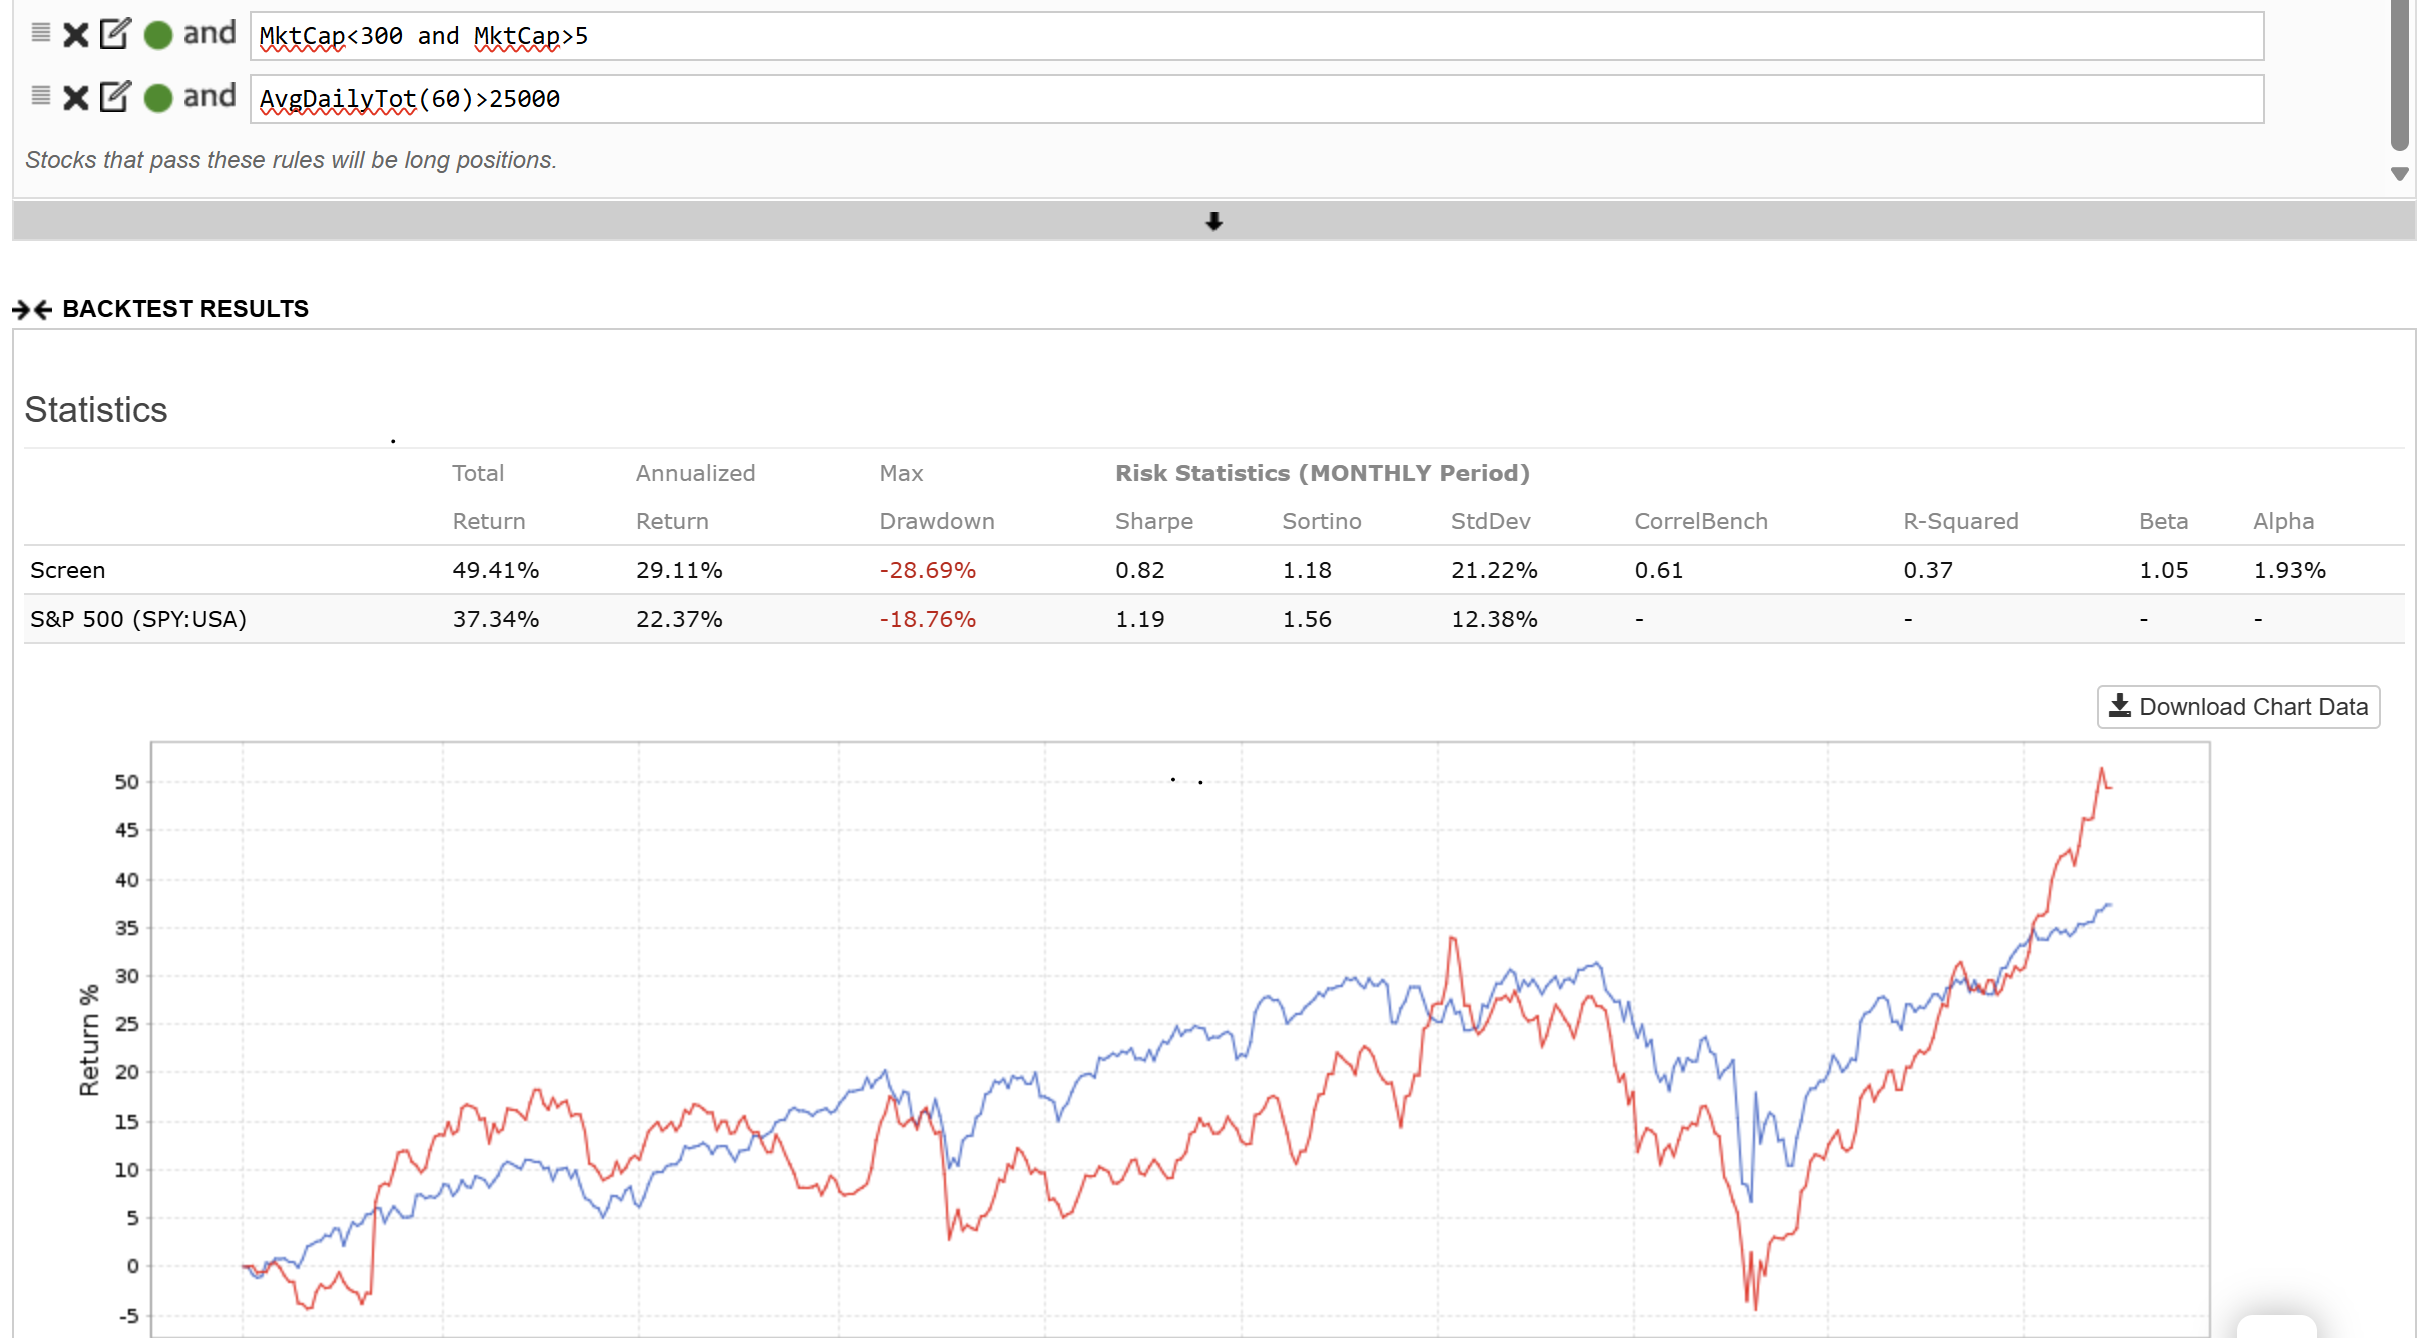
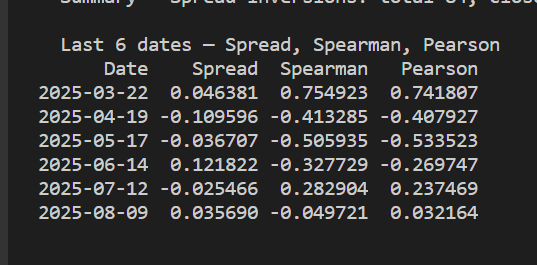
Here's a sample historical output: