I'm curious to learn about overall performance of the P123 community over the last 1 - 2 months. I'm experiencing a “cluster drawdown” coming partly from industry / sector momentum underperformance, beta rally but also a complete inversion of idiosyncratic correlations (that's ongoing for exactly 1 month now).
The correlation breakdown is the concerning part as I do not expect this in such market conditions. I run a pca on the portfolio variance to find latent risk factors but nothing is really revealing.
Same here. I am in micro/small so my benchmark is the R2K. I have never seen such an underperformance of my ports to the R2K. I have tested 2 pretty similar systems with 40 stocks and IndWt<10, so pretty diverse, and one has a YTD performance of 20%, the other 2%. The dispersion of returns in this space is unreal right now.
Pro against beta strategies (low volatilily strategies) should suffer in this kind of scenarios of Inversion, moreover strong momentum strategies should fly (some years ago people, studies says that pure momentum strategies were over)...but all in all sooner or later will reverse...it's seems that some factors never die however it's decay. With AI factors of course this could be mitigated cause take into consideration non-linear relations...
Same here, using only out-of-sample returns. The only comparable period for me is June through October 2024, which was slightly worse. I've been using ranking systems since 2015, and have never seen anything like those two periods.
Perhaps, though, that's because I've been doing a good deal of hedging of my portfolio since 2024, and that wasn't the case earlier. If I decompose my returns into the long only portion, there were significantly worse periods: late 2019 and early 2020; late 2022; late 2024.
Seeing the same pattern over the last 2–3 months, I’d say this rally has been characterized by narrow breadth, with leadership concentrated in lower-quality names (most shorted stocks, unprofitable tech, high beta).
So I’m not too concerned. I expect performance to catch up eventually.
Yes, I see it's happening to me too, but I've also managed to combine it with bad timing on my part, sitting in cash because I was afraid of what was going to happen and mistimed the sale of gold holdings, but Europe has somewhat rescued me, but NOK is altso a drag:
Based on this thread, are some of you reacting to the fact that several of us are receiving the same corrections in the same period, which supports the idea that we, or many of us on P123, are too concentrated in the same stocks?
This could indicate that we are, to too great an extent, using the same methods and the same weighting of criteria and factor combinations to find our stocks.
Is anyone else a bit concerned that too many of us are overlapping each other?
I'm doing well this year, but it's the AI models that is outperforming.
I run 13x2 strategies on paper accounts just to see what the performance are for the ranking systems. Each strategy is run on one account with 25 stocks and one with 50 stocks, this year the accounts with 50 stocks are doing better than the ones with 25. So it very likely that many P123 users are in crowded trades.
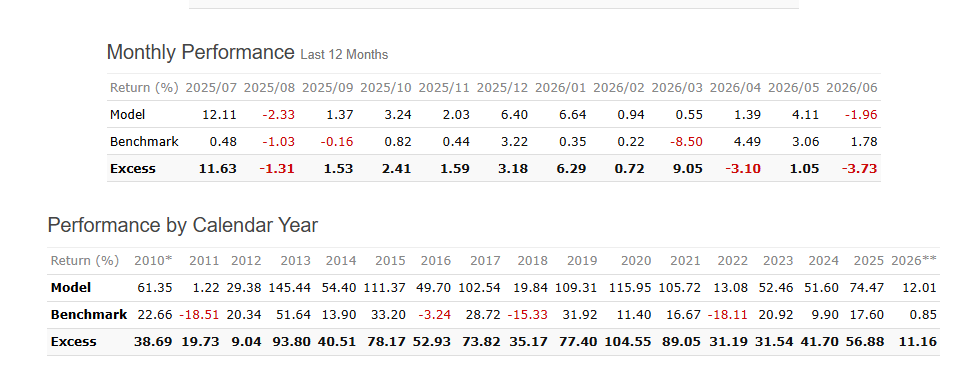
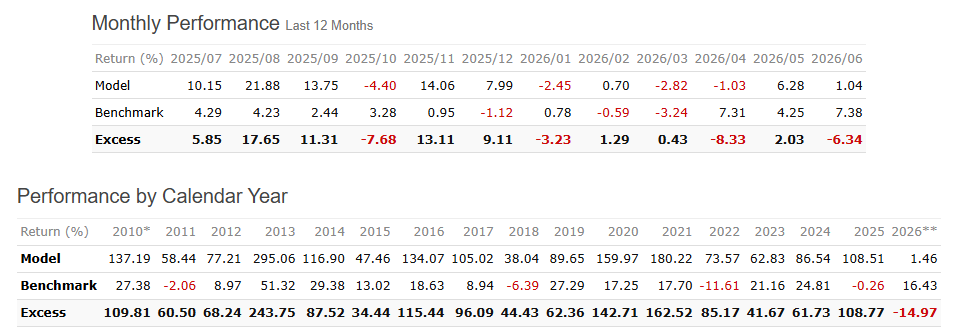
The variance of the selected model’s annual returns may play a role. These are 2 models trained up until the end of 2015. Displayed is the out-of-sample performance over the test period (2016 on).
CAGR for entire out-of-sample period INCLUDING 2026 (pretty much the same):
Model A: 33.76%
Model B: 33.6%
Help me make sure I am not overstating this: If at the end of 2025 I had selected the model with less variance in the annual returns (model B) then this would have given me a more moderate result in 2026: 16.29% for Model B vs. 8.41% for model A.
This is just one example of what I have been looking at recently. And I do not have any hard and fast rules that I follow. But I am looking at variance of the annual returns as one metric when selecting a model now. All other things being equal, I prefer more stable annual returns.
I’m indeed winding down the classic ranking model which is based on the P123 “Micro cap focus” as I still see too many same stocks overlapping with the P123 original one and I assume many of other P123 users are trading these stocks at the same time. Another reason is I also want to free up capital for the upcoming Asia/EM universe.
I also noted the AI models are performing significantly better than the classic rankings model YTD.
FWIW, I don’t think p123 names are “overcrowded”, I think exogenous one off events (Iran War) rug pulled a lot of sectors that were beautifully set up heading into the spring with higher energy costs and inflation. I also think a lot of people were overweight miners because the fundamentals said to be overweight miners, but gold and silver had hit meme stock parabolic price actions and were exposed to a sharp mean reversion. A lot of us rode those miners on the way up to some huge outperformance.
My benchmark is the S&P 600, $IJR, which are small caps the S&P has screened for quality and profitability. It’s currently sitting a .84 PEG Ratio … the lowest it’s been since the 2022 bear market and the 2008 GFC. Well, well, well below historical averages. Seem likely profitable/high quality small caps are going to have a huge catch up trade or the analysts are going to to start cutting back earnings estimates on these companies because they’re way out over their skis.
My recent experience has been different, probably because one of my liquid U.S. models has a strong high-beta tilt. I would not read too much into such a short window, but it does look like factor dispersion has been extreme recently.
Up until 2025, I was mostly invested in classic Portfolio123 models, but I made some changes in 2026 and added AI-based models to my live trading.
I currently trade four models:
A small-cap AI model
A R1000 AI model
A S&P 500 AI model
A classic small-cap model that I launched in 2022
The two small-cap models are followed 100% according to their model signals. For the R1000 and S&P 500 AI models, I still make some discretionary adjustments since they are newer and I am still getting comfortable with the live behavior. The R1000 model is giving a lot of software names and the SP500 model currently recommends oil and tech names (it got me into Dell 2 months ago).
Over the last 5 months, the AI models have been the strongest performers. The standout has been my small-cap AI model, which I developed about a year ago and started trading live in May. I currently have about 30% of my portfolio allocated to that model.
So far, the early live results have been encouraging, but I still view this as a relatively short live track record. I am watching closely how the AI models perform across different market regimes before drawing stronger conclusions.
I had Claude look at the the data extract from a Rolling Test from the last 5 years of my microcap model out of sample. The exercise is to see if there were particular themes when the model underperforms SPY. My usual holding period is usually 3-7 months. I did two runs a 3 month period with a 1 month and 1 week offset. I typically don’t sell before I’ve held a stock for at least a month, but doing a weekly offset gave me more samples and I do rebalance weekly so I thought both would be insightful. In the end it didn’t really matter as the 1 week and 1 month offset were very close to each other.
The results were pretty much what I had intuitively suspected. My microcap model beat the SPY in ~87% of the samples. For my model, underperformance is generally always under some period of large cap dominance that everyone piles into that creates a sort of “liquidity” event for microcaps. Claude found that QQQ generally always does well in these underperformance periods. QQQ just had one of the greatest runs in its history bouncing off the Iran War lows. It’s not all that surprising I would have underperformed under this time. This was slightly different in that it was everyone piling into AI compute stocks instead of Mag 7. Summer 2025 was everyone piling into unprofitable meme stocks like quantum computing and nuclear micro reactors. Knowing the regimes your model underperforms means you can build complementary models. I guess if you built a momentum based model off a QQQ universe and added it in a book with my portfolio, it would have been a solid additive diversifier.
This is something I struggle with. As a discretionary trader, I’d typically have been trading the positions that are moving.
Trading the micro models that I do, there’s often a tinge of “missing out”, but it’s pretty easy for me to get past that–after all, there is a reason I wanted to pivot off discretionary trading.
The harder thing for me isn’t missing out on the names or determining if they would diversify — I assume so — it's that the models I have access to are either AI with short histories or vetted over an historically strong period, which makes them tough to trust. I’d love to find something I’d feel confident adding to my mix.
So far, I’ve been diversifying the micro models with various hedging techniques and cash, but the allure of adding a trend / large-cap type model is always there. Almost feels like a test of my willpower : )
About a year ago I added a derivatives-based fillip to my portfolios that performs well during the same periods that QQQ performs well. I called it a factor-reversal hedge, but that was a misnomer, because factor-reversal also happens during market crashes.
Out of sample it's done pretty well. But it is ruinous during downturns and requires hedging.
The XIRR of the fillip is 77%, compared to QQQ's 36% over the same period. Win/loss rate is 50%/50%; average win is 81% and average loss is 67%. These are all out-of-sample numbers. It's a pretty small addition to my portfolio, so it hasn't been terribly consequential. But it's been fun.
Interesting feedback from everyone. My experience so far:
US small/micro strategies started strong in 2026, but are now essentially inline with IWC benchmark (although this is historically overweight finacials and biotechs, which I am typically no or underweight)
The last two months have been particularly frustrating. Below is a rank chart for my US Microcap GUTS-Y strat for 5 year performance (top), compared to one month rank (bot).
Only 1 month, but the top decile underperformance looks right.
I’m using traditional ranking only. Despite experimenting with AI Factors the last few months, I still haven’t been able to find a strat that works consistently in a sim, results still quite noisy, compared to my other traditional strats.
As for my Canadian strategies – I still have a decent weight to gold and miners, so you can guess the performance there
One thing I’ve never been able to get to work is to feed a live portfolio/simulation history into Import Data Series and build a ranking system around low correlation
So for example if you took the top 100 positions in the public Core Combination and put it into a simulation and turned it into an “Index” of Core Combination. Exported out the portfolio dates and total long market value and fed it into Custom Data Series …
then you built a simple ETF ranking system favoring the lowest correation. Then you could screen for ETFs that have the lowest correalation with your portfolio