Recently I was reading through Alexander Elder’s book “Entries and Exits”, and it specified the 2% rule and 6% rule of risk management.
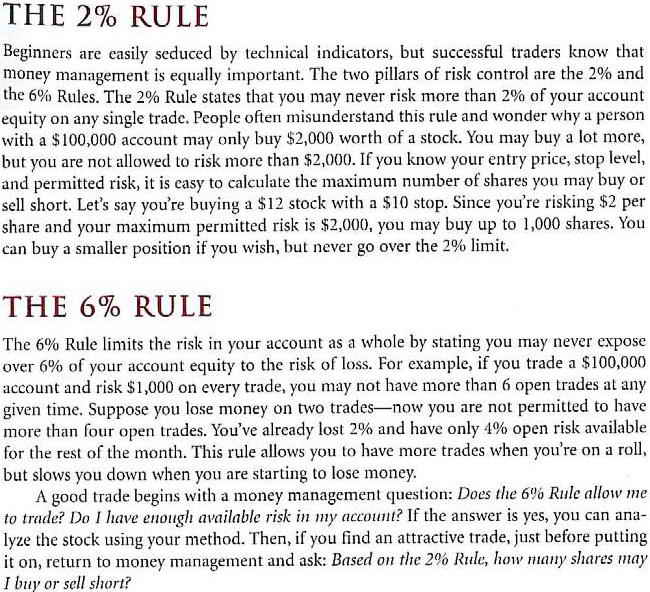
I’ve attached an image of the rules for you to read.
I use the 2% rule in real trading. It has been working very well.
To use this strategy, the entry price and stop-exit price must be chosen before placing the entry order. The initial stop-exit price can be calculated any way you want, e.g. 10% drop from entry price, or ATR based.
After a position is opened, over time as price increases, the stop-exit level must be moved up. When the stop-exit level reaches above the entry price then the amount risked for this position becomes 0. i.e. you are above the break-even point for this trade. This trade will either make money or nothing, but will not result in a loss. (Except if it gaps down, but that can’t be prevented).
The stop-exit level should never be moved lower. The worst case scenario is if the price doesn’t really move up and just heads down over time and the position gets stopped out - you lose a maximum of 2% of the capital you had when you opened the position. Losing only a small amount on any losing trade helps to minimise account drawdown, especially when there are consecutive losses (e.g. a bad day in the market).
I plan on using the 6% rule soon. I didn’t find the explanation clear enough, but after some time thinking I have an understanding of it. It needs a bit of initial spreadsheet setup work and daily recording to determine how much risk is exposed on a portfolio basis. This may be useful when the greater market goes through some turbulence.
It would be good to be able to simulate these position sizing/risk management strategies in Portfolio123.
There is a related feature request discussion here:
http://www.portfolio123.com/mvnforum/viewthread?thread=2411