When I change the Preprocessor Trim to 5% it is still showing Trim 7.5% on the Histogram pupop. What is beeing used?

The trim in the popup is for visualization purposes only and will not affect the AI Factor dataset
1 Like
Question for the experts: for the purpose of selecting a good ML feature (factor), if we are trying to determine a good trim percentage visually, what is the best practice for trimming the outlier bars? Should we be tweaking the trimming percentages (go from zero to higher up to no more than 15%) until the distribution looks as "normal" distribution as possible or is there a height of the trimmed outlier bars that is important; say it should be less than the height of sum of 4 bars next to it? Any pointers would be highly appreciated. Thank you!
I think there's an improvement here for P123. The trim should normalized. It should be standard deviations (ie. z scores). Numbers like 15% are really large, imo.
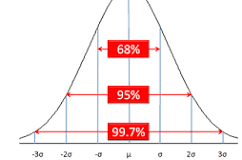
hope this help you think about it.
I'm defiantly not an expert but in a few research papers I've seen very low numbers like +/- 3 sigma used, very little trim.
2 Likes
The experts keep it to themselves ![]()
Our defaults are +/- 7.5% trim (before stddev and mean are calculated), then +/- 2.5 sigma clip after normalization.
I did a quick test using 2.5% trim and +/- 3 sigma clip and results were quite a bit better for extra trees (2% better on SP500), but signifcantly worse for xgb.
Then with a 10% trim and +/- 2 sigma clip the results were worse for both xgb and extra trees.
My quick test doesn't prove much. Perhaps that the 7.5% trim and the 2.5 sigma clip are probably ok as defaults. But certain algorithms may need more research since these settings are very impactful.
Unfortunately, due to the way we designed AI factor, to test different settings you will have to create multiple AI Factors.
Also, perhaps having more flexibility, like ability to use different setting for certain features that are more normal, could offer further improvements. For example returns could use a much lower % trim for example.
Marco and others who may be using trim for tree models (if I understand at all),
TL;DR: Non-parametric methods (like tree models) reduce the impact of outliers.
BTW, linear regression is a parametric method that I do not intent to include in this discussion.
Checked for accuracy with Claude 3: "You're correct that non-parametric methods like tree models are generally more robust to outliers compared to parametric methods like linear regression. This is indeed one of the key advantages of tree-based models".
I would be interested in understanding more about if (and why) trim is still used by members for the independent variable when using a tree model. I can see removing huge outliers in the target variable..
P123 already sets "Max Return" to 200% as a default, removing some outliers for the target variable when using returns as a target variable. I use that default for the target variable (dependent variable) myself.
Thank you in advance.
Jim
Max Return only affects Portfolio and Return reports under Validation Results to mitigate 'bad' data. Its documentation blurb has been updated accordingly.
1 Like
This is some insight from ChatGPT regarding the question.
Non-Parametric Methods and Outliers
1.	Robustness to Outliers:
•	Tree-based models (like Decision Trees, Random Forests, and Gradient Boosting Machines) are generally more robust to outliers compared to parametric methods like linear regression. This robustness stems from how tree-based models split the data at various thresholds, essentially isolating the impact of extreme values.
2.	Trimming Independent Variables:
•	Despite the robustness of tree models, practitioners might still trim or cap extreme values of independent variables. This is often done to:
•	Improve Model Stability: Extreme values can sometimes lead to overfitting, where the model becomes too tailored to specific anomalies rather than general patterns.
•	Enhance Interpretability: Trimming outliers can help in making the model’s decisions more interpretable by focusing on more typical ranges of the data.
3.	Target Variable Considerations:
•	When dealing with returns as the target variable, capping extreme values (e.g., setting a maximum return to 200%) can prevent the model from being overly influenced by rare but extreme outcomes. This practice helps in stabilizing the predictions and ensuring the model’s performance is more consistent.
Practical Implications
1.	Tree Models in Stock Ranking Systems:
•	In a stock ranking system, the independent variables could be various financial metrics and fundamental indicators. While tree models handle outliers better, removing or trimming extreme values can lead to more stable and interpretable models.
•	For example, an extremely high P/E ratio might not provide meaningful information and could skew the model’s decisions.
2.	Dependent Variable (Returns):
•	Trimming the dependent variable, such as capping returns at 200%, ensures that the model does not focus disproportionately on outliers which could be the result of unusual market conditions or data errors.
Conclusion
While tree-based models are inherently more robust to outliers, trimming independent variables is still a common practice to ensure model stability and interpretability. Capping extreme values in the target variable helps in creating a more reliable and consistent model, especially in financial contexts where outliers can significantly distort analysis and predictions.
1 Like
I think I agree with trimming the target variable at 200% As I said, I thought I was doing it above, in fact. I am grateful for Aschoff's post correcting me on what I thought was happening when I use rank:
Thank you Aaron!
Fair enough. But what is meant by extreme? If I trim EBITDA/EV by 15%, I am removing every single stock I would be buying with using P123 classic. Maybe just me but I think I want to know (by training an ML model) what those stocks that I have been buying with P123 classic will be doing.
I have to remove the top bucket for every single feature I use (with 15% trim and 200 buckets) to get good results with ML? Okay, I'm going back to P123 classic if that is the case.
I use ranks, where there is not even an option to trim the independent variable or the target (that I can see). I would prefer to be able to trim the target if I were asked.
Z-score may not be important to me at this time (who knows next week). But personally I would not trim the independent variable with tree models but I would want to at least have the option of trimming the independent variable with linear regressions. I certainly do not mind having the option to trim the independent variable. Actually it is a good option to have, I think.
Bob, I think I agree. I had not really thought about your post at the time
So my personal opinion. For tree models you are just trying to get rid of any anomalies. Meaning something that will be unlikely to ever happen again or an error in the data. 3 sigma is a pretty good number to accomplish that if you are not going to analyze each data point to see if it is a one-time event or a data error.
Linear regressions are different--in my mind at least--because the extreme values often have an undue influence on the slope. The technical term for this undue effect of outliers for linear regression is “leverage” or “influential points” as I am sure you know.
Jim