Another nice feature. Thanks!!
I have not explored charting in P123 yet. Is it possible to create charts like these for indexes or ETFs?
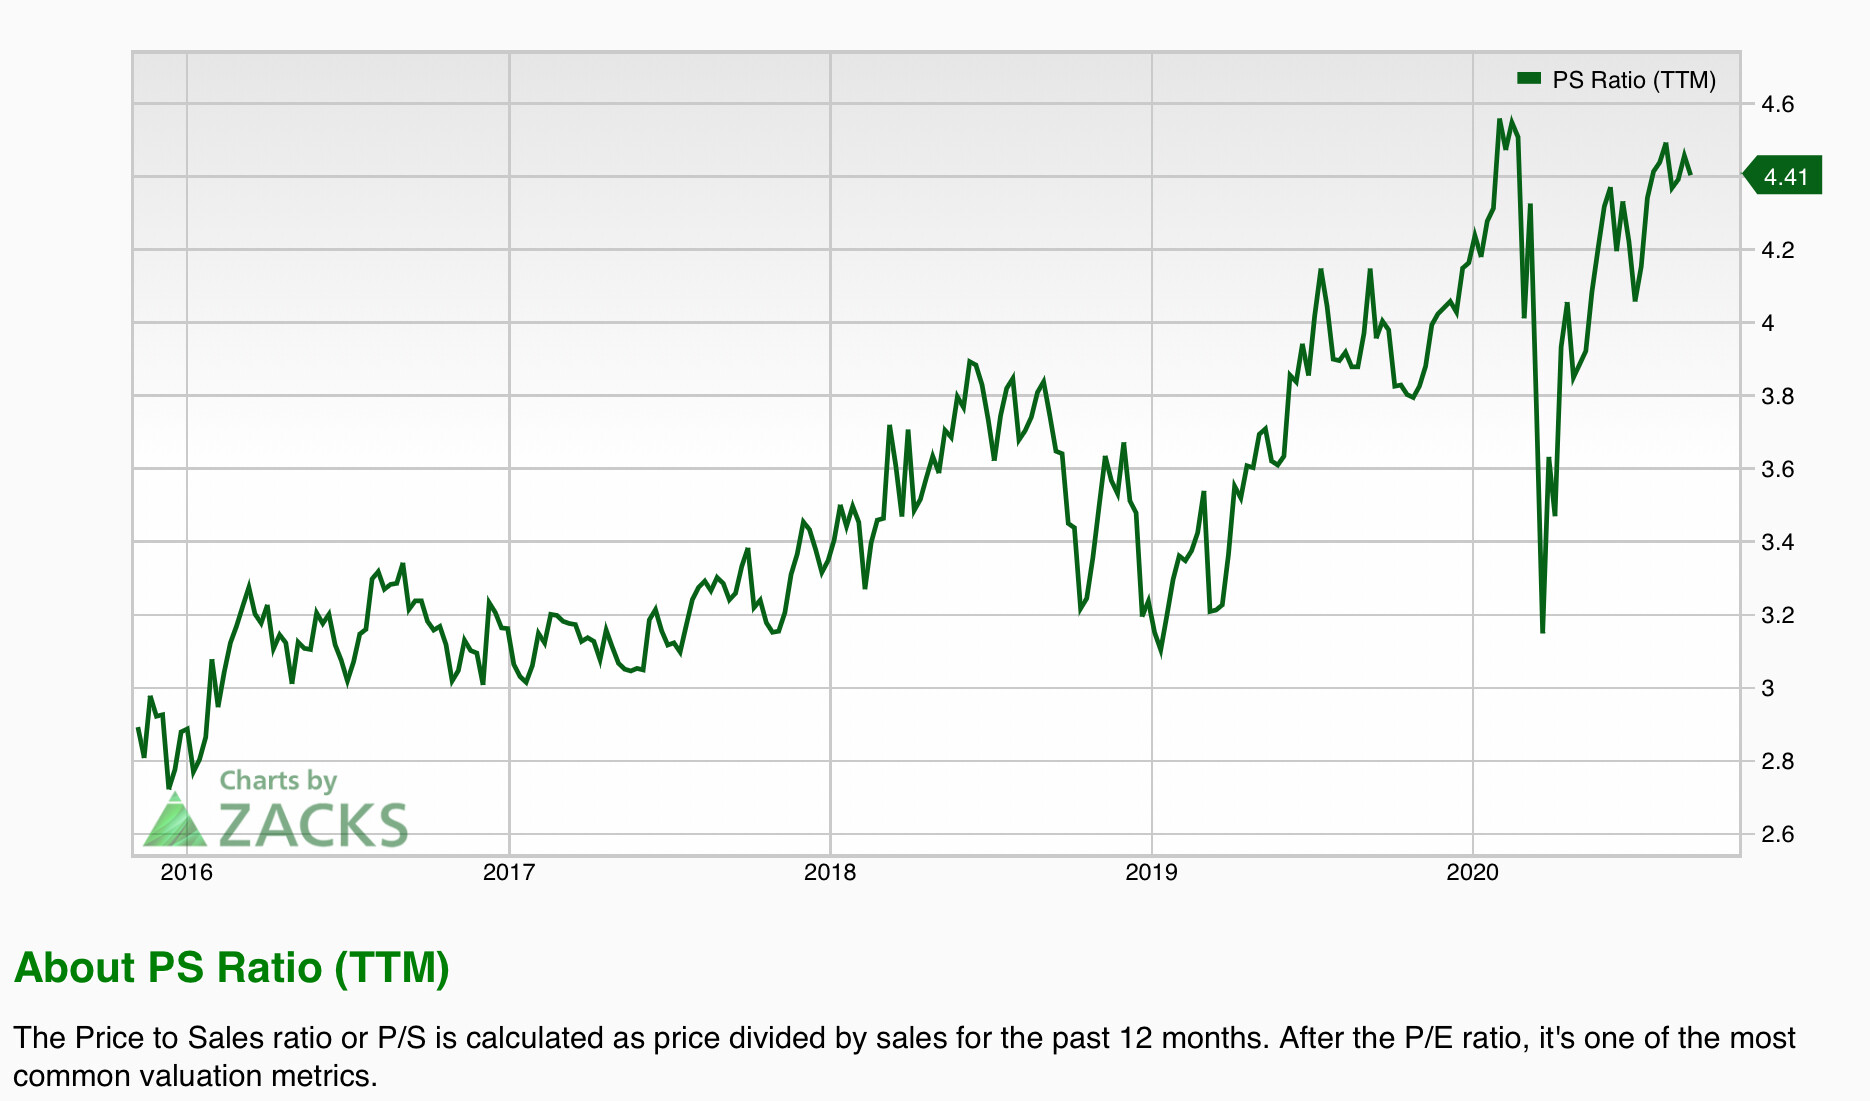
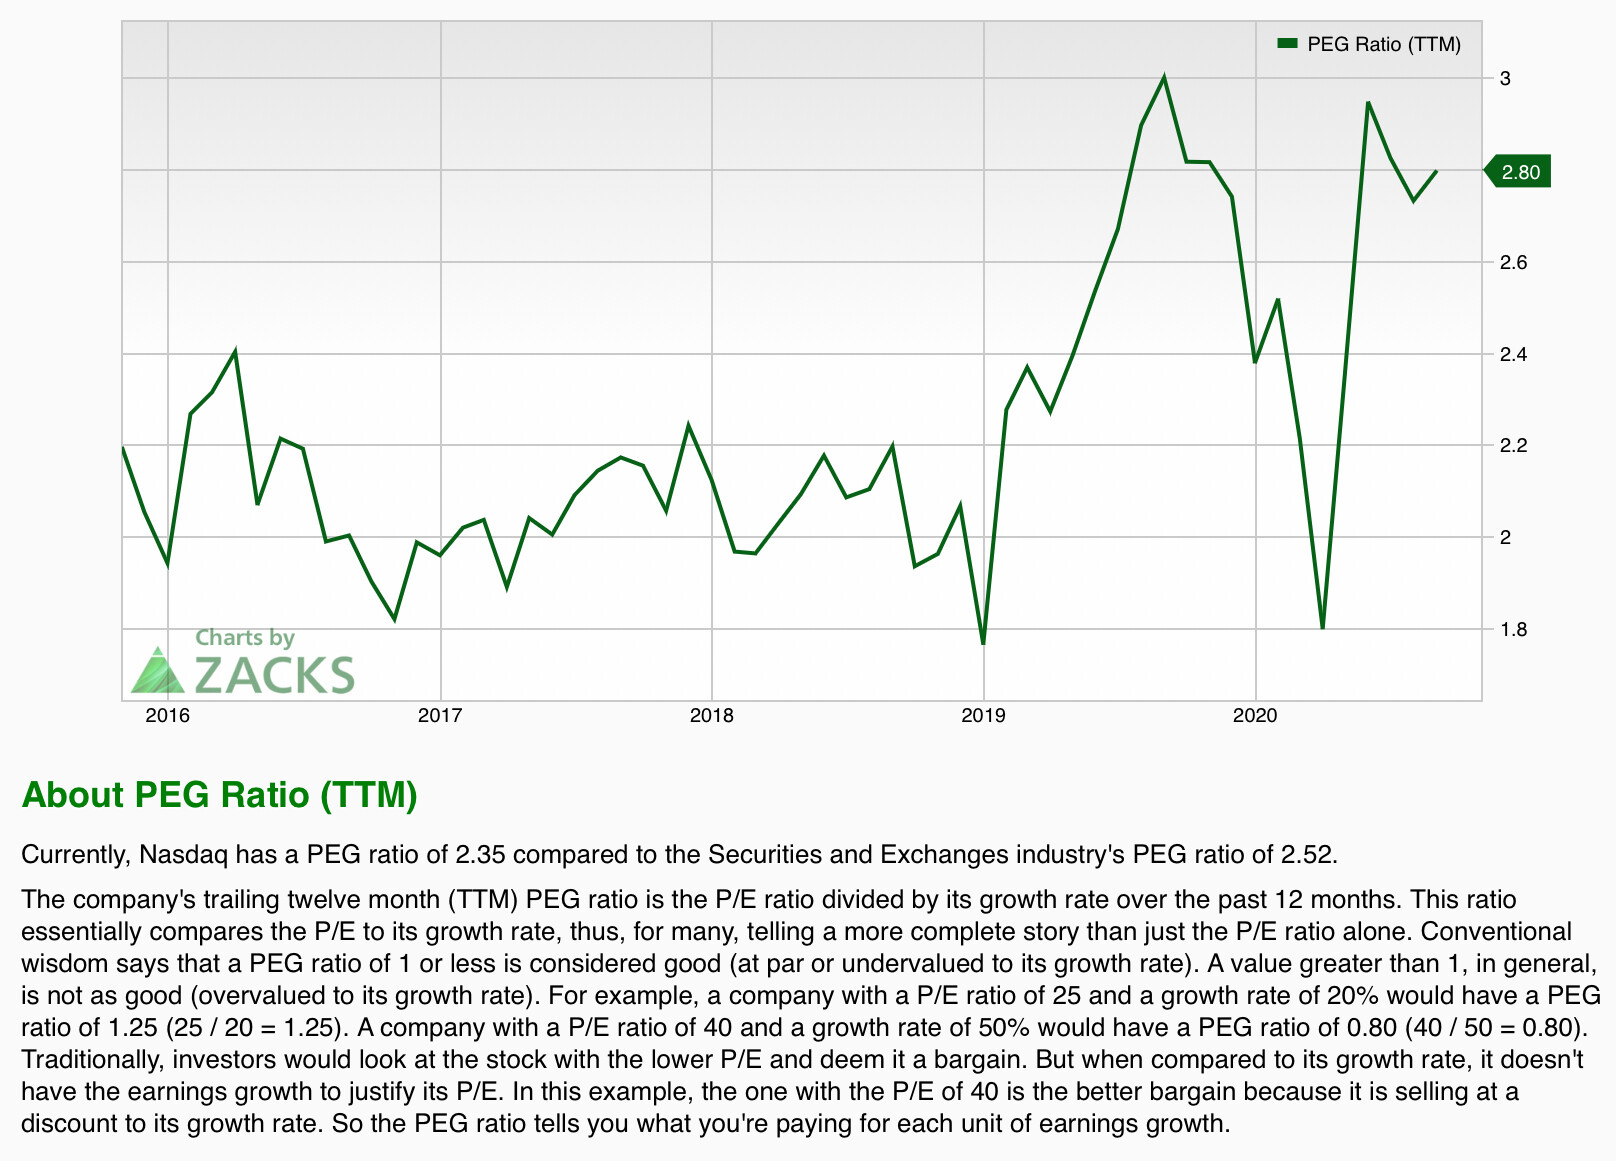
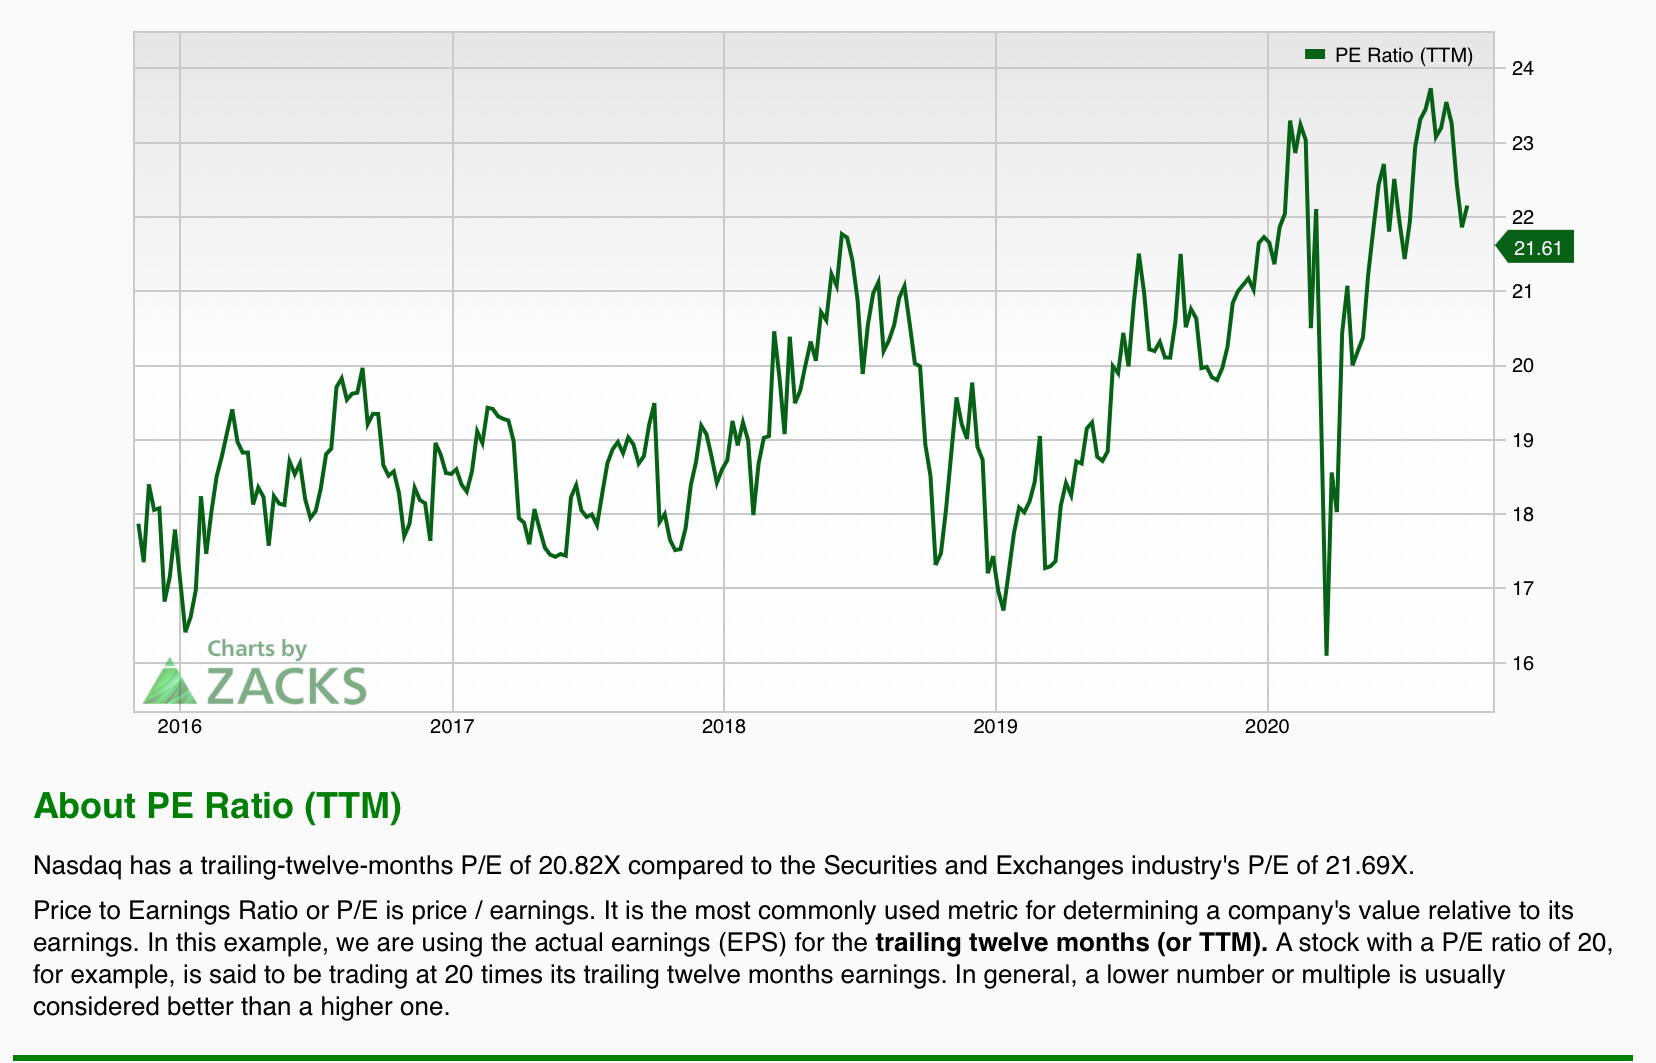
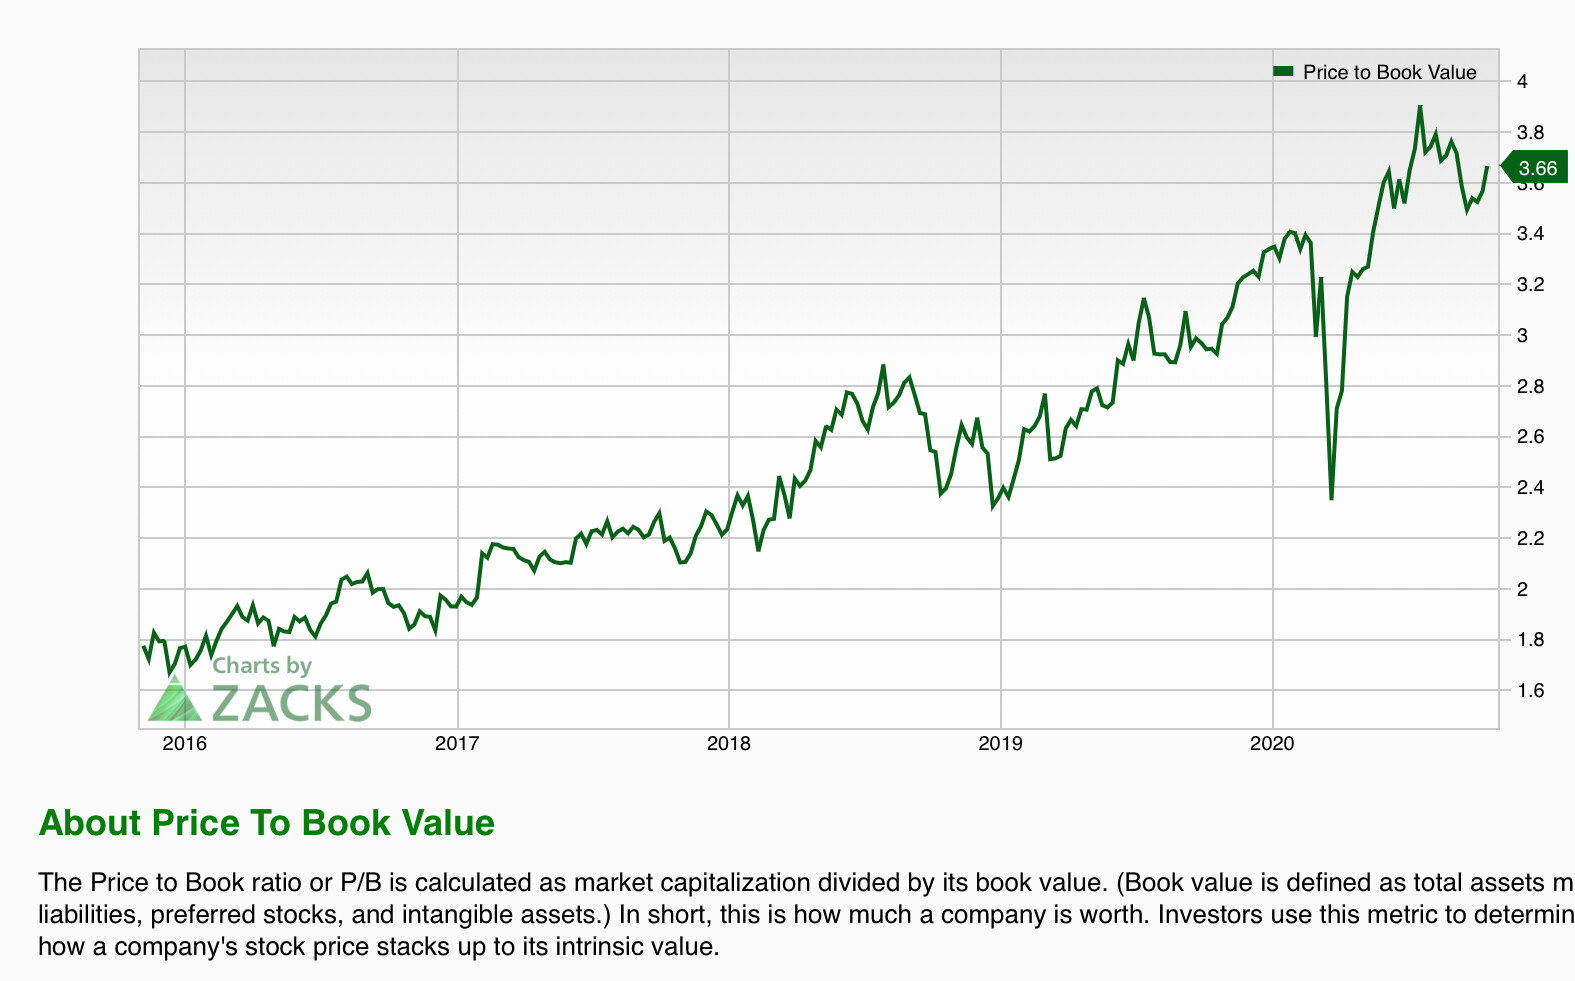
These are all for the NASDAQ:
Not using the Fundamental Charts, but using Aggregate Series. See https://www.portfolio123.com/doc/side_help_item.jsp?id=32 . . . (Aggregate Series used to be called Custom Series.)
This is great - but how do i do multiple items on the same graph? Like Marco’s example in the 1st post?
Click on the diamond-shaped icon that looks like four arrows emanating from the center. You can then move the items in one plot to another. You can then click on the Axis button to choose whether you want the plots combined, independent, or normalized.