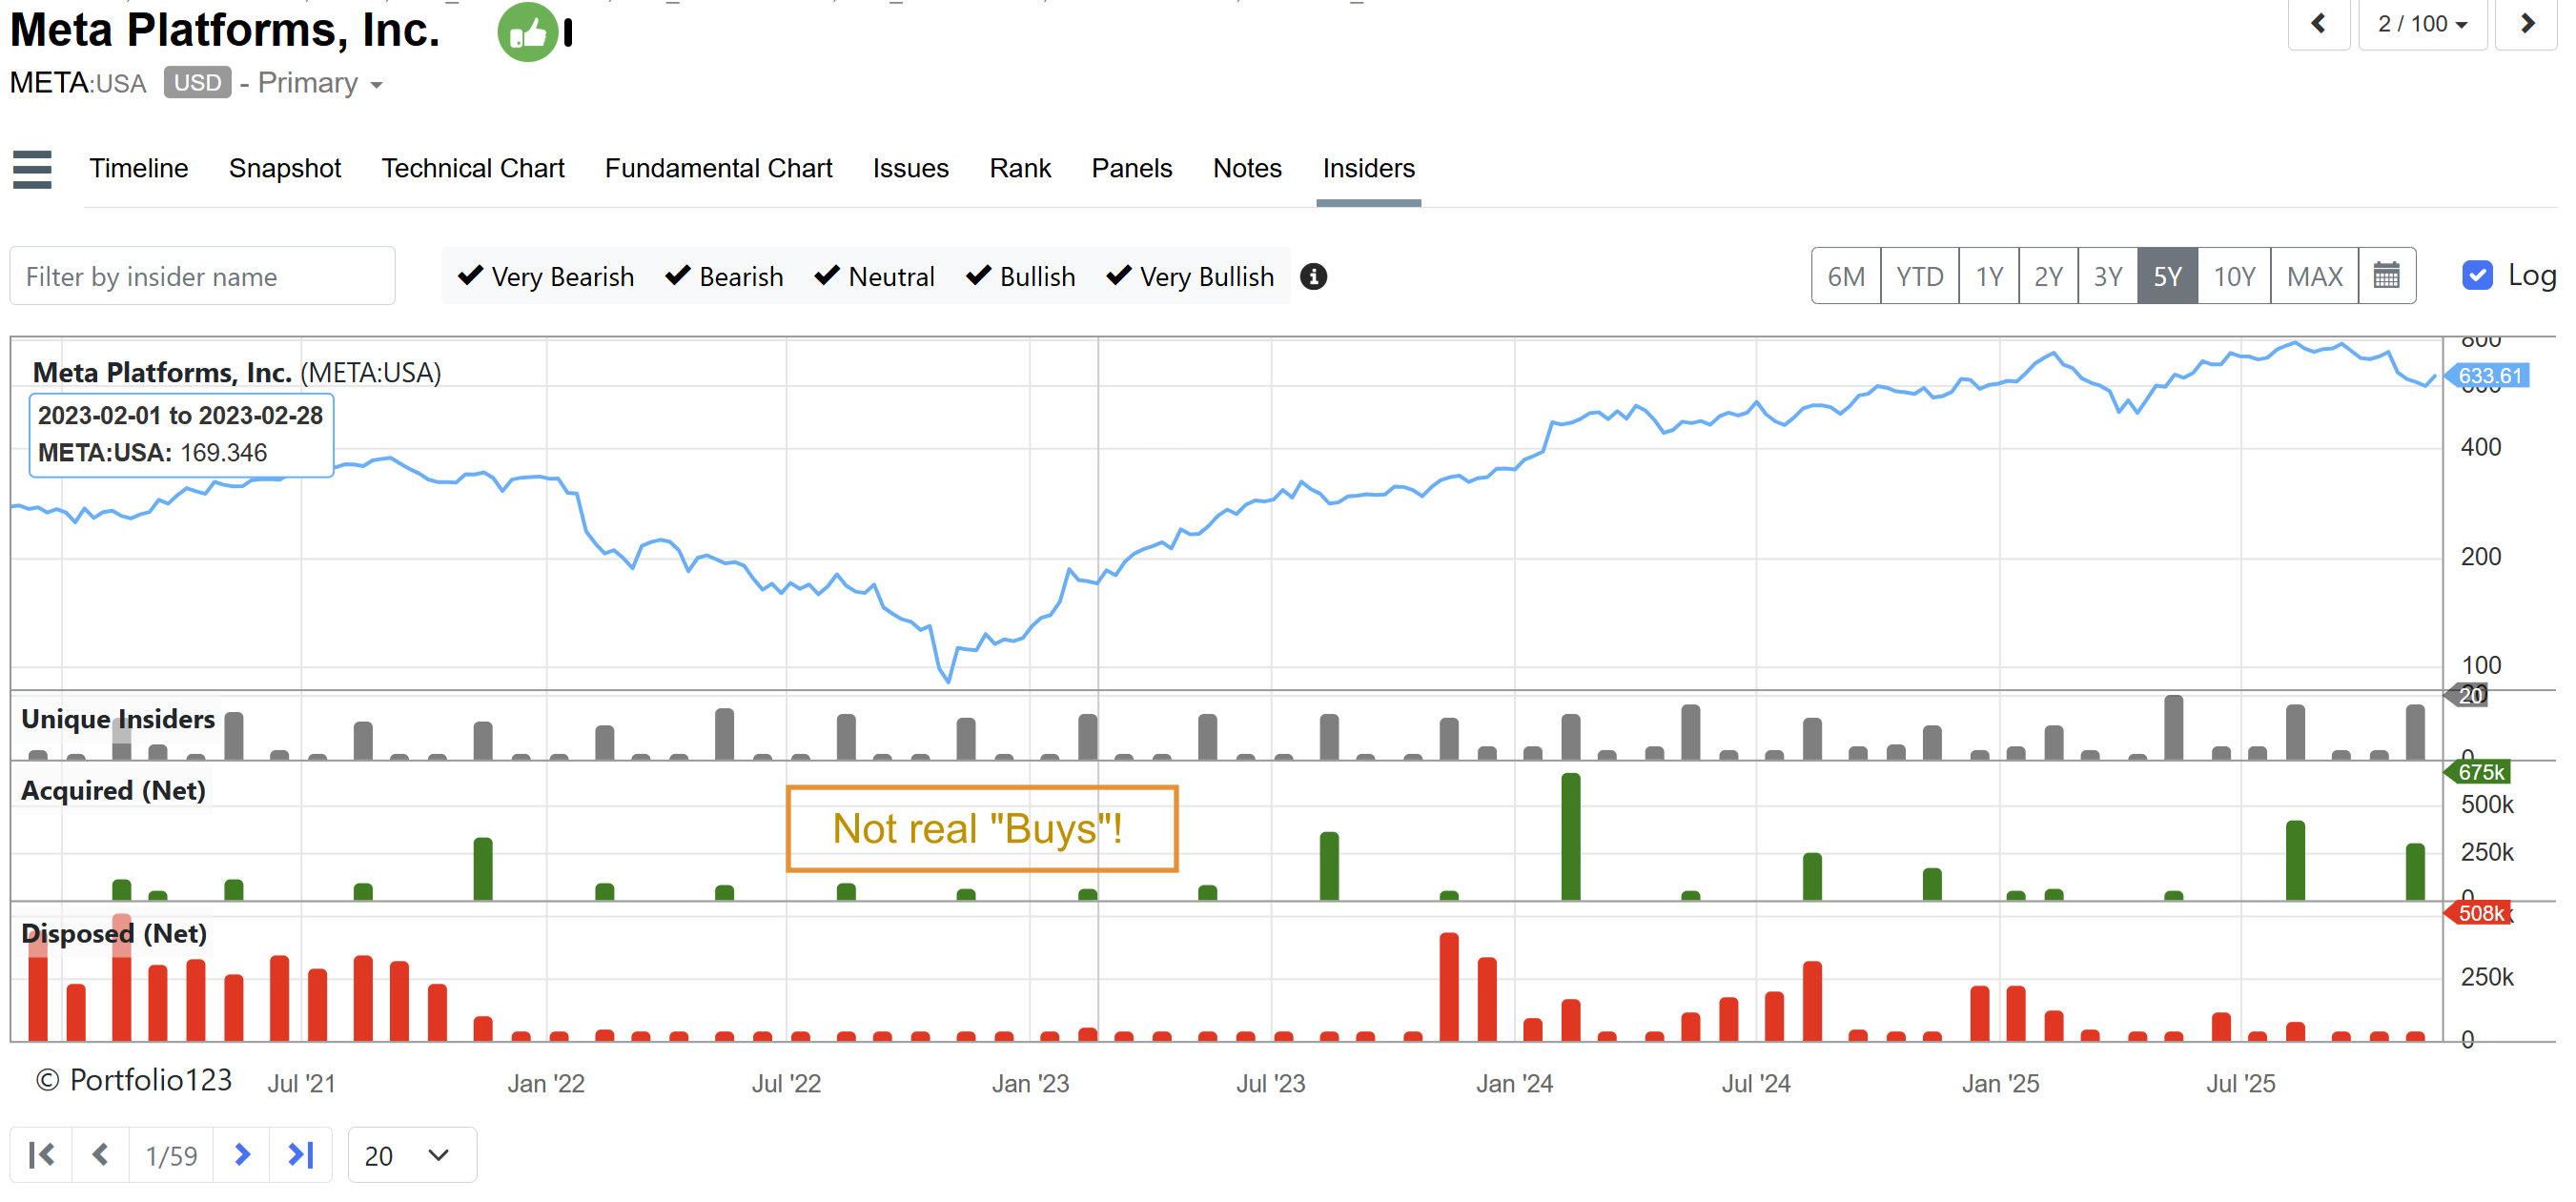
Most of you already empirically know that our insider buying/selling aggregate statistics are completely useless. They are computed by our data vendor in some naive, legacy way. We're not even sure exactly how they are calculated, and what is considered a buy or a sell. For example just screen for stocks that have a high number of insiders buying with this rule InsBuyTrans > 20
Right now it returns stocks like META, with 33 insiders “buying” in the previous 6 months. But they are not buying squat. They are either converting options or stuffing themselves with awards. Sure, their overall # shares owned may be going up, but it’s not costing the insider anything. It’s a completely useless data point if you are trying to gauge their sentiment. (META still a buy though in my opinion)
We’re fixing this!
We have been working on processing the transaction data in an intelligent way. We’re taking the individual filing transaction data, we then aggregate by filing and calculate the overall share change. Finally we go through some custom logic that looks at several things (type of transaction, % of total owned, etc) and assign a rating from 1 - 5, with 1 being the most bullish.
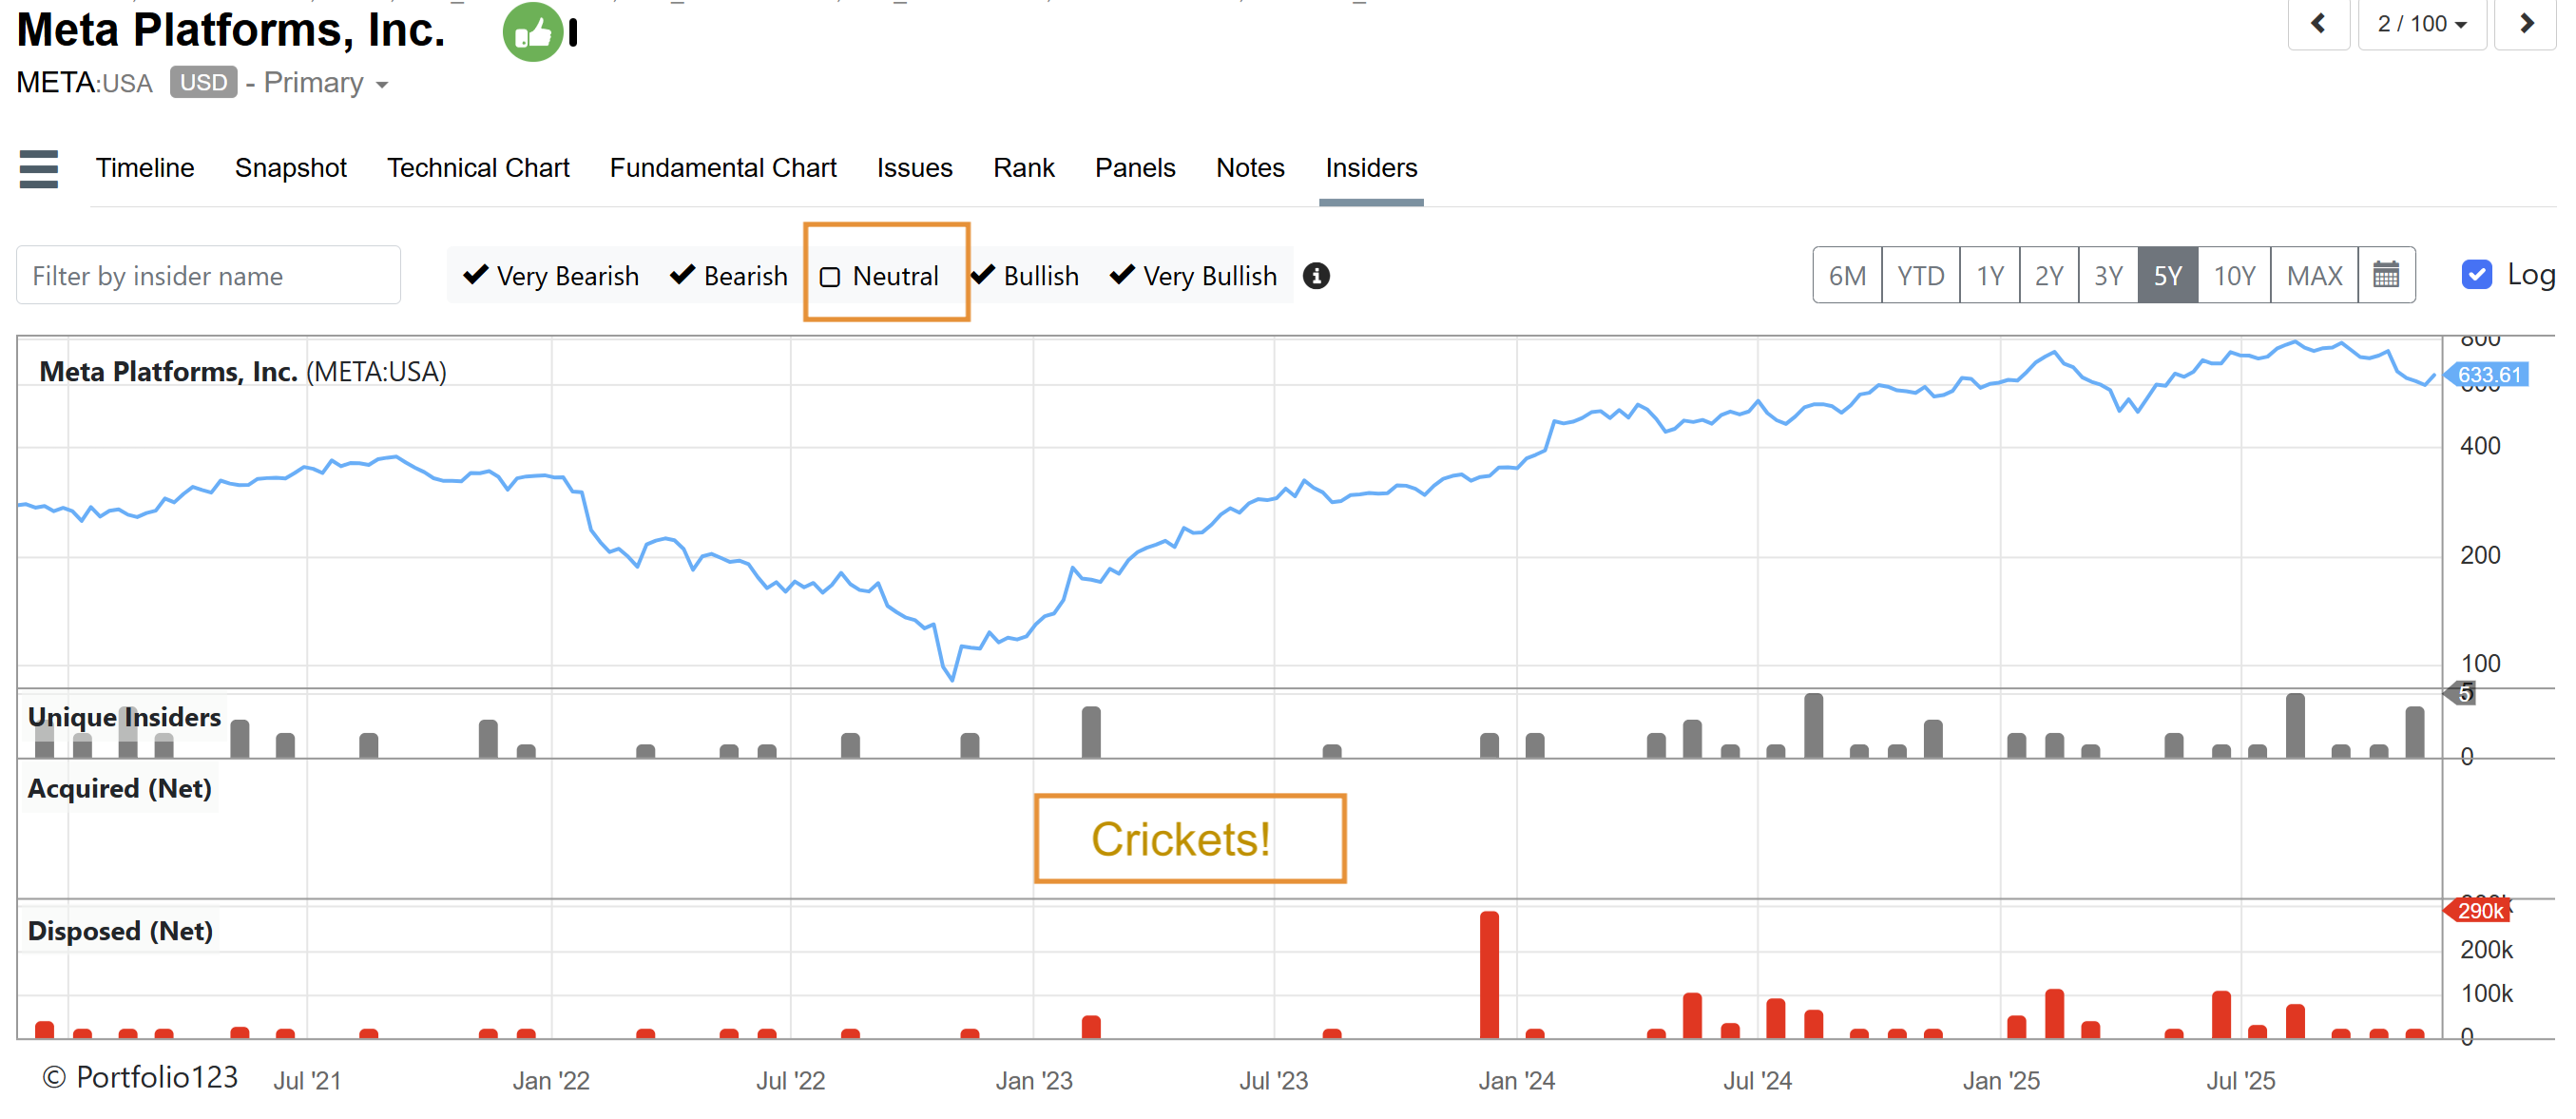
Here’s how META really looks once the “Neutral” transaction (like awards ) are excluded: nobody is buying!
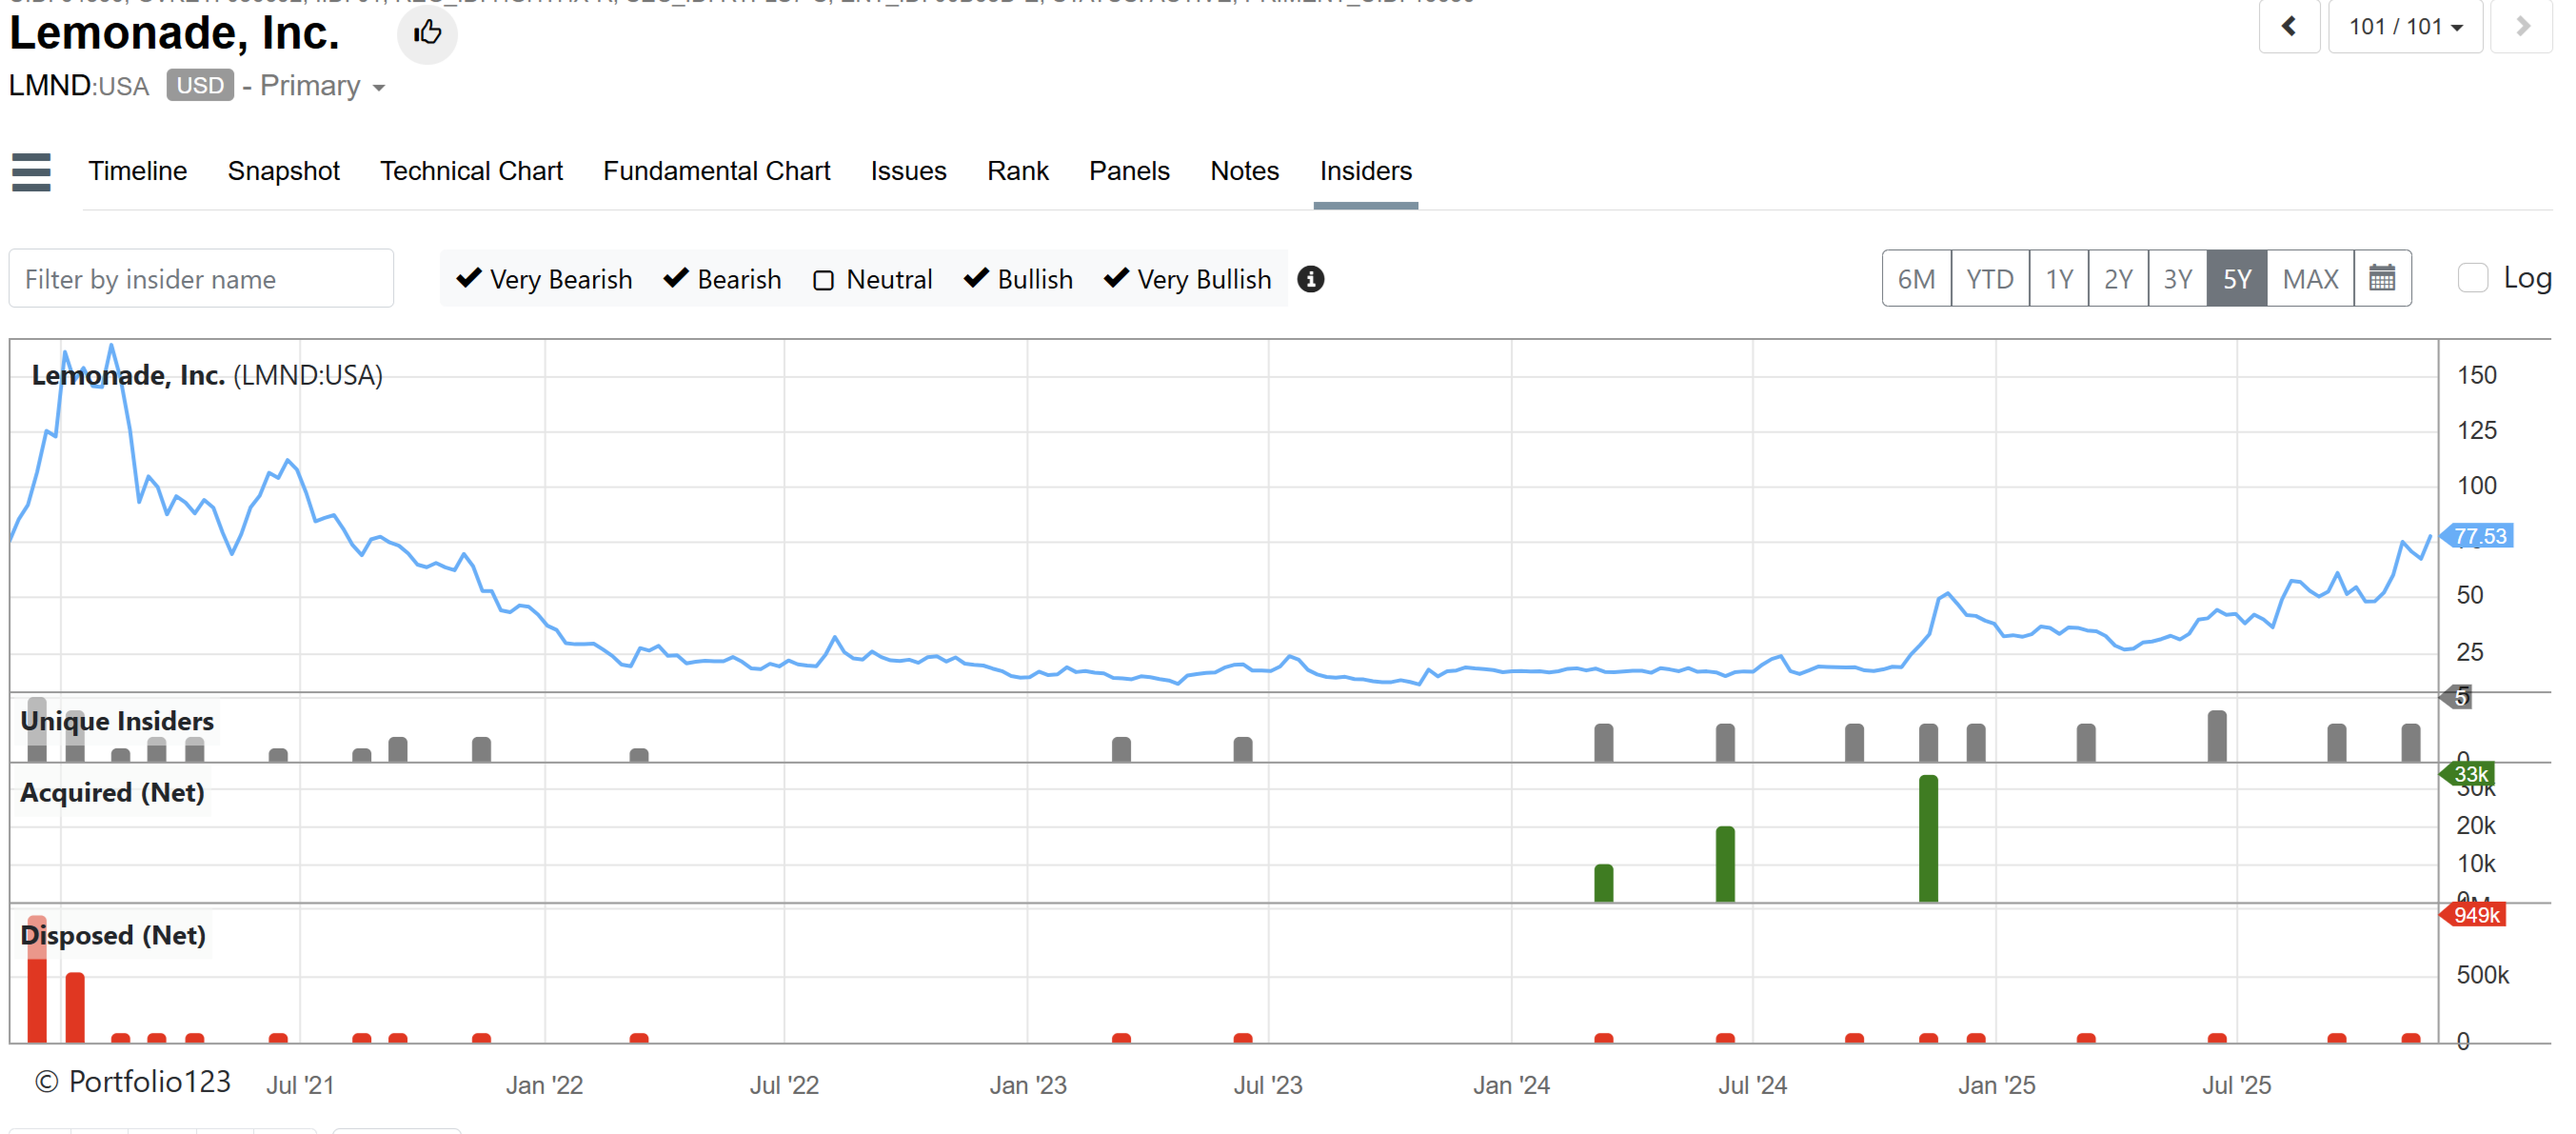
Here's a nice example of real buys/sells using our new rating. It shows a lot of selling around the $150 level when LMND had the IPO. Recent real buying started showing up preceding the recent run up.
We plan to release the new insider chart next week. The new data points will be available for backtesting hopefully by January. So next week only the chart will display this new data. Incorporating them in the backtest is more work. We also hope to get some feedback from you before we launch the ratings and other new insider functions in the engine.
FYI, this are related old posts about insider data. Let me know if I missed some. And let us know what you would like to see in terms of functions with the new metrics. Thx!
Does the insider transaction source you’re building this from include the role of the buyer/seller? If so, it would be nice to be able to build a factor filtered by role, specifically for CFOs, as their purchases may be more informatiive. See Are CFOs’ Trades More Informative than CEOs’ Trades?
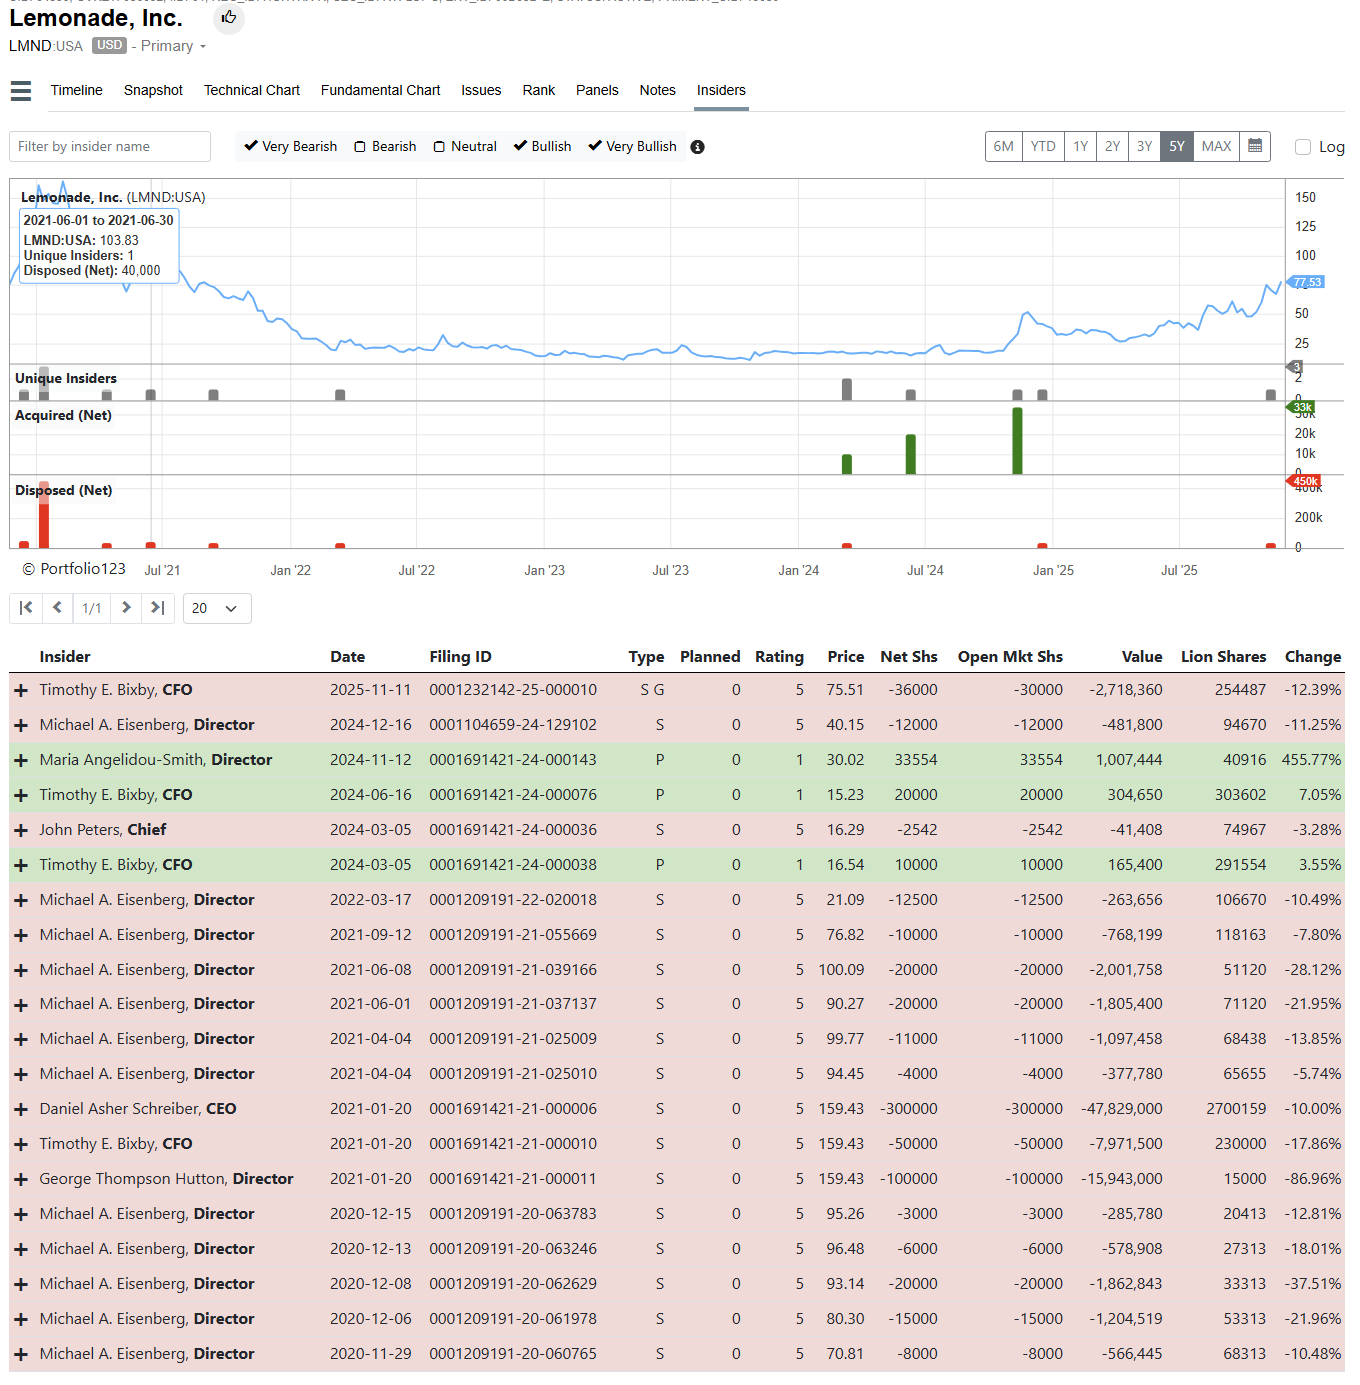
Yes, see below for a full screenshot. Not 100% reliable though since it's not a very smart parser from FactSet. A notable issue is with PLTR for example. FactSet is reporting the insider title in this transaction as "See Remarks". A much smarter, LLM powered parser would be required to catch the correct title in this example.
I’m delighted to see this Marco. I’m not sure from your post which data points will be available. I’d like to look at things like insider job title, the amount traded and the amount traded as percent of existing holding. Also, will this include European stocks?
Marco, if I recall properly when I looked at this several years back I remember insider net selling was positively correlated with returns. I think I interpreted it as insiders getting stock rewards and selling them when company was doing well and many people making bonuses. Don’t think I ever was able to integrate most of the insider activity into any rankning system though.
It is a bit contextual. Just remember correlation and causation might not always be the same. Some high fliers will indeed have a great run while heavy selling takes place like say Palantir. Keep in mind one could use it cross sectionally yes, but also compare it to each stock’s usual behavior and in different contexts
New insider page is live. Working on documenting how our rating works and the formal announcement. Your feedback is valuable: this is a trial period to nail down the logic of our rating before we add it to the backtest engine.
Nice. Insider Factors and Formulas still follow the old methodology though (for now), did I understand that right?
Add some documentation, especially for the “Type” abbreviations and the “Rating” and imo the page is good to go.
A nice (optional) thing would be if one could toggle the Acquired (Net) and Disposed (Net) scales to show either Volume (Shares), Dollar Volume or % of Float
PS: “Net” means per unique insider right? So if one Insider disposes 1000 shares net and another one acquires 1000 shares net both will show as bars in the respective charts, right? Or is it “global net”?