For those who are trading live small cap and micro cap portfolio. Have encountered liquidity problems on these, especially when going with large sizes. What mkt cap or avg volume would you consider tradable when going for example with 500k to 1 M size per position?
Please see: https://quant.stackexchange.com/questions/38242/optimal-execution-of-illiquid-securities
A good rule of thumb is to not exceed daily volume by more than 1%. Once you exceed that threshold, you will want to split your order and attempt to not remove liquidity. Passive VWAP (best efforts) is fine if you need guaranteed execution (but I guarantee that it will cost you). Also if you need a fill and price is moving away from you, its usually better to aggressively cross the bid/ask than to wait for your offset order to fill.
If, however, you are willing to forego fills and assume greater execution risk, there are many additional options. Personally, I’ve been as high as 10% in a day without noticeable slippage, but in order to achieve this, I was willing to forego getting filled.
Robert Almgren has written many of the the authoritative papers on optimal execution and transaction costs under static control.
Charles Albert Lehalle is considered a leading expert on optimal execution under dynamic stochastic control.
Same here. I’m reluctant to go higher than this, but so far I’ve had no issues.
Thanks David!
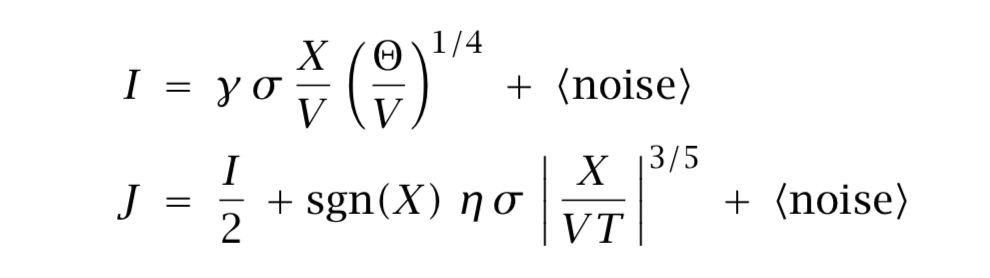
Here is a link to one of Almgren’s papers. Here. Also I have included an image of the formulas. You will need to go to the paper to find the definition of the variables.
The top formula is the “permanent market impact.” Whereas, the bottom is the temporary impact. For me, the temporary impact has no meaning as I can always make a limit order and prevent any temporary impact beyond the BID/ASK spread. Also, I have tested my temporary impact empirically and I know my temporary impact with good precision.
So I am left using the top equation to determine the permanent impact with split-up limit (or small market) orders that control the temporary impact. This PERMANENT IMPACT is where any MARKET IMPACT by me is realized. Remember the top equation gives the marginal impact of your last trade. This is linear so the total permanent impact–of all of your trades–is half of this (well described in the paper).
The calculated permanent price impact on the last stock traded gets added onto the temporary slippage to know when it is too expensive to keep trading.
While this equation may seem onerous you can enter it into a screen once with ShowVar and get an instant calculation for any ticker you want.. I use the average of the daily volume for the last 5 days. I would be interested in what other people use.
σ =PctDev(30,1) for P123 if you use the screener and want the Percent deviation for the last 30 days. The rest is self explanatory from the paper, I think.
And actually, I use: showvar(@perm, (DOLLAR VALUE OF SHARES/(close(0)avgvol(5))).314PctDev(30,1)(float*1000000/avgvol(5))^.25)
In a separate line in the screener you will have: ticker(“XYZ ABC ETC”) and just enter the stocks you plan on trading for the day.
You will enter your own dollar value that you want to trade for that stock on that day. @perm stands for the marginal permanent market impact. I.E., the increased price of you last stock you trade that day in percent.
If the equation is correct, then permanent market impact is not as significant as I once feared. I don’t have a lot of empirical information yet.
Again, thank you David.
-Jim
Jim,
My pleasure.
I liked to combine an the Yang-Zhang OHLC volatility estimator with the aforementioned Almgren impact model. The reason is that it gives me greater confidence in a model which is calibrated over shorter time horizons because it makes the most use of available data. Maybe it’s overkill, but it’s also just sorta my hobby to overcomplicate things.
Also, permanent impact is very hard to measure. Basically, it’s trying to assess how much share prices change in things we buy versus don’t buy.
Yes,
Thinking of how to do it I considered comparing the change in the price of the stocks I bought in a day to the ones I already held in the port. I think it would take too long to get good data—for someone as impatient as I am. And too much noise in that data even if I were patient.
And in the final analysis stocks you are buying and stocks you are holding may not even be comparable. They may behave differently for reasons other than market impact.
So yea. Very hard.
-Jim
So if Charles-Albert Lehalle is an expert (he is, no denying that) I thought I might refer to one of his texts to answer a question.
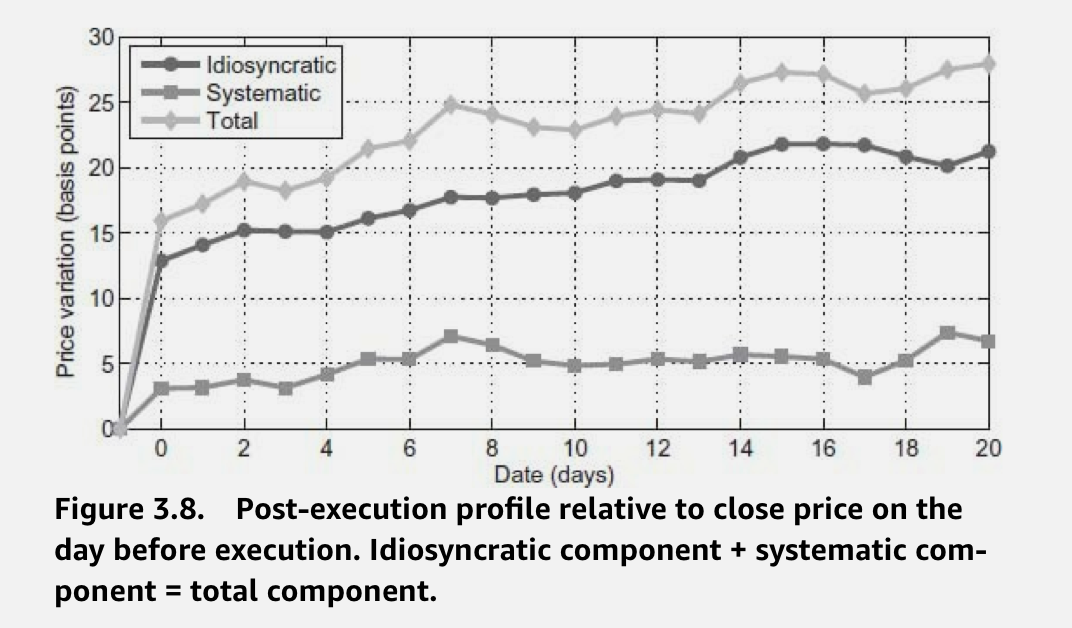
I specifically wanted to know how permanent is permanent? Can I come back the next day when I have stopped trading because I have had too much permanent impact with my trades on the first day?
Answer: Not so much (if the text is right). For stocks with a valid signal the price never comes back. Permanent is permanent. See image.
This portion of the text based on research by: [Bacry et al., 2015]
Charles-Albert Lehalle. Market Microstructure in Practice (Kindle Location 3155). World Scientific Publishing Company. Kindle Edition.
-Jim
Jim,
Very interesting graphic.
I was wondering about how differentiate between returns due to a model versus returns due to impact.
The underlying problem is reminiscent of the Joint Hypothesis problem: You can’t know if a model was right about price increasing or if a model caused price to increase. But it seems like Lehalle thought about this already.
Thank you for sharing.
//dpa
Look at the median daily dollar volume measured over the last month, quarter, and year, and choose the lowest of those numbers. Don’t buy more than 50% of that. So for a $1 million position, you’d want the minimum median daily dollar volume to be $2 million or higher. Build up the position over several days if you think that’s better. But make that your limit because you don’t want to encounter liquidity problems when you sell.
I currently use a buy rule that requires an intended purchase to be less than about one percent of the stock’s minimum daily dollar volume of any day in the past 3 weeks, as in:
LoopMin(“Vol(CTR) * Close(CTR)”, 15) > TotMktVal/30.0*100.0 // Liquidity check
Where TotMktVal is the portfolio total value and 30 is the targeted number of positions. The percentage of daily dollar volume allowed can be adjusted by varying 100 in the formula. This is a bit more restrictive than comparing a purchase to the average daily dollar volume, which is what I used to check. An average could be significantly bloated by extreme transactions, so I am now testing the minimum during a period. I have no idea what “optimized” values would be for percent of daily volume or the best number of trading days to check! I just have confidence that I can probably make the purchase easily and I won’t drive the price up significantly. And the calculation will adjust as the port’s value changes, so if I am lucky enough for the port to steadily increase, it will require more liquid stocks. If the port loses money or has a small value, less liquid stocks are allowed.
What I haven’t convinced myself to do is allow unfettered access to micro or nanocaps. So I still have a lower market cap limit as well as the daily liquidity check. I am slowly reducing my minimum market cap as I watch how the transactions go.
Very interesting post. Thanks, David.
Buys net of sells, VWAP orders on relatively liquid stocks have very minimal slippage vs. the close. Therefore, when building models on P123, I always choose “Next Day’s Close” as my assumed transaction price. I am very comfortable with fixed slippage of 0.1%, as this is MUCH larger than what I normally see and serves as a worst case scenario assumption.
P.S. VWAP is not guaranteed to execute if you put a volume max restriction on it.