Problems with Kelly Betting

I find Kelly betting interesting. Usually (maybe always) the formula really does not work for stocks. Here are 3 formulas.

Kelly #1: x = p - q/(W/L) = (pW - qL)/W
Kelly #2: x = (pW - qL)/(WL)
Kelly #3: x = (p
W - qL) / {pS2(W)+pW2 + qS2(L)+q*L2}

where
W = average of the Winning returns
L = average of the Losing returns
S(W) = Standard deviation of the Winning returns
S(L) = Standard deviation of the Losing returns
p = probability of a win
q = 1 - p = probability of a loss

Here is a link with a calculator for the first 2 formulas: Kelly Ratio

The first only works if you have predefined wins and losses that are aways the same: like at a Blackjack table. Also, it assumes that you lose your entire bet–again like at a Blackjack table.

The second works for average (partial) losses and average gains but of course we have a range of losses and gains.

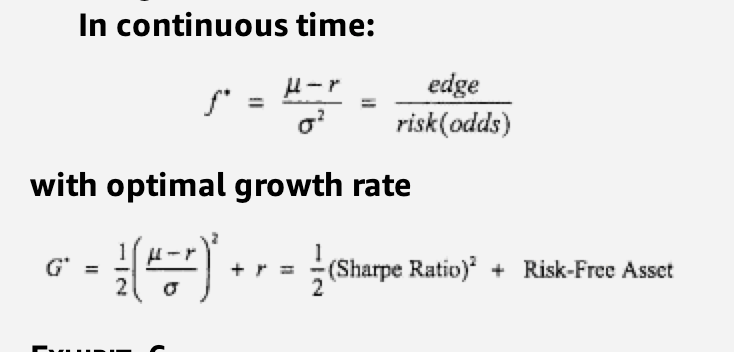
The third uses the normal distribution to calculate optimal Kelly based on past results: the mean and standard deviation.

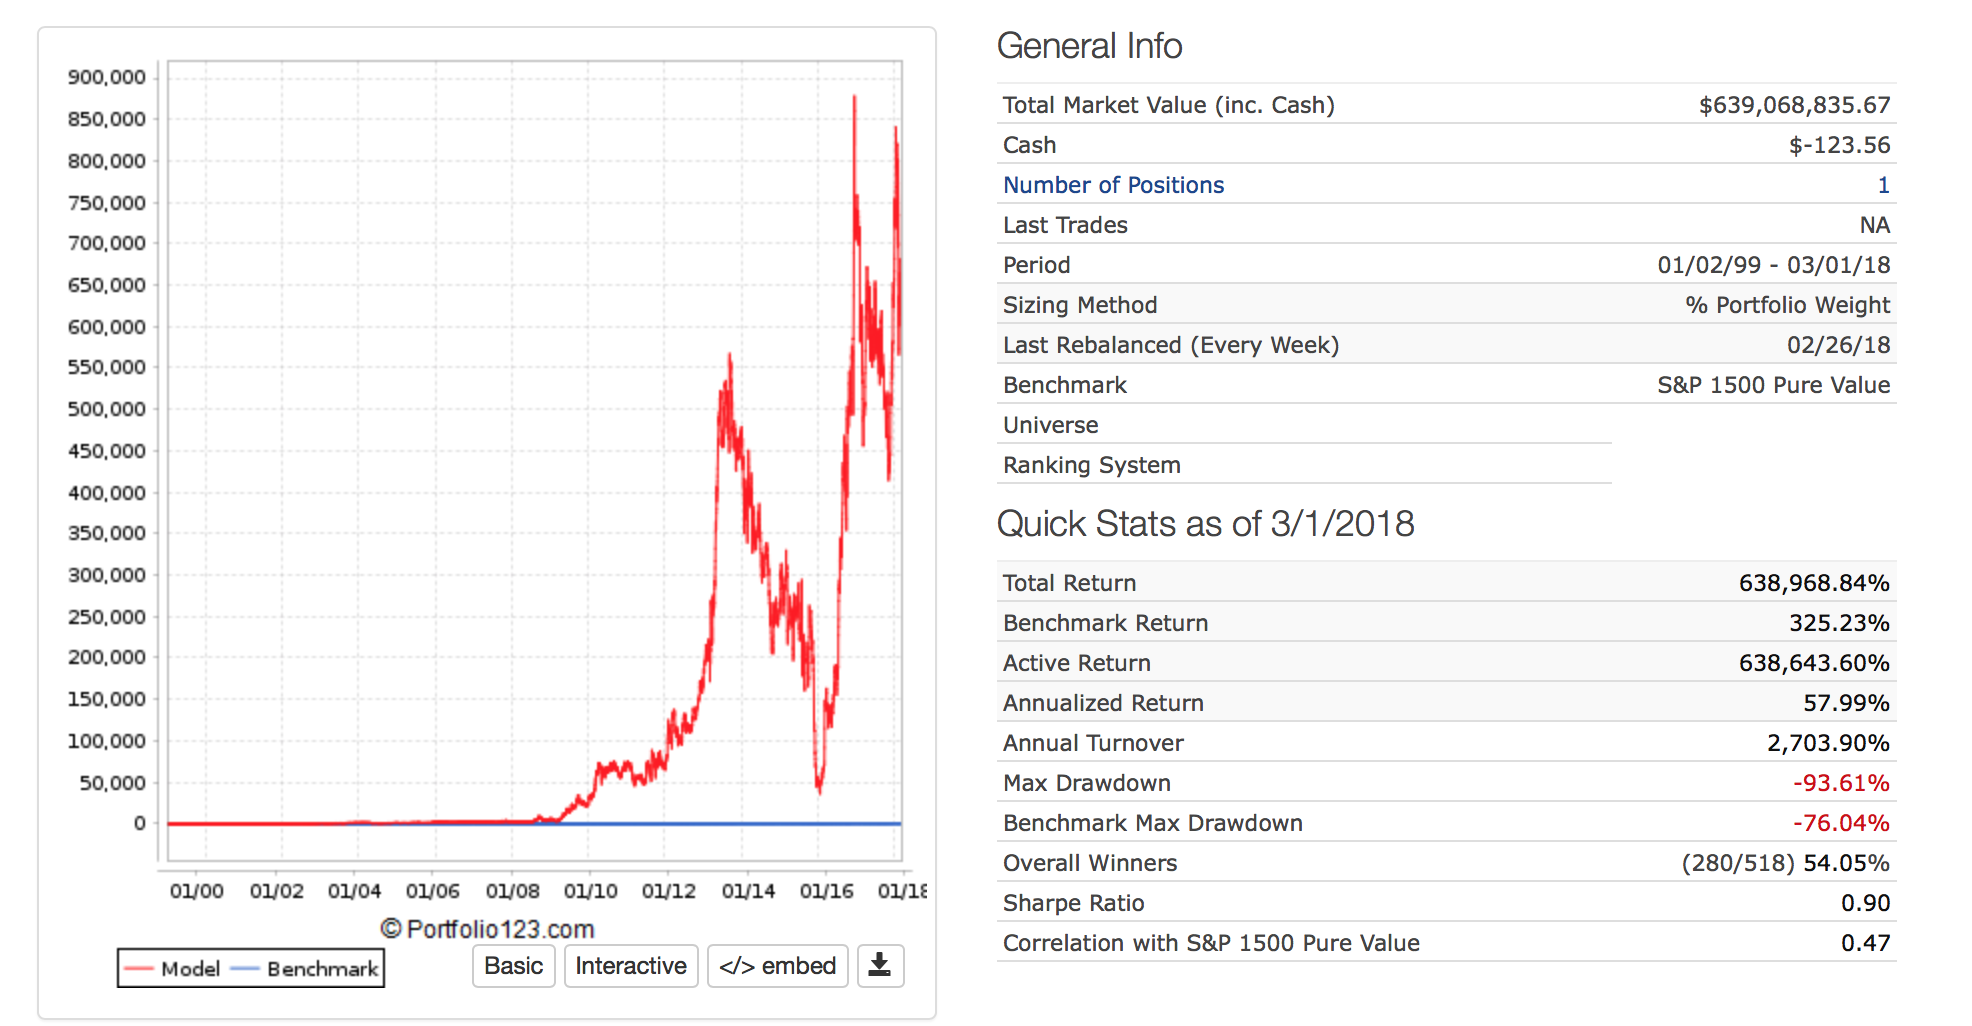
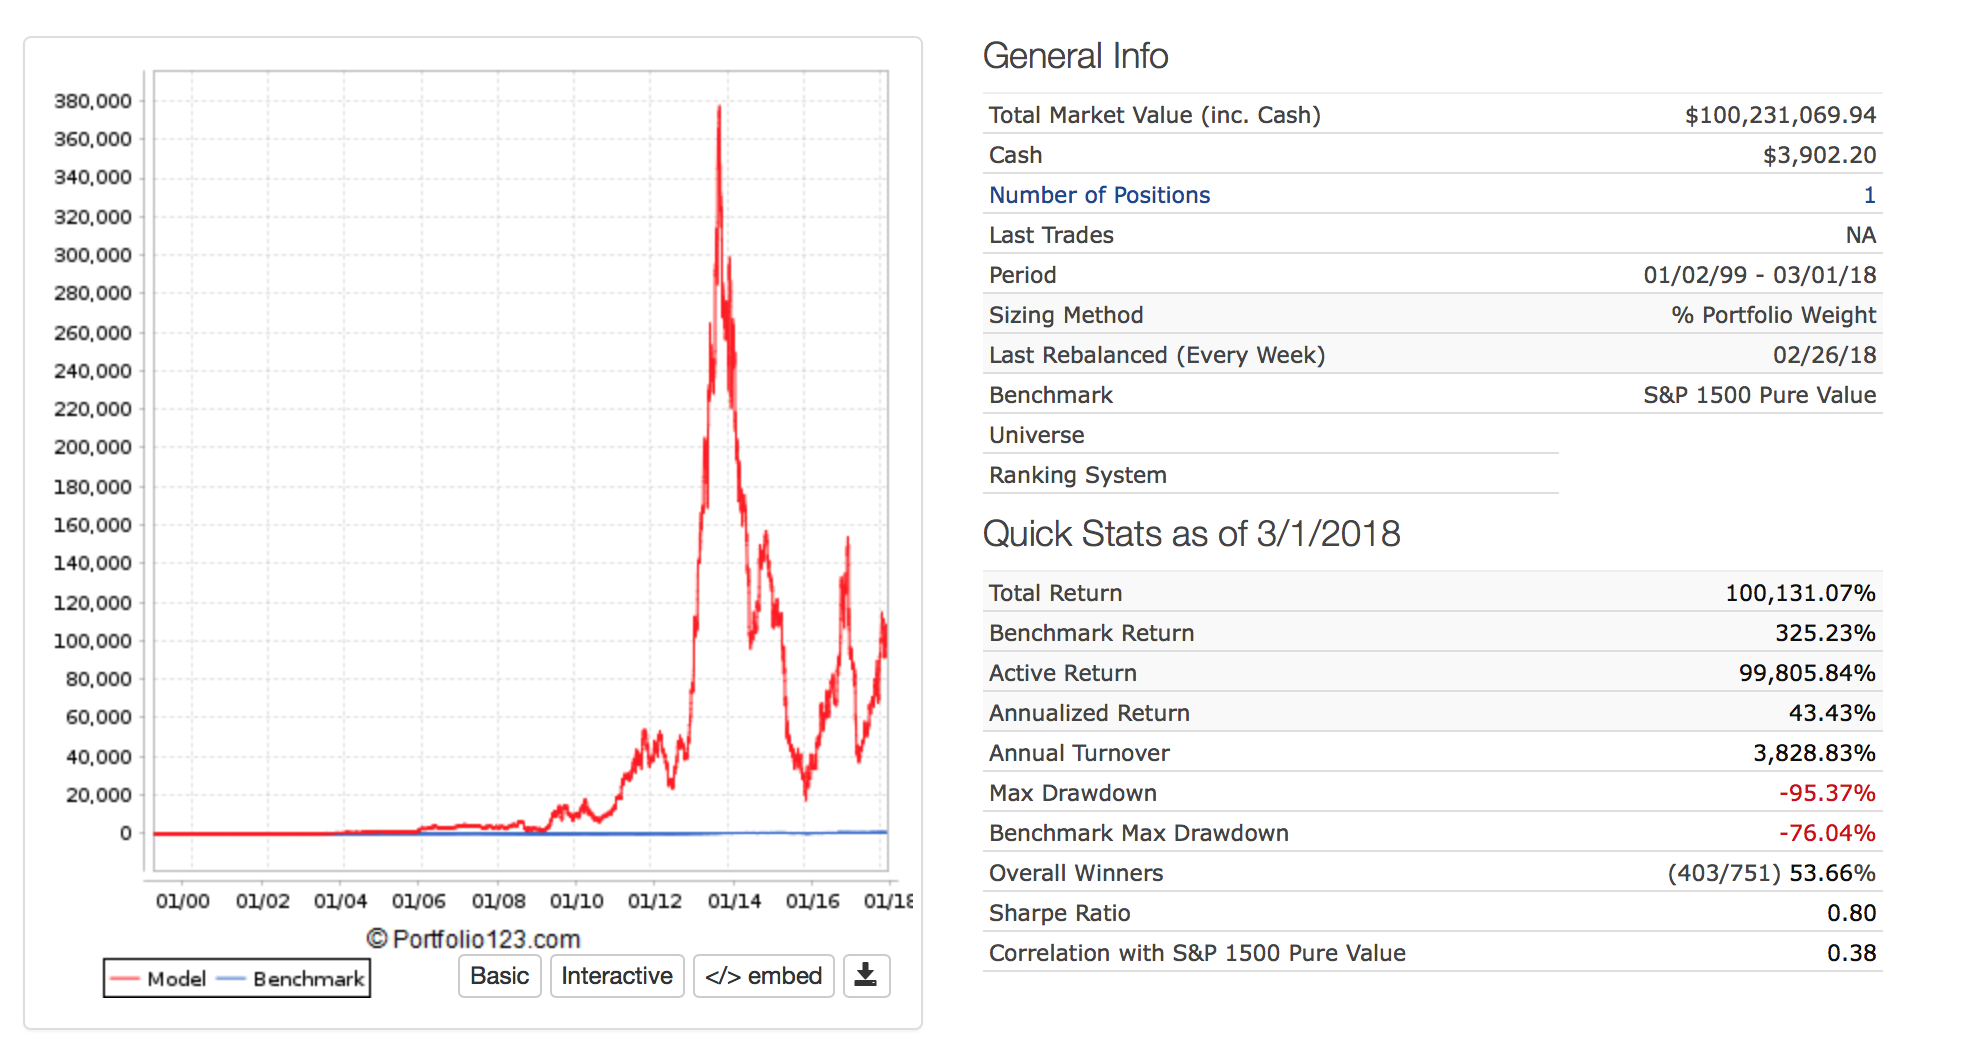
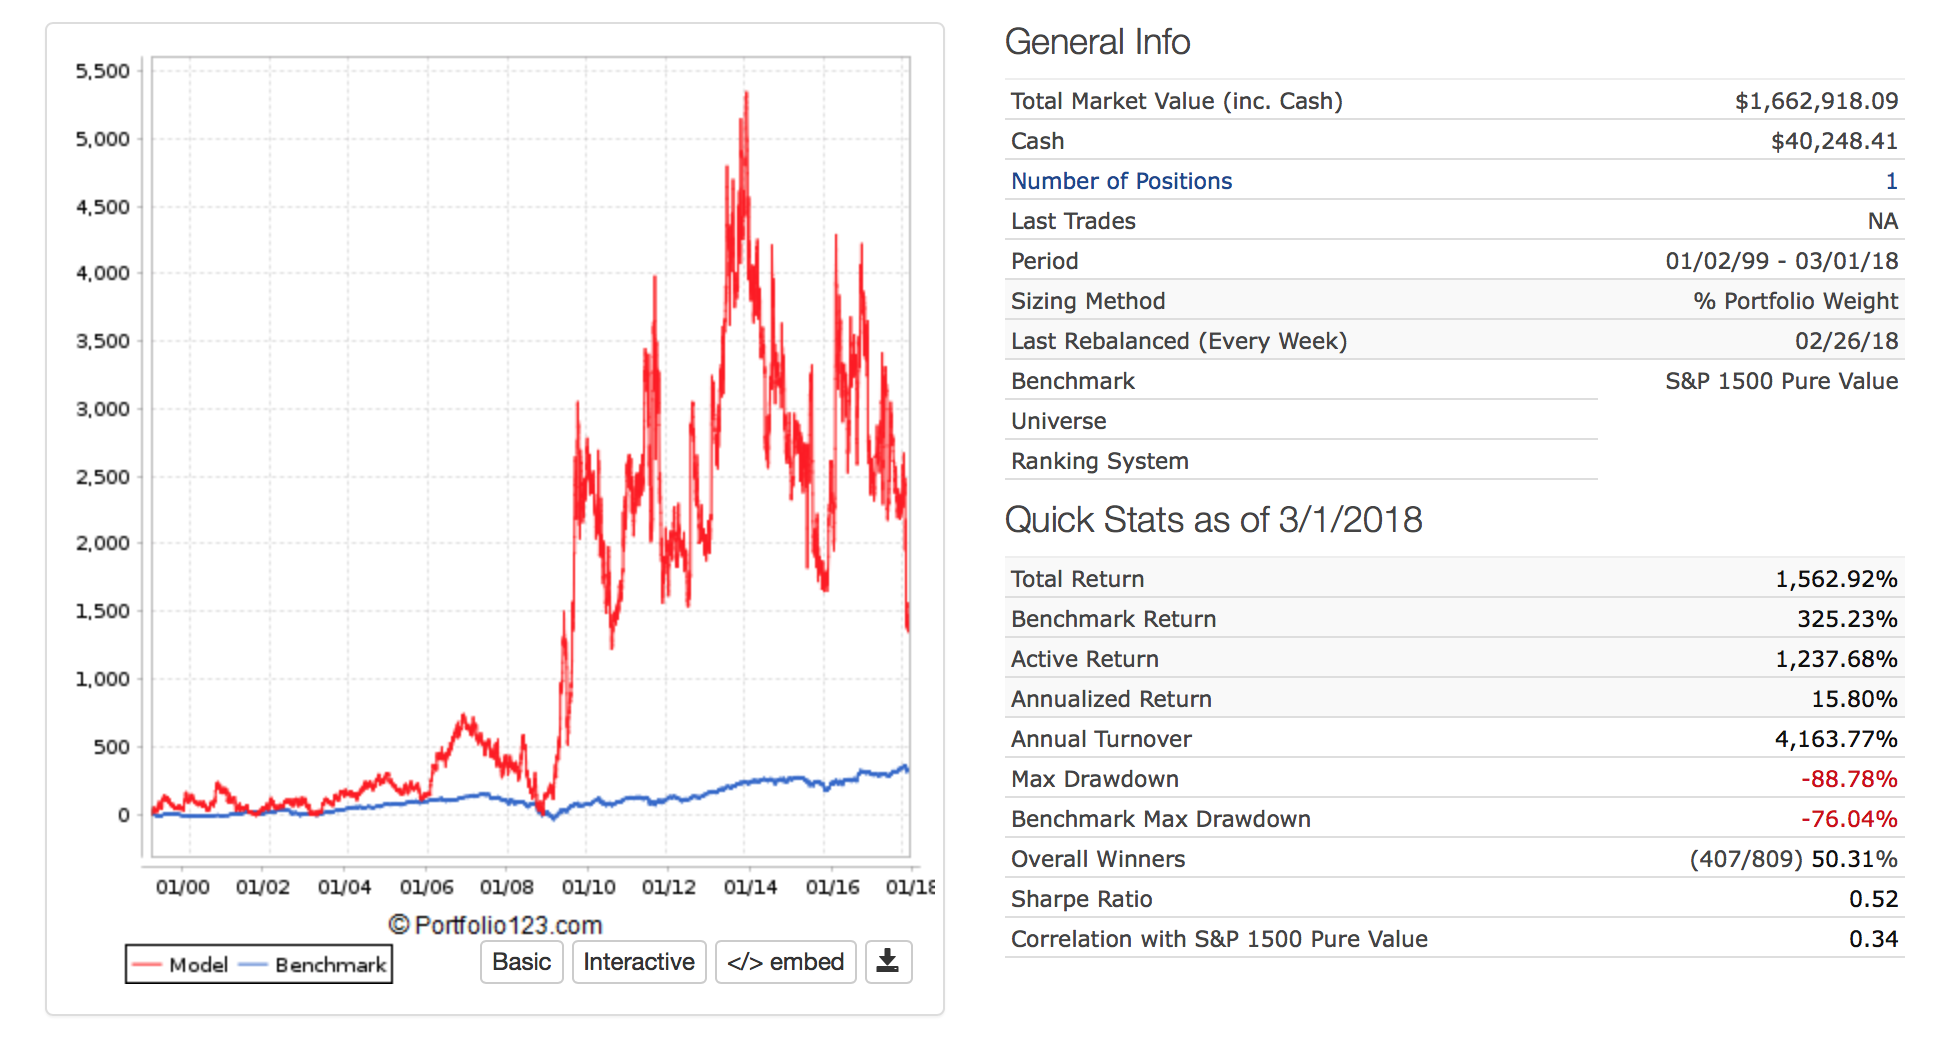
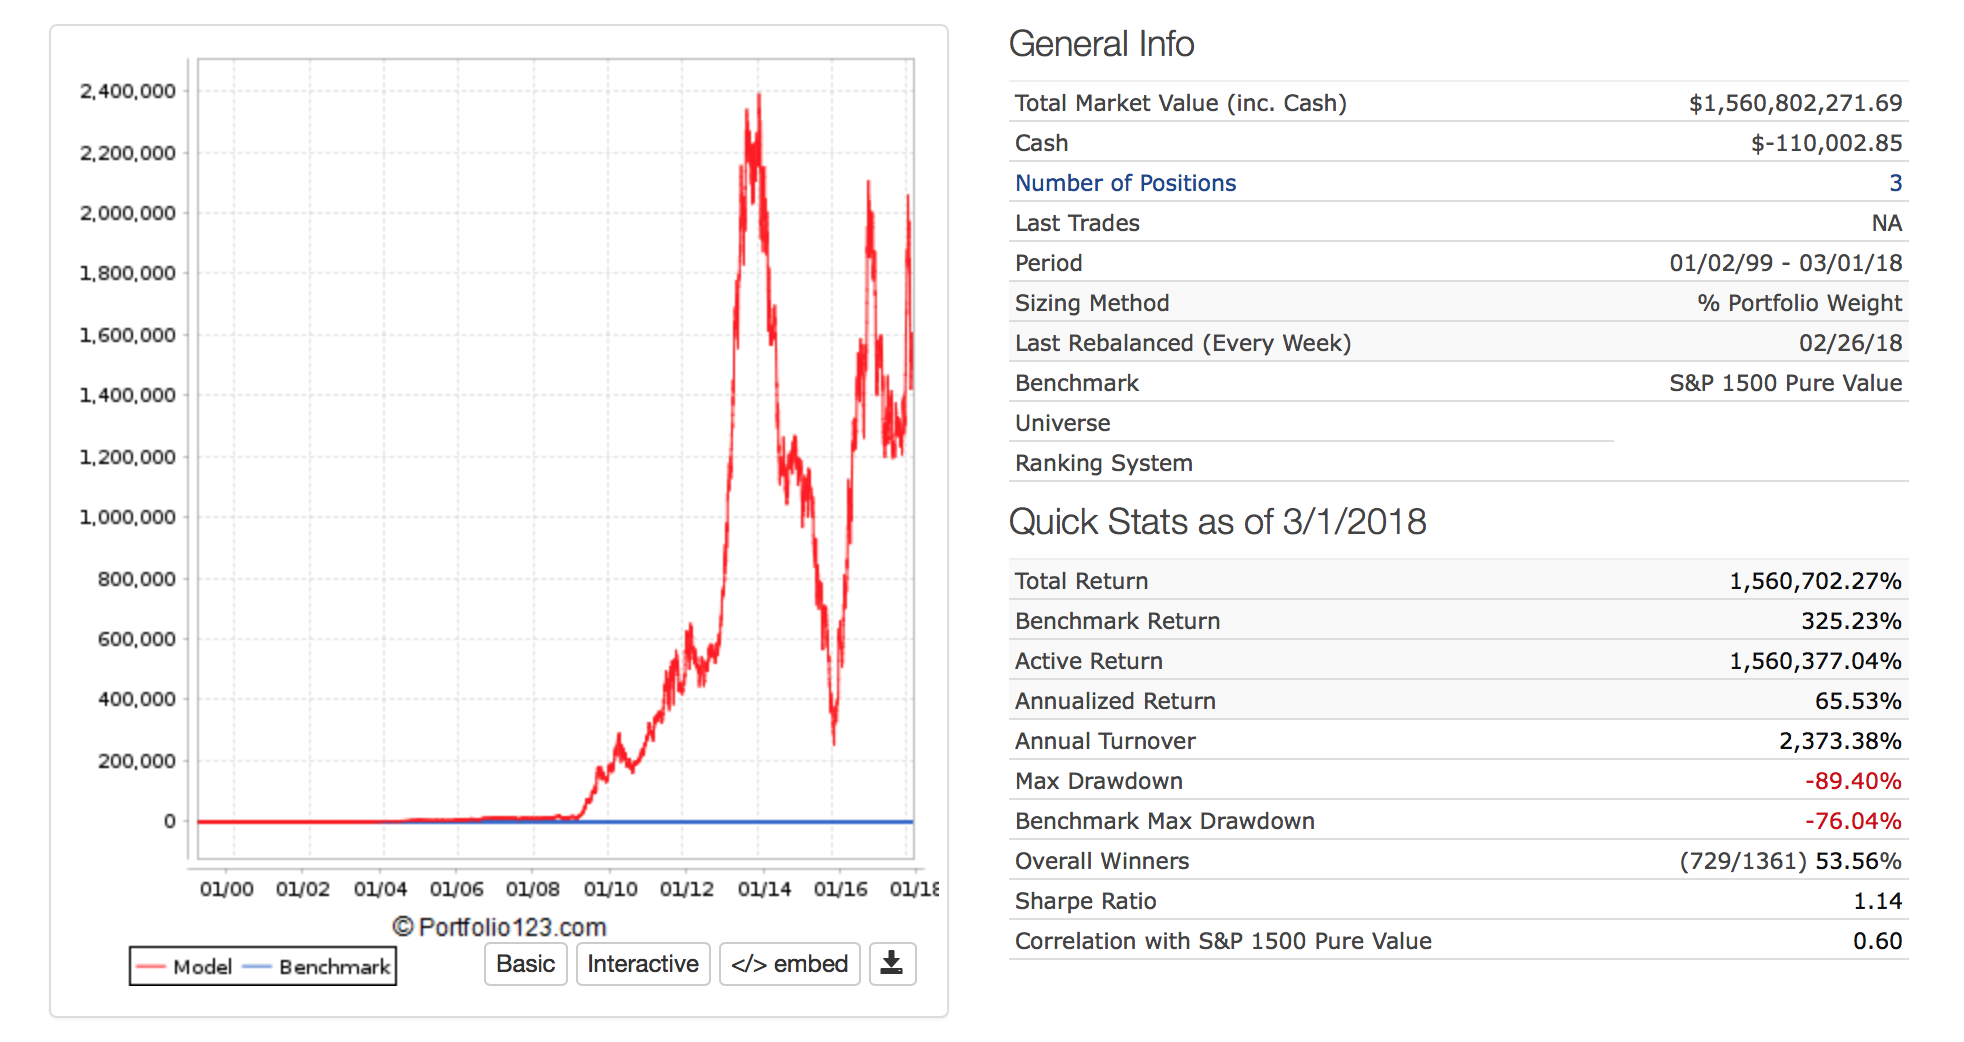
All good except if I had used the last formula it would have recommended the use of leverage for “Full Kelly.”

The problem is one of the months I would have gone bankrupt with that much leverage in the sim I was looking at.

I do not know if the lesson is do not use Kelly betting, do not use “Full Kelly” if you do, or the stock market really does not follow a normal distribution.

Mostly for fun.

This is similar to “optimal f”. Something that Ralph Vince was proposing.
The idea being that you calculate the ideal fraction of your money to allocate per trade based on past performance.
But, as we all know, past performance is only a rough and unreliable base to rely on.
I looked at it many years ago but decided that “optimal f” is not workable because of way too much risk and leverage.

The Kelly Criterion is a fantastic concept if these three conditions are met:

  1. Wins/Losses are well defined. Both the probability of a win or loss AND the magnitude can be described with accuracy. Games of chance that can be mathematically crunched, even those that don’t have binary results (normal distributions), are ideal.

  2. The bettor has no risk tolerance requirements beyond “don’t go broke”.

  3. Many many bets can be made in a series.

Sadly for the stock market none of those three are often true.

  1. Wins/losses are not precisely defined, and even our best efforts usually fail to address the fact that returns are not normally distributed. Outlandish >5SD events are actually far more common than a standard distribution would project. This is probably why your sims go bankrupt.

  2. Most stock investors are not willing to suffer >80% drawdowns, even if it is merely the expected result of “optimal” sizing. Full Kelly betting will pretty much always have massive swings up and down that no one would feel comfortable with when investing their savings.

  3. A single “bet” takes weeks, months, or maybe years unless you’re a high-frequency trader. Even over the course of a long career you’ll get in fewer bets than a weekend at a blackjack table. And after such a small sample even if the other two conditions are met the result will be highly random.

Its still a cool concept though worth reading about. Even fractional Kelly sizing is a really good method. Here’s a good article on the topic:

http://hariseshadri.com/docs/kelly-betting/kelly1.pdf

I cannot add to my original skepticism for the usefulness of this formula or to SUpirate1081’s and Werner’s excellent points.

I do keep encountering a much simpler formula for “Continuous Optimal Kelly” link here:Risk Management: Kelly’s Formula

Basically is: Full Kelly = Average Return/ (Standard Deviation of the Return)^2

I do not know much about margin but my sims blow up when I try margin even close to what this formula recommends. Probably due to the returns not following a normal distribution as SUpirate1081 suggests. Also, when the sim does not blowup due to higher levels of leverage, sims with lower leverage blow up because sims stop at 1 trillions dollars: LOL. What am I going to do when I hit $1 Trillion?

I am not recommending this. If fact, I am strongly recommending against the use of leverage based on this formula. It is perhaps encouraging that without leverage I am at a small fraction of “Full Kelly.” No guarantee that that means anything either.

Just an update on a much easier formula.

The original Kelly criterion is an invariant with leveraging. Whatever the statistical distribution and without needing a test, it makes it irrelevant to manage risks in investing strategies. However, it may be a useful robustness indicator among other ones to compare models.

How are you setting leverage with Kelly?

Is this something you compute within the sim? Or is it passed along as a a parameter from your own calculations (i.e., in a post-hoc fashion)?

I ask because I’ve been getting reinterested in Kelly betting and generally Information Theory’s applications to investing.

Also does anyone have any insights as to how this relates to optimal rebalancing, as manifested through Shannon’s Demon? I am currently working on some research on this phenomenon; the summary results are available: https://quant.stackexchange.com/questions/38473/intuitive-explanation-for-shannons-demon

David,
First, I never use leverage. I couldn’t even if I wanted to (because I invest in a SEP-IRA). I guess I could invest in leveraged ETFs but I don’t do that either.

For fun I calculated how much leverage I could use with some of my ports. The answer was A LOT. However, I think I would have gone broke in 2008 using the calculation for optimal Kelly: remember we are dealing with fat tails and it is not a normal distribution. This is all from memory.

So I never use leverage (or the equations in general) for a sim but perhaps one could. You could get the mean return and standard deviation over a period (for a stock or ETF) and use the formula below. Or even use PctDev(). Image is from “Kelly Capital Growth Investment Criterion” r is just the risk free rate.

I did spend about a week seeing if the formulas could be used to determine the best weights of different ports in a book. This would be to find the optimal weight to find a balance between risk and return—with no intention of finding optimal Kelly. In the end, I did not find it helpful and abandoned it. When I ran the calculations I found the answer, usually, was to put almost all of my money in the best port. If you think about it, this is the answer you would expect to get if you were well below optimal Kelly and the formulas would recommend leverage—no need to spread out the bets.

I think you actually know more about this than I do but perhaps the book “Kelly Capital Growth Investment Criterion” (Edward O. Thorp is an editor) might have some information that you have not seen before.

The relation between volatility harvesting and Shannon’s Demon interests me. I think we get some volatility harvesting in our sims. But as you know, the calculation involves correlation of the assets and that is somewhat involved. Using an estimate of the correlation I get that we do benefit from volatility harvesting in the sims.

-Jim


Ernie Chan wrote several books that touched on how to use Kelly in managing a portfolio. Quantitative Trading, Algorithmic Trading and Machine Trading.

We looked at it and chose to go a different route.

David, Parker and All,

Maybe, if I have nothing better to do, I will run through some of the equations with the example below at some point. But I think the sim pretty much shows the interactions between bets larger than Optimal Kelly, volatility drag (or volatility harvesting), and perhaps Shannon’s Demon.

NOTE: One could get a correlation matrix on each of the sims below–in a book–if one did want to run through some equations.

First notice how out-of-sample returns (somewhere around 1/2014 for the 5 stock version) can be much worse than in-sample returns. But that is another post.

Demon 1 Ideal weight 100% Only buy rule RankPos = 1 no transaction costs. Only sell rule: 1. Weekly rebalance.

Demon 2 Ideal weight 100% RankPos = 2………

Demon 3 Ideal weight 100% RankPos = 3……….

3 Demons: all 3 equal weight. Ideal weight 33%. Buy rule RankPos <= 3. Only sell rule: 1

You can probably tease out exactly what is going on and determine whether it is more volatility drag or going above Optimal Kelly (closely related) with your own examples. But some combination of this is causing the return of the 3 sims together (with frequent frictionless rebalance) to be better than any of the individual sims alone.

That may be Shannon’s Demon at work—the combination is better than any individual sim. And the average of the 3 sims compared to the combined and rebalanced sim? Not even close. Something is going on and it can be quantified—the names for it are legion :wink:

-Jim


All,

Ι want to correct an error. The above formula f = (μ - r)/σ^2 is true for a lognormal distribution. This formula might allow for leverage under some circumstances.

I have long suspected that this is not true for a t-distribution or a log t-distribution. One of my ports is more like a t-distribution with ν (nu) = 6 than it is a lognormal distribution. The following link gives some information regarding optimal Kelly betting for a t-distribution. https://edoc.hu-berlin.de/bitstream/handle/18452/14923/wesselhoefft.pdf?sequence=1

For a t-distribution Optimal Kelly is given by f = μ/(μ + σ^2). And this is only true for ν (nu) > 4 according to the paper

Notice that with this formula YOU WOULD NEVER USE LEVERAGE as f = μ/(μ + σ^2) can never be greater than one. At least for many of my 5 stock ports that have t-distributed returns with fat tails (e.g., ν =6) the Kelly Criterion does not ever recommend the use of leverage.

So I posted this above:

I was correct that I would have gone broke in 2008. Now I know I was correct to worry about fat tails and non-normal distributions for sound mathematical reasons. I was incorrect to say that the Kelly Criterion would allow for leverage in the ports that I have looked at. The Kelly Criterion may still be good when calculated correctly.

EDIT: A link to Roberto Osorio’s original paper can be found here.

The equation is different than above (possibly a typo in the linked paper). Looks like the actual equation is:

f = μ/(μ^2 + σ^2)

Τhis leaves room for leverage after all, I think. Osorio’s paper is pretty readable. I find it interesting that his examples are for ν = 5.5 which is in line, empirically, with many of my sims and ports.

Of note is his extension of the theory to include a factor for aversion or uncertainty with regard to fat-tail events, in addition to including fat-tail events in the analysis by using t-distribution:

Lower optimal leverages result when the tails of the distribution are fatter or when (a) the confidence in the estimation of the tails decreases or (b) the investor’s aversion to tail events increases (or both).

A remarkable paper IMHO.

-Jim

Related question.

How can we set a simulation to less than 1x leverage (for example, when we want to hold and rebalance to 70% equities and 30% T-Bills)?

Thanks.

//dpa

Just some random thoughts about implementing Kelly…

I have finally gotten around to implementing a Continuous Kelly betting system within P123. I think it is the final step for me before I learn to “trust the system”. No surprise, it appears that the basic version (i.e., with GBM) is sub-optimal in the real world. Despite this, I am inclined to stick with the framework because it gives me confidence that excess historical returns are not due to over-fitting.

Even though the assumptions of Continuous Kelly for geometric Brownian Motion are not met in the real world, I have found that the framework can easily be adapted for more pragmatic models of excess returns. I think this should make both the theorist and practitioner within me happy since I am both allowing inefficiency to exist while only mildly relaxing some assumptions about risk neutrality.

Moreover, one can bring the crtierion even closer to reality by folding realistic market frictions into the framework. In frictionless markets, the optimal rate of return is the instantaneous rate. However, the optimal rate of return never occurs at t=0 when transaction costs and taxes are present.

The major epiphany for me was that to make Kelly useful, one has to first put everything in terms of expected returns. After all, the Kelly just says that the optimality criterion seeks only to maximize the terminal wealth function. I.e., the first step is to translate ranks and factor interactions into expected return functions (and, no, they are not multiple co-linear regressions). When doing things in this manner, the expectation determines AND calibrates the model. I.e., no need to reinvent the wheel each research cycle!

And although I realize there may be additional problems with GBM, I am reluctant to play around with assumptions about normality since I think there is much more low hanging fruit to be had by simply playing around with the drifts.

Now, the problem I have is that analytically I am only able optimize with respect to two assets: one risky and one riskless. Three assets is possible to do, but mathematically ugly (moreover, why???). Anything more is analytically out of the question. The many assets problem is not conceptually difficult, but it seems infeasible given P123’s current capabilities. I doubt this is the place for a quadratic optimization package, but who knows?

Has anyone had any success in implementing a Kelly optimal betting system?

No, not really for me.

Maybe to the extent that I think in log returns. At its core that is all the Kelly betting is: maximizing the logarithmic returns.

I do put regressions, etc into excess logarithmic returns as it give a much better fit. And it keeps things stationary. But it is not natural to think in logs and I do not claim to be able to do it instinctively. This natural inability to think in logs is what makes Kelly betting seem so mysterious.

I do not think Kelly betting works for distributions that have too fat of a tail. Being too fat occurs when a t-distribution has a 4 degrees of freedom or less. So it is questionable for individual stocks. I am not sure I have an answer on whether it can be done for individual stocks or not. But it remains an open question for me.

With regard to several stocks it is difficult because correlation between the stocks is important.

If you look at your weekly returns (or monthly returns) of the entire sim/port you can probably get around both of these problems. This works if you are rebalancing enough that you are essentially placing new, independent bets every week or month. Probably none of us are doing this perfectly so this is an imperfect assumption. But even if you are sticking with the same (rebalanced) stock it can be though of as a new bet this week (month). Just like betting on the same horse in a new race is a new bet—assuming you have looked at all of the horses with fresh eyes.

So I think it can probably be used. But it is enough for me to get the best (logarithmic) return I can without taking on any leverage. This is something P123 is particularly good at. Indeed, the sim finds the geometric (annualized) return for you. If you have found the sim/book with the best returns then you have found what is closest to optimal Kelly (without leverage and for your ideas). If, in the end, you back away from the best returns in favor of reduced drawdown or volatility then you are backing away from optimal Kelly. This is not necessarily a bad thing.

I cannot do anything on margin in my account anyway—even if I wanted to. AND AFTER YESTERDAY I AM GLAD I HAD SOME CASH IN MY ACCOUNT AND WAS FAR AWAY FROM OPTIMAL KELLY.

Here is a good paper regrading the fat-tail problem:https://papers.ssrn.com/sol3/papers.cfm?abstract_id=1271373

-Jim

You probably already think in terms of logs and power-rules but do not realize it: A Natural Log: Our Innate Sense of Numbers is Logarithmic, Not Linear | Scientific American

Perhaps like some here, my main stumbling block to understanding continuous Kelly was getting my head around the fact that the terminal wealth function of a GBM is not simply the fractional allocation (f) times the logarithmic growth rate. It seems counter-intuitive because linearity is upheld when there is no variability. However, when a Wiener process is introduced into the exponent, there is a convexity component that requires an adjustment factor. This, in turn, makes the terminal wealth function a quadratic function of f.

Backing off from the math, what is most interesting about this (overly) simple derivation is how well it meshes with our intuitions and experiences about how excess leverage will always–inevitably–lead to ruin, no matter how large our edge.

For those interested, here is a concise derivation of optimal Kelly for GBM: stochastic processes - Question about quadratic form of f* in the Continuous Kelly Criterion - Quantitative Finance Stack Exchange

Moving this forward, it is not much more complicated to introduce time-dependent functions of expected return and market frictions to find a time-dependent optimal f.

So in the end this has not changed my investing much. But like David I can not get over the coolness of this.

So, fat tails aside, the optimal full Kelly is: mean return/variance. (DO NOT CONVERT TO PERCENT. KEEP IT DECIMAL) David uses a formula from which this can be derived.

And your expected return? Mean/standard deviation.

But where have we seen that? That is the Sharpe Ratio!

The more I see this stuff the more I am struck by how it is all related without that many functions tying it together. Fairly simple functions at that.

Yet, it still is not really all that intuitive for me. And it was not that long ago that the Sharpe Ratio won the a Nobel Prize so perhaps not that intuitive for our entire species.

David’s point does have investing importance. Too much leverage is always a problem.

And (if I am right) you do get most of this automatically with P123’s sims and books if you do not have time or interest in the math. So if you think any of this is cool then you will have agree with me that P123 is pretty cool.

Thanks David!!!

-Jim

I think it should actually be: .5*(Mean^2/standarddeviation^2).

(or something different when there is an option to invest in a risk-free asset)

Thanks David! Correct. Was going from memory.

Confirmation in image below from “The Kelly Capital Growth Investment Criterion”

So the integral of the Sharpe Ratio? Hmm I will have to think why that is—probably cooler still.

Anyway, much appreciated.

-Jim


My 2 Cent: do not touch it. Say No. Leave it alone. You are fooling yourselft, because you set assumptions about the “fact” that the Distribution is stable (or predictable), it is not at all in reality and I do not know any trading System that is robust where the backtested Distribution is stationary.

If you Change your bet size, you Need to use a “Performance Driver” (e.g. Size, Value, Momentum) like 1/mktcap. They can lead to higher Performance, but in all cases KIS (Keep it simple) produced a better capital curve (less volatile).
Equal weighted was always better.

Regards

Andreas

Nothing really to disagree with here.

And using books to mix-in our conservative strategies (e.g., bond funds) accomplishes the same thing for most of us who are not looking to use high leverage.

David’s caution about using too much leverage is similar to what Andreas is saying. Interesting that Andreas is one of the few among us who uses a little leverage.

If I were Andreas I would probably do a calculation or two to confirm that my leverage is not greater than optimal Kelly would recommend. Having done the calculations, I can assure him that being above optimal Kelly is unlikely for his modest amount of leverage—assuming his strategy continues to have an edge going forward.

But how hard is it to look at the average weekly return over the variance in a spreadsheet to see how much leverage you could use if the market continued to behave the same way in the future? That is a big assumption (that the market will continue to behave the same without increased volatility in the future). But it does place an absolute ceiling on how much leverage you could use. Me, I would want to be sure that I am not even close to optimal Kelly on a backtest if I were using leverage. This is because any change going forward (less return or more volatility) could put you above Optimal Kelly: very bad as David said.

Anyway, I am not recommending using leverage to anyone so no disagreement from me.

And his belief that you need a “performance driver” (or edge) first and foremost could not be better stated. None of this applies without an edge.

-Jim

BTW, Ed Thorp new exactly what his edge was for Blackjack.

Well sort of. If you read his book about Blackjack he was constantly worried about his edge. He was worried that his calculated edge was not correct due to cheating by the house. He went through extremes to ensure his calculation of the odds was mostly correct. Changing tables often, using disguises and just plain quitting when he was not winning (assuming something might not be right).

As an investor on Wall Street he also made sure to keep his edge. At one point he held real copper in a warehouse and also bet against copper using copper futures (if I remember the story exactly) but that is not the central point of the story.

Ed Thorp won this copper bet only because the real copper was stolen and he ended up ahead only after the insurance paid off for the stolen copper. He had the copper insured. He kept his edges under tight control with considerable effort.

I do not think I will ever be as close to knowing the true odds as Ed Thorp was for Blackjack or his hedged Wall Street strategies.

For me, using optimal Kelly going forward would be just a mental fantasy that could reasonably be called a delusion.

-Jim