Python API/ML Data Download Tips

So P123 is great for ease of use for ports using a ranking system. They may never be able to duplicate their own excellence in that regard.

But one could imagine a machine loading download button within the port writing to your desktop. Even if you trained your model in Colab have the model “pickled” to use in Jupyter notebooks. Sort the stock prediction with Python or Excel on your desktop AND RANK THE STOCKS (highest predicted return first position or rank 100).

Have an inlist feature where the stocks in the inlist are ranked. Maybe sell rule inlistPos > 30; buy rule inlistPos < 25 for a 25 stock port.

It will be tough to make it as easy as ports using ranks the way P123 does it now. Perhaps we might be surprised when Marco is done. But it should not be made harder than it has to be.

Jim

I have not checked the ranks compared to the as of date, but pricing data like Close(0) is from the Friday before. I had assumed that ranks where also based on Friday data, but you are probably right that it is based on the Monday rebalance ranks.

But for now only one rank update per week. Maybe that will change in the future?

Also worth noting that some weekly returns can be very high, but only say 0.1% of the total. It may be worth doing some post processing of downloaded data to trim the outliers. Unless you are trying to catch them specifically…

Jonpaul,

I’ve seen over-optimized models show short-term persistence - weeks to months - before they fall apart.

Maybe paper trade that model and re-optimized every week?

I’m not an expert on machine learning but I have done a huge amount of backtesting, so I have a few suggestions to avoid this kind of thing.

  1. Run your ML on multiple discrete universes. Run different ML algorithms on the universes. Don’t allow any overlap or allow any learning from one universe run to another. The goal would be to come up with, say, twenty wildly different systems. The final system–the one you use on the out-of-sample hold-out period–would somehow combine all the different systems.

  2. Anything run on a five-year period will almost be sure to perform badly out-of-sample. In all my correlation testing, a five-year lookback period performs the worst (even worse than three years, which benefits from a little factor momentum). I would advise using eight to ten years.

  3. Always trim outliers, especially if you’re using regression.

  4. Make sure to take transaction costs into account as much as you can.

Correct that can work. But also with XGBoost (and random forests) large leaf sizes help an awful lot. With Sklearn’s random forest you can use criterion = 'absolute_error" which will end up spliting according the the median values which helps with outliers but may not be necessary…

For XGBoost you can use “reg:pseudohubererror” (I believe you can do that, it has been a while) which is excellent for controlling outliers." Huber loss" is probably the most widely accepted method in machine learning for dealing with outliers and it works.

Anyway, you will clearly want to cross-validate (with a grid-search) to see what works for you. Just a guess but I think you will find that keeping the leaf size large is all you will need to do to manage the outliers.

Jim

Yuval,

This is an excellent idea. This can be done automatically with K-fold cross-validation in Python.

K is a variable that can be set to anything. Typically 5 or 10 discrete universes.

Also you can do a ‘grid search’ so that you can try multiple parameters automatically over all of the universes and Python will find the best parameters.

When you are done you can recursively remove one feature at time (again with multiple universes) until you have removed any features that are not really helping (due to collinearity or whatever).

You do have a good idea. And in fact that is really what machine learning is about, IMHO. Not so much whether it is linear regression or a random forest as long as you are doing the k-fold cross-validation… Having it automated makes it really nice of course…

I agree. Agree strongly. Great advice for machine learners and non-machine learners alike.

Jim

Jonpaul,

So 5-folds. Did you set the folds on shuffle = True? Use shuffle = False if you did. I have had that happen when I set shuffle = True.

I think there is another error if not that one. Accidental look-ahead bias or something is always the cause for me when it is that dramatic.

I also wonder if you are using early stopping correctly.

Best,

Jim

Thanks for all the great feedback!

Jim - It sounds like I should proceed by refining my training and testing universes using kfold or similar. I tried sklearn kfold and TimeSeriesSplit so far, but I think they all work on the same overall period of time. That being said when I used kfold it did have shuffle=true so I should set it to false and give it another shot.

I also need to implement early stopping, it is on my list, but I could not wait to see what the magic of ML learning could do hahaha. And in sample it really is like picking the best stocks! Out of sample not so much… So I also need to triple check there is no look ahead bias other than the target.

Yuval - thanks for the good suggestions on the training period and universes. I will try to expand the training time and available universes (maybe split on industry or Mktcap along with the built in kfold which I think is like splitting on stock ID), but I will have to wait for next months api credits :frowning: I did try to calculate a variable slippage in my model using last weeks spread and average trading volume, but I think it turned out too high. I recall reading a article you wrote on slippage calculation so I will revisit that.

Walter I was also thinking about trying to see what a portfolio would look like if I train to the week before and then by based on that and so on. But I have not figured out a good way to back test something like that. Maybe doing a paper account is faster than working through programming it.

Jonpaul,

You can do some splitting by industry BUT when you use K-fold your DataFrame should be in temporal order with Shuffle = False or you will get the same great in-sample performance and poor out of sample performance you just experienced.

TL;DR: Shuffle = False AND csv file or DataFrame in temporal order when you use K-Fold.

Jim

I implemented early stopping today and I think I am doing it right (stopping after RMSE stops improving). Interestingly it did not fix my in-sample vs out of sample performance issue, at least not that I could tell. My code is changing a lot and I switched from colab to my desktop and got different results so I don’t have a 1 to 1.

I trimmed my training and validation data, but not the “OOS” data, and it did not fix the issue. Then I trimmed just the training data, not the validation, and it almost doubled the “OOS” returns! Still way less than in sample, but better than the equal weighted ranking system.

I have not figured out how to directly increase leaf size in xgboost yet, but min_child_weight which chatgpt says is similar did improve the returns a lot more than a 1% trim, but I had to set it to 1,000 and chatgpt says normal values are 1-10…

Huber loss instead of RMSE did improve my results, but not by a very large amount. The min_child_weight had the largest improvement on its own.

All combined methods are worse than just the large child weight.

Once again thank you for the suggestions! While I could probably learn these things on my own it would take a lot longer without the community.

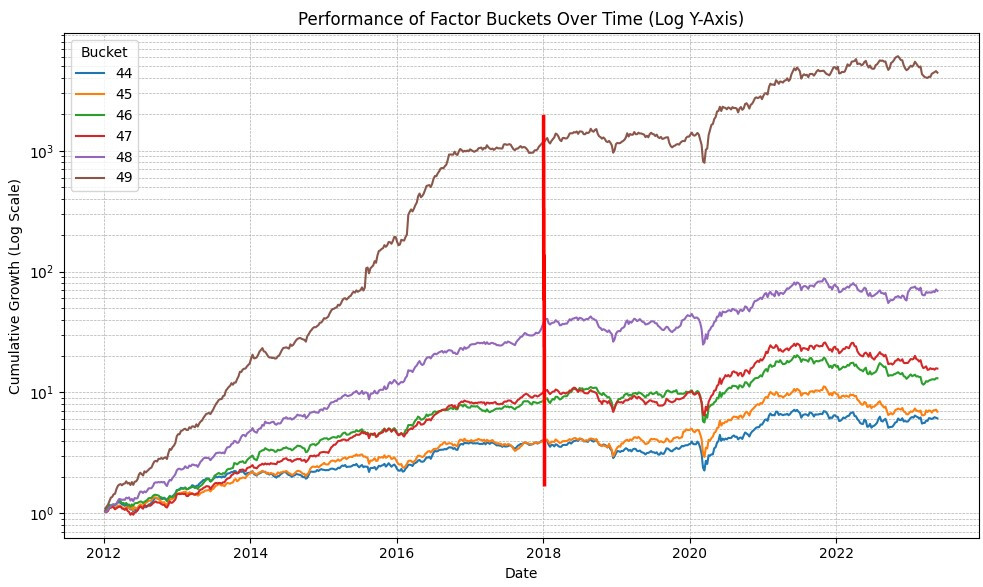
Also here is an interesting plot for those who are curious what the in-sample vs out of sample performance looks like for a 50 bucket “rank performance” test with kind of variable slippage (mean 0.3%) on a slightly modified core combinations ranking system:


The red line is where my training data stops and my “OOS” data starts.

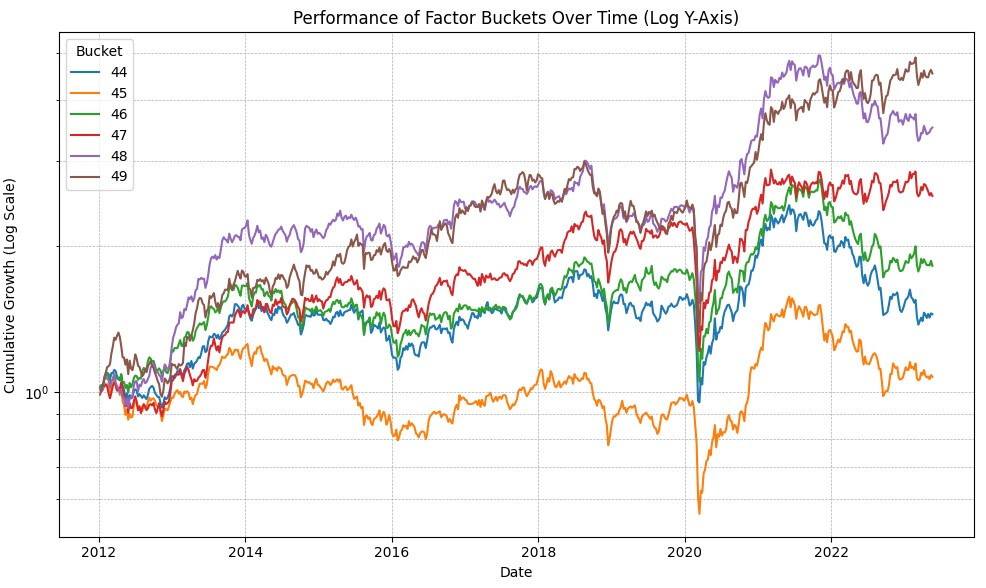
Core Combinations using the ranking performance method I coded:

Note 20 buckets look similar to the 50, its just around 17% annual OOS vs 27% for the top bucket on the ML algorithm. Also I ran a simulation with a similar ranking system, universe, and stock count and the simulation has an annual of 20%. I think a big part of the difference is my code back test for the ML and equal weight ranking apply the slippage penalty every week (although only buy), so I assume a turnover close to 25x… Without slippage I get about 22% annualized return on the equal weight port and 40% annual on the ML. So I need to make my back test code smarter to look at actual turnover. Anyway its starting to look very promising if ML can double the “OOS” performance of a ranking system.

That is why he is a machine and they never let him out of the house :grinning:

So you should try 3000 and higher is my response to that.

Here is why. I call it resolution. By that I mean how closely do you need to resolve the difference in the stocks. Really you need to know whether the first 25 socks are good for a 25 stock port. And not whether stock with RankPos 1 is better than the stock with RankPos 2 IF THAT WERE EVEN POSSIBLE!!!

So if you train 15 years (and have 7 year holdout set):

25 stocks * 52 weeks is a year * 15 years = 19,5000 as min_child_weight.

You will want to do a gridsearhCV to find the answer but try some big numbers in the grid search.

BTW, ChatGPT said I should try to publish my idea on resolution so it depends on how you ask the question sometimes.

I think you can see why outliers are less of a problem with this number, perhaps. And if larger numbers do work for you it will run faster.

Jim

Book looks pretty good. I look forward to reading it. It even has jupyter notebooks for it.
The Python version just came out. The Notebooks are not available… yet.

Tony

EDIT: future prices do account for splits (Close/Open(-X)). However, if you are doing sims by tracking the number of shares you need to account for splits!

I realized that the price data you download does not account for splits. I have not determined the size of the effect on back test returns, but I am currently chasing around a 10% under performance in my code compared to the P123 sim. I expect at least some of it is from the lack of splits and dividends.

To account for the splits you can download the SplitFactor(days) along with your price data. It thankfully does not require a PIT license! Depending on if you use a future return or a past return you should use positive or negative days. Then you can multiply the price data (or shares if you track that) by the split amount for that time period. If you are downloading future returns I think you can account for the split by doing something like this:
(Close(-6)*SplitFactor(-6)/Close(-1))-1

This would be the price percent change from next Monday close to the next weeks Monday close adjusted for splits in that time period.

If this is incorrect let me know!

Also I have not figured out how to account for dividends, but since my strategies do not focus on dividends I am going to ignore it for now…

I want open to open as that is when I can trade. Future does Close to Close. I also don’t know if it accounts for splits. The full description does not have “split” in it.

Do we know if it corrects for splits? The formula is not mentioned and this function has had issues in the past.

The real reason I don’t use it is I want the individual price to use in my simulation tool so I can buy whole shares. But I may have to re-think that approach…

What do you mean?

-under review-

Are opening prices before 2004 accurate?

Here is a recent post with Marco’s comment on the subject that you can interpret yourself: Opening prices redux - #3 by marco

There are other posts you can search.

And an unanswered question about splits. @marco P123’s engagement in the forum seems random at best. Certainly not geared toward answering questions or responding to issues for machine learners using the API and or DataMiner.

When is the AI/ML release? There might be more questions than simple ones about the quality of data then.

It was not that long ago that Future%ChgD(5) had look ahead-bias and it took a lot for that to be noticed and addressed. Opening prices and splits are potential problems that some did not even know to ask about (including me which splits and others on opening prices) and there are remaining unanswered in the forum.

To the best of my knowledge there was a lag introduced into the analysts’ data (after a few years) to addresss the look-ahead bias that FactSet itself addresses here: Point-in-Time Database vs. Traditional FE Database

But one can no longer get answers on this in the forum and I am not aware that there is anything about this on P123’s site.

All machine learning tests, including holdout test sets come with an asterisk: “Assumes there was no significant look-ahead basis or another unknown problem with he data.” I think I can point to some people who have at least stopped posting after having unanswered questions about the data quality. Maybe they are still with P123 and just learned that it doesn’t do much good to ask but maybe not. It remains difficult for an individual to quantitate the problems with the data—assuming she is even aware of alll for the potential problems.

I do think machine learners notice this if you want a robust, dedicated machine learingingfollowing. Quantopian understood this and had extensive documentation on what it did to address issues with the data (they used FactSet also).

P123 still has the potential to capture some of the Quantopian market. There is still a vacuum—for now. @marco, P123 should address the split question today (along with opening prices) if it is serious about filling that vacuum.

Edit for Below: Thank you Jonpaul for answering some of the questions about P123 data! As well as raising the new question as to how exactly future%cahg_d(5) is calculated.

I did a download test. For people doing % returns using Future%Chg or using ratios at the time of download you are ok! For people who are downloading the individual close/open prices you still need to account for splits. See below for why!

This is one of the tickers that had a future split that I downloaded using the python api:

You can see that the future prices for -6 and -11 days are all around $50 for the 8/27 date. Then on the next date 9/03 we see the prices fall to around $25. So the future dates account for the split price.

Granted I am not so sure about how the future%chg_d(5) is calculated. I thought that it would be a Monday to Monday price for 5 days, but it differs from my calculation. I also tried 6 days, but it is also different:
image

My future_change is: (Close(-6) / Close(-1) - 1) * 100. You can double check with the numbers in the table. I do recall checking that Close(-6) is the next weeks Monday, but maybe I am still missing something.

1 Like

If I’m following, maybe the issue is that future_change is covering bars and future%chg_d_6 is covering weekdays. Since the 2023-08-27 period includes a holiday, an extra day is needed in the calculation.

Using future%chg() should work.

1 Like