Python program to find correlations and multicollinearity

I had a good chat with Grok and got help to make a little program to analyze and create a report to find features that have high correlation and/or risk of multicollinearity.

As most of us here, I'm no expert in the field, so I'm happy to get feedback to improve this little program. I have not yet tried using the output from the recommendations the program suggests; if you do, please give some feedback.

To use it, you must first download the factors list. Go to RESEARCH - TOOLS - Download Factors. Make a New Factor List - Import From AI Factor. I don't know for how long a time period that is necessary to download; I tried with 1 year and the report came out good; a shorter period is probably okay.

The whole program is pasted in the bottom of the post.

It's enough to use the command like python feature_correlation_analyzer.py --input my_factor_list.csv and the program will generate an HTML report with some graphics and suggestions of features to remove.

Remember to install all the libraries (pip install pandas numpy seaborn matplotlib statsmodels scipy jinja2).

Below is the AI generated explanation of the program.

Detailed Explanation of What the Program Does

This Python program, named feature_correlation_analyzer.py, is a professional-grade tool designed to help with feature engineering in machine learning models, particularly for stock investment strategies using algorithms like LightGBM. It analyzes a dataset of financial features (e.g., z-scored metrics like EPS growth, volatility, or price-to-sales ratios) across a large universe of stocks over time. The core goal is to detect and address issues like high feature correlations and multicollinearity, which can lead to redundant data, model instability, overfitting, or inefficient training—even in robust tree-based models like LightGBM.

Here's a step-by-step breakdown of how the program works, based on its code structure and functionality:

  1. Input Handling and Data Preparation:
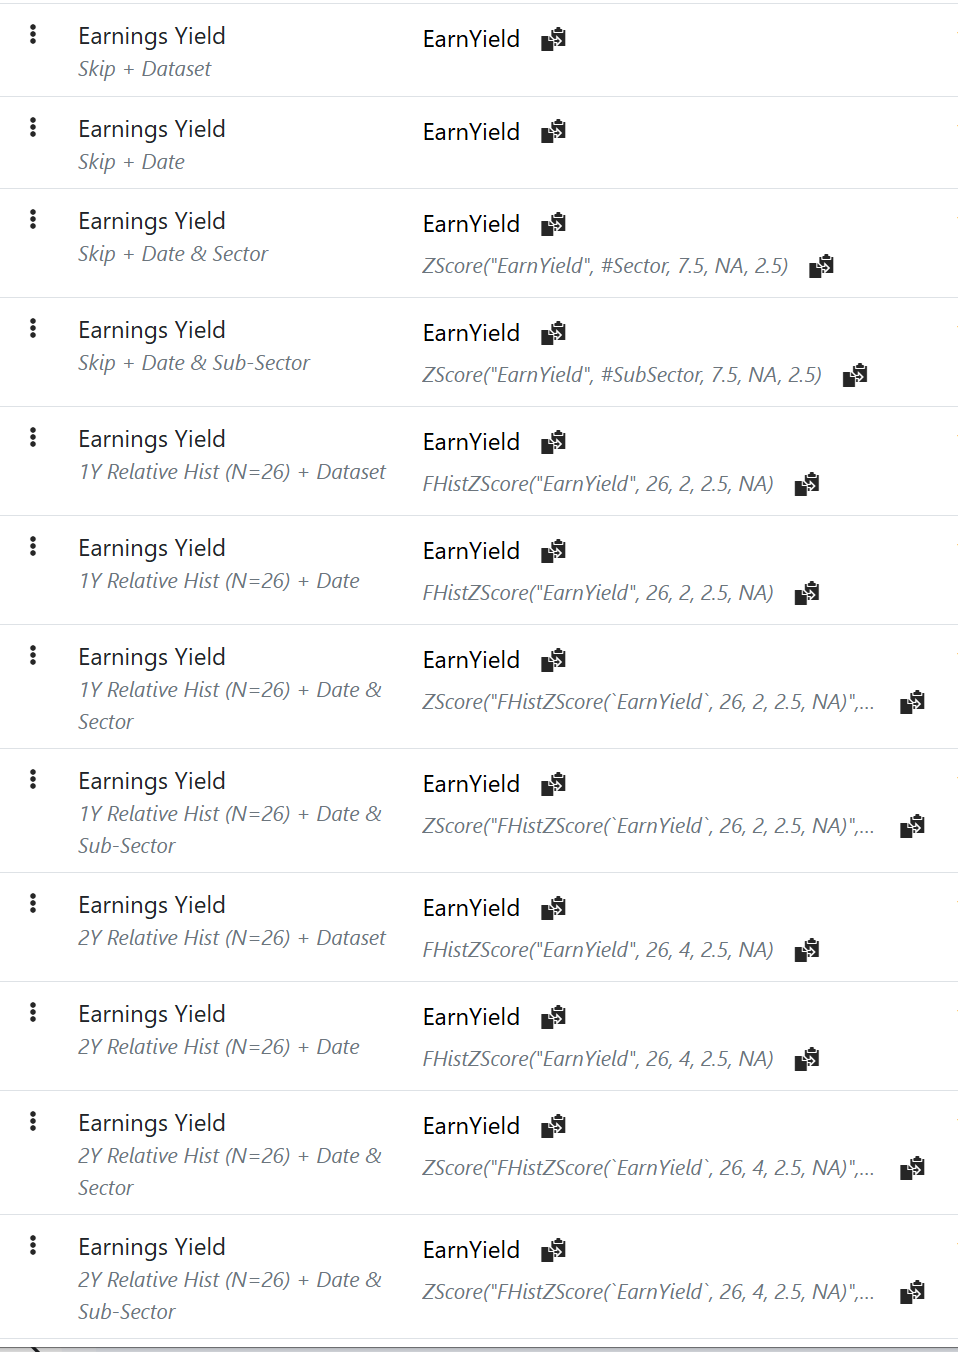
  • The program takes a CSV file as input (via the --input command-line argument), which should contain columns like "Date", "Ticker", and various numeric features (e.g., "eps_accel_lt", "Operating Assets", etc., as seen in your screenshots).
  • It loads the data into a pandas DataFrame, excludes non-numeric columns (like Date and Ticker), and drops any rows with missing values (NaNs) for simplicity. This assumes the features are already z-scored (standardized) for fair comparison, as in your dataset.
  • If needed, you can customize thresholds like correlation method (Pearson, Spearman, or Kendall), correlation threshold (default 0.7), VIF threshold (default 5.0), and output directory via command-line flags.
  1. Correlation Analysis:
  • It computes a pairwise correlation matrix for all numeric features using the specified method (default: Pearson, which measures linear relationships; Spearman or Kendall can handle non-linear or ordinal data).
  • High-correlation pairs are identified where the absolute correlation exceeds the threshold (e.g., |corr| > 0.7). These are flagged as potentially redundant, since one feature might largely predict another, adding little new information to the model.
  1. Multicollinearity Detection via VIF:
  • Variance Inflation Factor (VIF) is calculated for each feature using linear regression (via statsmodels). VIF measures how much a feature is explained by the others: VIF = 1 / (1 - R²), where R² is from regressing the feature against all others.
  • High VIF (>5 or 10) indicates multicollinearity (features are interdependent), and infinite VIF (inf) means perfect linear dependence (e.g., one feature is a direct multiple or combination of others).
  • The program handles edge cases like constant features (removes them) or near-perfect collinearity to avoid errors.
  1. Feature Removal Suggestions:
  • It prioritizes removals greedily:
    • First, any features with infinite VIF (perfect redundancy).
    • Then, for each high-correlation pair, it removes the feature with the higher average absolute correlation to all others (as this one contributes more to overall redundancy).
    • Finally, adds any remaining features with VIF above the threshold.
  • If no issues are found, it falls back to suggesting removal of the top 10% of features by average correlation.
  • For each suggested removal, it generates a detailed reason, including the feature's VIF, its top 3 highest correlations (e.g., "Highly correlated with: FeatureX (corr = 0.85); FeatureY (corr = 0.78)"), and why removal helps (e.g., simplifies the model, reduces training time, improves generalization).
  1. Visualizations:
  • Clustered Correlation Heatmap: A color-coded matrix (using seaborn's clustermap) showing correlations, with hierarchical clustering to group similar features. It focuses on high-correlation subsets for readability, with rotated labels to avoid truncation.
  • VIF Bar Plot: A horizontal bar chart of the top 20 VIF scores (inf values capped for display), with a red line at the threshold. Figure size adjusts dynamically to fit long feature names without cutting them off.
  • Both are saved as high-resolution PNGs in the output directory.
  1. Report Generation:
  • Outputs an enhanced HTML report (using Jinja2 templates) that's easy to view in any browser. The report includes:
    • Overview: Summary of the analysis, input details, and key stats (e.g., total features, high-correlation pairs, suggested removals, and dimensionality reduction percentage).
    • Explanations: Clear definitions of Pearson correlation and VIF, plus how recommendations are generated (with a step-by-step process and validation advice).
    • Tables: High-correlation pairs (sorted by strength) and full VIF scores.
    • Detailed Recommendations: A bulleted list explaining each suggested removal one-by-one, with tailored reasons.
    • Visuals: Embedded images of the heatmap and VIF plot.
    • Next Steps: Advice on implementing changes, retraining LightGBM, and monitoring performance (e.g., via cross-validation or metrics like Sharpe ratio for stock strategies).
  • The report is narrative-driven, professional, and user-friendly, with CSS styling for better readability.

Overall, this program streamlines feature selection for your stock investment ML pipeline by automating the detection of problematic features, providing actionable insights, and visualizing results. It's modular (built as a class for reusability), logs progress for debugging, and can be extended (e.g., integrate LightGBM feature importances for smarter removals). Since it's focused on z-scored financial data from a platform (like the "factors list" you mentioned), it's tailored for quantitative finance but general enough for other high-dimensional datasets. If you run it on your 1-year data and test the suggestions, it could help refine your model—feedback on that would be great for improvements!

import argparse
import logging
import os
from datetime import datetime
from typing import List, Optional, Tuple, Dict

import matplotlib.pyplot as plt
import numpy as np
import pandas as pd
import seaborn as sns
import statsmodels.api as sm
from jinja2 import Template
from scipy.cluster.hierarchy import linkage

# Set up logging for professionalism
logging.basicConfig(level=logging.INFO, format='%(asctime)s - %(levelname)s - %(message)s')
logger = logging.getLogger(__name__)

class FeatureCorrelationAnalyzer:
    """
    Professional class for analyzing feature correlations in a dataset.
    Handles loading, computation, visualization, and reporting.
    """
    def __init__(
        self,
        input_path: str,
        correlation_method: str = 'pearson',
        corr_threshold: float = 0.7,
        vif_threshold: float = 5.0,
        output_dir: str = 'results'
    ):
        self.input_path = input_path
        self.correlation_method = correlation_method
        self.corr_threshold = corr_threshold
        self.vif_threshold = vif_threshold
        self.output_dir = output_dir
        self.df: Optional[pd.DataFrame] = None
        self.features: List[str] = []
        self.corr_matrix: Optional[pd.DataFrame] = None
        self.vif_df: Optional[pd.DataFrame] = None
        self.high_corr_pairs: List[Tuple[str, str, float]] = []
        self.suggested_removals: List[str] = []
        self.removal_reasons: Dict[str, str] = {}

        os.makedirs(self.output_dir, exist_ok=True)

    def load_data(self) -> None:
        """Load and preprocess the CSV data."""
        try:
            self.df = pd.read_csv(self.input_path)
            logger.info(f"Loaded data with shape: {self.df.shape}")

            # Exclude non-numeric columns
            exclude_cols = ['Date', 'P123 ID', 'Ticker']  # Updated to exclude P123 ID
            self.features = [col for col in self.df.columns if col not in exclude_cols and self.df[col].dtype in ['float64', 'int64']]
            if len(self.features) == 0:
                raise ValueError("No numeric features found in the dataset.")

            self.df = self.df[self.features + exclude_cols].dropna()  # Drop rows with NaNs for simplicity; customize if needed
            logger.info(f"Selected {len(self.features)} numeric features.")
        except Exception as e:
            logger.error(f"Error loading data: {e}")
            raise

    def compute_correlations(self) -> None:
        """Compute the correlation matrix."""
        if self.df is None:
            raise ValueError("Data not loaded. Call load_data() first.")

        numeric_df = self.df[self.features]
        self.corr_matrix = numeric_df.corr(method=self.correlation_method)
        logger.info(f"Computed {self.correlation_method} correlation matrix.")

        # Identify high correlation pairs (upper triangle to avoid duplicates)
        upper_tri = np.triu(np.ones(self.corr_matrix.shape), k=1).astype(bool)
        high_corr = self.corr_matrix.abs().where(upper_tri) > self.corr_threshold
        self.high_corr_pairs = [
            (row, col, self.corr_matrix.at[row, col])
            for row in high_corr.index for col in high_corr.columns if high_corr.at[row, col]
        ]
        logger.info(f"Found {len(self.high_corr_pairs)} pairs with |corr| > {self.corr_threshold}.")

    def compute_vif(self) -> None:
        """Compute Variance Inflation Factors (VIF) with handling for perfect multicollinearity."""
        if self.df is None:
            raise ValueError("Data not loaded. Call load_data() first.")

        numeric_df = self.df[self.features].copy()
        # Remove constant columns to avoid immediate issues
        numeric_df = numeric_df.loc[:, numeric_df.std() > 0]
        if numeric_df.empty:
            raise ValueError("All features are constant; cannot compute VIF.")

        logger.info(f"Computing VIF for {numeric_df.shape[1]} non-constant features.")

        vif_data = []
        X = sm.add_constant(numeric_df)
        tol = 1e-10  # Tolerance for near-perfect collinearity

        for i, feature in enumerate(numeric_df.columns):
            y = numeric_df[feature]
            X_other = X.drop(feature, axis=1)  # Constant + other features
            model = sm.OLS(y, X_other).fit()
            r_squared = model.rsquared

            if np.isnan(r_squared) or (1 - r_squared) <= tol:
                vif = np.inf
            else:
                vif = 1 / (1 - r_squared)

            vif_data.append((feature, vif))

        self.vif_df = pd.DataFrame(vif_data, columns=['Feature', 'VIF']).sort_values('VIF', ascending=False)
        logger.info("Computed VIF scores (inf indicates perfect multicollinearity).")

    def suggest_removals(self) -> None:
        """Suggest features to remove based on correlations and VIF, prioritizing inf VIF."""
        if self.corr_matrix is None or self.vif_df is None:
            raise ValueError("Correlations or VIF not computed.")

        # Create VIF dict for quick lookup
        vif_dict = {row['Feature']: row['VIF'] for _, row in self.vif_df.iterrows()}

        # Get features with inf VIF or high VIF
        inf_vif_features = self.vif_df[self.vif_df['VIF'] == np.inf]['Feature'].tolist()

        # Greedy removal: Start with inf VIF, then high corr pairs
        removal_candidates = set(inf_vif_features)  # Always remove inf first

        # Build reasons for inf VIF
        self.removal_reasons = {}
        for feature in inf_vif_features:
            self.removal_reasons[feature] = "This feature exhibits perfect multicollinearity (VIF = inf), meaning it can be exactly predicted from other features, making it redundant and potentially causing instability in models."

        # Group high corr pairs by feature for reasons
        corr_dict = {f: [] for f in self.features}
        for f1, f2, corr_val in self.high_corr_pairs:
            corr_dict[f1].append((f2, corr_val))
            corr_dict[f2].append((f1, corr_val))

        for f1, f2, corr_val in sorted(self.high_corr_pairs, key=lambda x: abs(x[2]), reverse=True):
            if f1 in removal_candidates or f2 in removal_candidates:
                continue
            # Remove the one with higher VIF
            vif1 = vif_dict.get(f1, 0)
            vif2 = vif_dict.get(f2, 0)
            if vif1 > vif2:
                removal_candidates.add(f1)
            else:
                removal_candidates.add(f2)

        # Set suggested removals
        self.suggested_removals = list(removal_candidates)
        for feature in self.suggested_removals:
            reason_parts = []
            vif = vif_dict.get(feature, 0)
            if vif == np.inf:
                reason_parts.append("Exhibits perfect multicollinearity (VIF = inf).")
            elif vif > self.vif_threshold:
                reason_parts.append(f"High multicollinearity (VIF = {vif:.2f}).")
            corrs = sorted(corr_dict.get(feature, []), key=lambda x: abs(x[1]), reverse=True)[:3]  # Top 3 corrs
            if corrs:
                corr_str = "; ".join([f"{other} (corr = {val:.2f})" for other, val in corrs])
                reason_parts.append(f"Highly correlated with: {corr_str}.")
            reason_parts.append("Removing this feature will help simplify the model, reduce training time, and potentially improve generalization by mitigating multicollinearity issues.")
            self.removal_reasons[feature] = " ".join(reason_parts)

        if not self.suggested_removals:
            # Fallback: remove top 10% by average correlation
            mean_corr = self.corr_matrix.abs().mean().sort_values(ascending=False)
            top_mean_corr = mean_corr.index[:int(len(self.features) * 0.1)].tolist()
            self.suggested_removals = top_mean_corr
            for feature in top_mean_corr:
                reason_parts = ["High average correlation with other features."]
                corrs = sorted(corr_dict.get(feature, []), key=lambda x: abs(x[1]), reverse=True)[:3]
                if corrs:
                    corr_str = "; ".join([f"{other} (corr = {val:.2f})" for other, val in corrs])
                    reason_parts.append(f"Highly correlated with: {corr_str}.")
                reason_parts.append("Removing this feature as a fallback to reduce dimensionality.")
                self.removal_reasons[feature] = " ".join(reason_parts)

        logger.info(f"Suggested {len(self.suggested_removals)} features for removal: {self.suggested_removals}")

    def visualize(self) -> None:
        """Generate professional visualizations."""
        if self.corr_matrix is None:
            raise ValueError("Correlations not computed.")

        # Filter to high correlation features for better readability
        high_corr_features = set()
        for f1, f2, _ in self.high_corr_pairs:
            high_corr_features.add(f1)
            high_corr_features.add(f2)
        if not high_corr_features:
            high_corr_features = set(self.features)  # Fallback
        corr_sub = self.corr_matrix.loc[list(high_corr_features), list(high_corr_features)]

        # Clustered Heatmap on subset
        fig = plt.figure(figsize=(16, 14))  # Larger size
        linkage_matrix = linkage(corr_sub, method='average')
        clustermap = sns.clustermap(corr_sub, row_linkage=linkage_matrix, col_linkage=linkage_matrix, cmap='coolwarm', center=0, annot=False, fmt='.2f')
        clustermap.ax_heatmap.tick_params(axis='both', labelsize=8)  # Smaller font if needed
        clustermap.ax_heatmap.set_xticklabels(clustermap.ax_heatmap.get_xticklabels(), rotation=90, ha='right')
        clustermap.ax_heatmap.set_yticklabels(clustermap.ax_heatmap.get_yticklabels(), rotation=0)
        plt.subplots_adjust(bottom=0.3, left=0.25)  # Adjust margins for labels
        heatmap_path = os.path.join(self.output_dir, 'correlation_heatmap.png')
        plt.savefig(heatmap_path, dpi=300)  # Higher DPI for clarity
        plt.close()
        logger.info(f"Saved heatmap to {heatmap_path}")

        # VIF Bar Plot
        if self.vif_df is not None:
            vif_plot_df = self.vif_df.replace(np.inf, self.vif_df['VIF'].replace(np.inf, np.nan).max() + 1).head(20)
            num_bars = len(vif_plot_df)
            plt.figure(figsize=(12, max(6, num_bars * 0.4)))  # Dynamic height for labels
            sns.barplot(x='VIF', y='Feature', data=vif_plot_df)
            plt.axvline(self.vif_threshold, color='r', linestyle='--')
            plt.title("Top VIF Scores (inf capped for display)")
            plt.subplots_adjust(left=0.3)  # Increase left margin for long labels
            plt.tight_layout()
            vif_path = os.path.join(self.output_dir, 'vif_barplot.png')
            plt.savefig(vif_path, dpi=300)
            plt.close()
            logger.info(f"Saved VIF plot to {vif_path}")

    def generate_report(self) -> None:
        """Generate an enhanced HTML report with narrative explanations."""
        timestamp = datetime.now().strftime("%Y-%m-%d %H:%M:%S")
        high_corr_df = pd.DataFrame(self.high_corr_pairs, columns=['Feature1', 'Feature2', 'Correlation'])
        high_corr_df['Absolute Correlation'] = high_corr_df['Correlation'].abs()
        high_corr_df = high_corr_df.sort_values('Absolute Correlation', ascending=False)

        # Prepare detailed removals HTML
        detailed_removals = "<ul>"
        for feature, reason in self.removal_reasons.items():
            detailed_removals += f"<li><strong>{feature}:</strong> {reason}</li>"
        detailed_removals += "</ul>"

        template_str = """
        <html>
        <head><title>Feature Correlation Analysis Report</title>
        <style>
            body { font-family: Arial, sans-serif; line-height: 1.6; }
            h1, h2 { color: #333; }
            table { border-collapse: collapse; width: 100%; }
            th, td { border: 1px solid #ddd; padding: 8px; text-align: left; }
            th { background-color: #f2f2f2; }
            ul { list-style-type: disc; padding-left: 20px; }
            img { max-width: 100%; height: auto; }
        </style>
        </head>
        <body>
        <h1>Feature Correlation Analysis Report</h1>
        <p>Generated on: {{ timestamp }}</p>
        <p>Input File: {{ input_path }}</p>
        <p>Correlation Method: {{ method }}</p>
        <p>Correlation Threshold: {{ threshold }}</p>
        <p>VIF Threshold: {{ vif_threshold }}</p>

        <h2>Report Overview</h2>
        <p>This report analyzes the correlations and multicollinearity among the features in your dataset, which consists of z-scored financial indicators for a large universe of stocks over one year. The goal is to identify redundant or problematic features that could impact your LightGBM-based stock investment strategy. By detecting high correlations and multicollinearity, we can suggest feature removals to simplify the model, reduce overfitting risk, and improve computational efficiency without significant loss of information.</p>

        <h2>Key Concepts Explained</h2>
        <p><strong>{{ method.capitalize() }} Correlation:</strong> This measures the strength and direction of the relationship between two features. Values range from -1 (perfect negative correlation) to 1 (perfect positive correlation), with 0 indicating no correlation. High absolute values (e.g., > {{ threshold }}) suggest redundancy, as one feature can largely predict the other. For your dataset, we used the {{ method }} method to compute pairwise correlations.</p>
        <p><strong>Variance Inflation Factor (VIF):</strong> VIF quantifies multicollinearity by showing how much a feature's variance is inflated due to its correlations with other features. It is calculated as 1 / (1 - R²), where R² is from regressing the feature on all others. A VIF > {{ vif_threshold }} indicates moderate multicollinearity, while >10 suggests severe issues, and inf means perfect linear dependence. High VIF can make model coefficients unstable, even in tree-based models like LightGBM.</p>

        <h2>Analysis Summary</h2>
        <ul>
            <li>Total Features Analyzed: {{ num_features }}</li>
            <li>High Correlation Pairs (|{method}| > {{ threshold }}): {{ num_pairs }}</li>
            <li>Suggested Feature Removals: {{ num_removals }} ({{ suggested_removals }})</li>
        </ul>

        <h2>How Recommendations Are Generated</h2>
        <p>Recommendations are based on a systematic approach to mitigate multicollinearity:</p>
        <ol>
            <li><strong>Identify Problematic Features:</strong> Compute the correlation matrix and flag pairs with absolute correlation above {{ threshold }}. Calculate VIF for each feature.</li>
            <li><strong>Prioritize Removals:</strong> First, remove features with infinite VIF (perfect multicollinearity). Then, for each high-correlation pair, greedily remove the feature with the higher VIF, as it contributes more to multicollinearity. </li>
            <li><strong>Fallback:</strong> If no issues are found, suggest removing the top 10% of features by average correlation to reduce dimensionality.</li>
            <li><strong>Validation Advice:</strong> After removals, retrain your LightGBM model and evaluate performance using cross-validation or out-of-sample testing. Consider domain knowledge (e.g., retain key financial indicators) or integrate feature importance from a preliminary LightGBM run to refine choices.</li>
        </ol>
        <p>This process ensures minimal information loss while addressing redundancy. Removing {{ num_removals }} features reduces dimensionality by approximately {{ reduction_pct }}%.</p>

        <h2>High Correlation Pairs</h2>
        {{ high_corr_table }}

        <h2>VIF Scores (inf indicates perfect multicollinearity)</h2>
        {{ vif_table }}

        <h2>Detailed Feature Removal Recommendations</h2>
        <p>Below is a one-by-one explanation for each suggested removal, including its VIF, key correlations, and rationale. These suggestions aim to eliminate redundancy while preserving predictive power.</p>
        {{ detailed_removals }}

        <h2>Visualizations</h2>
        <p>The heatmap focuses on features involved in high correlations for clarity. The VIF plot shows the top 20 scores.</p>
        <img src="correlation_heatmap.png" alt="Clustered Correlation Heatmap">
        <img src="vif_barplot.png" alt="Top VIF Scores Plot">

        <h2>Next Steps</h2>
        <p>Implement the suggested removals in your dataset and retrain your LightGBM model. Monitor metrics like AUC, Sharpe ratio, or backtest performance for your stock strategy. If needed, run this analysis periodically as your feature set evolves. For further customization, integrate LightGBM feature importances to prioritize retention of high-value features.</p>
        </body>
        </html>
        """
        template = Template(template_str)
        report_html = template.render(
            timestamp=timestamp,
            input_path=self.input_path,
            method=self.correlation_method,
            threshold=self.corr_threshold,
            vif_threshold=self.vif_threshold,
            num_features=len(self.features),
            num_pairs=len(self.high_corr_pairs),
            num_removals=len(self.suggested_removals),
            suggested_removals=', '.join(self.suggested_removals),
            reduction_pct=round(100 * len(self.suggested_removals) / len(self.features), 1) if self.features else 0,
            high_corr_table=high_corr_df.to_html(index=False),
            vif_table=self.vif_df.to_html(index=False) if self.vif_df is not None else "<p>VIF not computed.</p>",
            detailed_removals=detailed_removals
        )

        report_path = os.path.join(self.output_dir, 'report.html')
        with open(report_path, 'w') as f:
            f.write(report_html)
        logger.info(f"Generated enhanced report at {report_path}")

    def run_analysis(self) -> None:
        """Run the full analysis pipeline."""
        self.load_data()
        self.compute_correlations()
        self.compute_vif()
        self.suggest_removals()
        self.visualize()
        self.generate_report()

def main():
    parser = argparse.ArgumentParser(description="Professional Feature Correlation Analyzer for Stock Data")
    parser.add_argument('--input', type=str, required=True, help='Path to input CSV file')
    parser.add_argument('--method', type=str, default='pearson', choices=['pearson', 'spearman', 'kendall'], help='Correlation method')
    parser.add_argument('--threshold', type=float, default=0.7, help='Correlation threshold for flagging')
    parser.add_argument('--vif_threshold', type=float, default=5.0, help='VIF threshold for flagging')
    parser.add_argument('--output_dir', type=str, default='results', help='Output directory')
    
    args = parser.parse_args()
    
    analyzer = FeatureCorrelationAnalyzer(
        input_path=args.input,
        correlation_method=args.method,
        corr_threshold=args.threshold,
        vif_threshold=args.vif_threshold,
        output_dir=args.output_dir
    )
    analyzer.run_analysis()

if __name__ == '__main__':
    main()
7 Likes

I have made an updated version with the option to upload a prediction importance if you have run the model already. With that file you will get a warning if a suggested feature removal has a high predictivity coefficient.

To run the program you can use the command like

python feature_correlation_analyzer_v2.py --input MyAIModel.csv --coefficients FeatureImportance-15474-495565.csv

Attached a sample report. I find it very informative.
Feature Correlation Analysis Report.pdf (928.5 KB)

import logging
import os
from datetime import datetime
from typing import List, Optional, Tuple, Dict

import matplotlib.pyplot as plt
import numpy as np
import pandas as pd
import seaborn as sns
import statsmodels.api as sm
from jinja2 import Template
from scipy.cluster.hierarchy import linkage
import networkx as nx  # For clustering perfect correlations

# Set up logging for professionalism
logging.basicConfig(level=logging.INFO, format='%(asctime)s - %(levelname)s - %(message)s')
logger = logging.getLogger(__name__)

class FeatureCorrelationAnalyzer:
    """
    Professional class for analyzing feature correlations in a dataset.
    Handles loading, computation, visualization, and reporting.
    """
    def __init__(
        self,
        input_path: str,

        coefficients_path: Optional[str] = None,
        correlation_method: str = 'pearson',
        corr_threshold: float = 0.7,
        vif_threshold: float = 5.0,
        perfect_corr_threshold: float = 0.999,
        output_dir: str = 'results'
    ):
        self.input_path = input_path
        self.coefficients_path = coefficients_path
        self.correlation_method = correlation_method
        self.corr_threshold = corr_threshold
        self.vif_threshold = vif_threshold
        self.perfect_corr_threshold = perfect_corr_threshold
        self.output_dir = output_dir
        self.df: Optional[pd.DataFrame] = None
        self.features: List[str] = []
        self.corr_matrix: Optional[pd.DataFrame] = None
        self.vif_df: Optional[pd.DataFrame] = None
        self.high_corr_pairs: List[Tuple[str, str, float]] = []
        self.suggested_removals: List[str] = []
        self.removal_reasons: Dict[str, str] = {}
        self.importance_dict: Optional[Dict[str, float]] = None
        self.high_risk_removals: List[str] = []

        os.makedirs(self.output_dir, exist_ok=True)

    def load_data(self) -> None:
        """Load and preprocess the CSV data."""
        try:
            self.df = pd.read_csv(self.input_path)
            logger.info(f"Loaded data with shape: {self.df.shape}")

            # Exclude non-numeric columns
            exclude_cols = ['Date', 'P123 ID', 'Ticker']  # Updated to exclude P123 ID
            self.features = [col for col in self.df.columns if col not in exclude_cols and self.df[col].dtype in ['float64', 'int64']]
            if len(self.features) == 0:
                raise ValueError("No numeric features found in the dataset.")

            self.df = self.df[self.features + exclude_cols].dropna()  # Drop rows with NaNs for simplicity; customize if needed
            logger.info(f"Selected {len(self.features)} numeric features.")
        except Exception as e:
            logger.error(f"Error loading data: {e}")
            raise

    def load_coefficients(self) -> None:
        """Load feature coefficients from CSV if provided."""
        if self.coefficients_path is None:
            return

        try:
            coeff_df = pd.read_csv(self.coefficients_path)
            self.importance_dict = {}
            for _, row in coeff_df.iterrows():
                feature = row.get('Name')
                coeff_str = row.get('Coefficient')
                if feature and coeff_str:
                    try:
                        coeff = float(coeff_str)
                        self.importance_dict[feature] = abs(coeff)
                    except ValueError:
                        self.importance_dict[feature] = 0.0
            logger.info(f"Loaded importance scores for {len(self.importance_dict)} features from coefficients CSV.")
        except Exception as e:
            logger.error(f"Error loading coefficients: {e}")
            raise

    def compute_correlations(self) -> None:
        """Compute the correlation matrix."""
        if self.df is None:
            raise ValueError("Data not loaded. Call load_data() first.")

        numeric_df = self.df[self.features]
        self.corr_matrix = numeric_df.corr(method=self.correlation_method)
        logger.info(f"Computed {self.correlation_method} correlation matrix.")

        # Identify high correlation pairs (upper triangle to avoid duplicates)
        upper_tri = np.triu(np.ones(self.corr_matrix.shape), k=1).astype(bool)
        high_corr = self.corr_matrix.abs().where(upper_tri) > self.corr_threshold
        self.high_corr_pairs = [
            (row, col, self.corr_matrix.at[row, col])
            for row in high_corr.index for col in high_corr.columns if high_corr.at[row, col]
        ]
        logger.info(f"Found {len(self.high_corr_pairs)} pairs with |corr| > {self.corr_threshold}.")

    def compute_vif(self) -> None:
        """Compute Variance Inflation Factors (VIF) with handling for perfect multicollinearity."""
        if self.df is None:
            raise ValueError("Data not loaded. Call load_data() first.")

        numeric_df = self.df[self.features].copy()
        # Remove constant columns to avoid immediate issues
        numeric_df = numeric_df.loc[:, numeric_df.std() > 0]
        if numeric_df.empty:
            raise ValueError("All features are constant; cannot compute VIF.")

        logger.info(f"Computing VIF for {numeric_df.shape[1]} non-constant features.")

        vif_data = []
        X = sm.add_constant(numeric_df)
        tol = 1e-10  # Tolerance for near-perfect collinearity

        for i, feature in enumerate(numeric_df.columns):
            y = numeric_df[feature]
            X_other = X.drop(feature, axis=1)  # Constant + other features
            model = sm.OLS(y, X_other).fit()
            r_squared = model.rsquared

            if np.isnan(r_squared) or (1 - r_squared) <= tol:
                vif = np.inf
            else:
                vif = 1 / (1 - r_squared)

            vif_data.append((feature, vif))

        self.vif_df = pd.DataFrame(vif_data, columns=['Feature', 'VIF']).sort_values('VIF', ascending=False)
        logger.info("Computed VIF scores (inf indicates perfect multicollinearity).")

    def suggest_removals(self) -> None:
        """Suggest features to remove based on correlations, VIF, and importance, handling clusters."""
        if self.corr_matrix is None or self.vif_df is None:
            raise ValueError("Correlations or VIF not computed.")

        vif_dict = {row['Feature']: row['VIF'] for _, row in self.vif_df.iterrows()}

        # Importance threshold for high-risk (75th percentile if coeffs provided)
        high_import_threshold = 0.0
        if self.importance_dict:
            importance_values = list(self.importance_dict.values())
            high_import_threshold = np.percentile(importance_values, 75) if importance_values else 0.0

        # Step 1: Detect near-perfect multicollinear clusters using graph
        G = nx.Graph()
        G.add_nodes_from(self.features)
        for i in range(len(self.features)):
            for j in range(i + 1, len(self.features)):
                f1, f2 = self.features[i], self.features[j]
                if abs(self.corr_matrix.at[f1, f2]) >= self.perfect_corr_threshold:
                    G.add_edge(f1, f2)
        clusters = list(nx.connected_components(G))

        removal_candidates = set()
        self.removal_reasons = {}
        self.high_risk_removals = []

        for cluster in clusters:
            cluster_list = list(cluster)
            if len(cluster_list) > 1:  # Multicollinear group
                # Sort by importance descending (prefer keep high imp), or by VIF ascending if no imp
                if self.importance_dict:
                    cluster_list.sort(key=lambda f: self.importance_dict.get(f, 0), reverse=True)
                else:
                    cluster_list.sort(key=lambda f: vif_dict.get(f, np.inf))
                # Keep the best one, remove others (but check if keep has inf VIF and low imp)
                keep = cluster_list[0]
                for f in cluster_list[1:]:
                    removal_candidates.add(f)
                    reason_parts = [f"In near-perfect correlation cluster (corr >= {self.perfect_corr_threshold:.3f}) with kept feature '{keep}'."]
                    if self.importance_dict:
                        imp = self.importance_dict.get(f, 0)
                        reason_parts.append(f"Predictive importance: {imp:.2f} (vs. kept: {self.importance_dict.get(keep, 0):.2f}).")
                    if vif_dict.get(f, 0) == np.inf:
                        reason_parts.append("Exhibits perfect multicollinearity (VIF = inf).")
                    reason_parts.append("Removed to break redundancy while preserving highest value feature.")
                    self.removal_reasons[f] = " ".join(reason_parts)
                    if self.importance_dict and imp > high_import_threshold:
                        self.high_risk_removals.append(f)

        # Step 2: Handle remaining high-corr pairs (non-perfect)
        corr_dict = {f: [] for f in self.features}
        for f1, f2, corr_val in self.high_corr_pairs:
            corr_dict[f1].append((f2, corr_val))
            corr_dict[f2].append((f1, corr_val))

        for f1, f2, corr_val in sorted(self.high_corr_pairs, key=lambda x: abs(x[2]), reverse=True):
            if f1 in removal_candidates or f2 in removal_candidates:
                continue
            # Prefer remove lower importance or higher VIF
            if self.importance_dict:
                imp1 = self.importance_dict.get(f1, 0.0)
                imp2 = self.importance_dict.get(f2, 0.0)
                to_remove = f1 if imp1 < imp2 else f2
            else:
                vif1 = vif_dict.get(f1, 0.0)
                vif2 = vif_dict.get(f2, 0.0)
                to_remove = f1 if vif1 > vif2 else f2
            removal_candidates.add(to_remove)

        # Step 3: Add reasons for non-cluster removals and check high-risk
        self.suggested_removals = list(removal_candidates)
        for feature in self.suggested_removals:
            if feature in self.removal_reasons:
                continue  # Already set for clusters
            reason_parts = []
            vif = vif_dict.get(feature, 0.0)
            if vif == np.inf:
                reason_parts.append("Exhibits perfect multicollinearity (VIF = inf).")
            elif vif > self.vif_threshold:
                reason_parts.append(f"High multicollinearity (VIF = {vif:.2f}).")
            if self.importance_dict:
                imp = self.importance_dict.get(feature, 0.0)
                reason_parts.append(f"Predictive importance (abs coefficient): {imp:.2f}.")
            corrs = sorted(corr_dict.get(feature, []), key=lambda x: abs(x[1]), reverse=True)[:3]
            if corrs:
                corr_str = "; ".join([f"{other} (corr = {val:.2f})" for other, val in corrs])
                reason_parts.append(f"Highly correlated with: {corr_str}.")
            reason_parts.append("Removing this feature will help simplify the model and mitigate multicollinearity.")
            self.removal_reasons[feature] = " ".join(reason_parts)
            if self.importance_dict and imp > high_import_threshold:
                self.high_risk_removals.append(feature)

        # Fallback if no removals
        if not self.suggested_removals:
            mean_corr = self.corr_matrix.abs().mean().sort_values(ascending=True)  # Changed to ascending for fallback: remove lowest corr if no issues
            top_mean_corr = mean_corr.index[:int(len(self.features) * 0.1)].tolist()
            self.suggested_removals = top_mean_corr
            for feature in top_mean_corr:
                reason_parts = ["Low average correlation with other features (fallback removal)."]
                if self.importance_dict:
                    imp = self.importance_dict.get(feature, 0.0)
                    reason_parts.append(f"Predictive importance (abs coefficient): {imp:.2f}.")
                corrs = sorted(corr_dict.get(feature, []), key=lambda x: abs(x[1]), reverse=True)[:3]
                if corrs:
                    corr_str = "; ".join([f"{other} (corr = {val:.2f})" for other, val in corrs])
                    reason_parts.append(f"Highly correlated with: {corr_str}.")
                reason_parts.append("Removing this feature as a fallback to reduce dimensionality.")
                self.removal_reasons[feature] = " ".join(reason_parts)
                if self.importance_dict and imp > high_import_threshold:
                    self.high_risk_removals.append(feature)

        logger.info(f"Suggested {len(self.suggested_removals)} features for removal: {self.suggested_removals}")

    def visualize(self) -> None:
        """Generate professional visualizations."""
        if self.corr_matrix is None:
            raise ValueError("Correlations not computed.")

        # Filter to high correlation features for better readability
        high_corr_features = set()
        for f1, f2, _ in self.high_corr_pairs:
            high_corr_features.add(f1)
            high_corr_features.add(f2)
        if not high_corr_features:
            high_corr_features = set(self.features)  # Fallback
        corr_sub = self.corr_matrix.loc[list(high_corr_features), list(high_corr_features)]

        # Clustered Heatmap on subset
        fig = plt.figure(figsize=(16, 14))  # Larger size
        linkage_matrix = linkage(corr_sub, method='average')
        clustermap = sns.clustermap(corr_sub, row_linkage=linkage_matrix, col_linkage=linkage_matrix, cmap='coolwarm', center=0, annot=False, fmt='.2f')
        clustermap.ax_heatmap.tick_params(axis='both', labelsize=8)  # Smaller font if needed
        clustermap.ax_heatmap.set_xticklabels(clustermap.ax_heatmap.get_xticklabels(), rotation=90, ha='right')
        clustermap.ax_heatmap.set_yticklabels(clustermap.ax_heatmap.get_yticklabels(), rotation=0)
        plt.subplots_adjust(bottom=0.3, left=0.25)  # Adjust margins for labels
        heatmap_path = os.path.join(self.output_dir, 'correlation_heatmap.png')
        plt.savefig(heatmap_path, dpi=300)  # Higher DPI for clarity
        plt.close()
        logger.info(f"Saved heatmap to {heatmap_path}")

        # VIF Bar Plot
        if self.vif_df is not None:
            vif_plot_df = self.vif_df.replace(np.inf, self.vif_df['VIF'].replace(np.inf, np.nan).max() + 1).head(20)
            num_bars = len(vif_plot_df)
            plt.figure(figsize=(12, max(6, num_bars * 0.4)))  # Dynamic height for labels
            sns.barplot(x='VIF', y='Feature', data=vif_plot_df)
            plt.axvline(self.vif_threshold, color='r', linestyle='--')
            plt.title("Top VIF Scores (inf capped for display)")
            plt.subplots_adjust(left=0.3)  # Increase left margin for long labels
            plt.tight_layout()
            vif_path = os.path.join(self.output_dir, 'vif_barplot.png')
            plt.savefig(vif_path, dpi=300)
            plt.close()
            logger.info(f"Saved VIF plot to {vif_path}")

    def generate_report(self) -> None:
        """Generate an enhanced HTML report with narrative explanations."""
        timestamp = datetime.now().strftime("%Y-%m-%d %H:%M:%S")
        high_corr_df = pd.DataFrame(self.high_corr_pairs, columns=['Feature1', 'Feature2', 'Correlation'])
        high_corr_df['Absolute Correlation'] = high_corr_df['Correlation'].abs()
        high_corr_df = high_corr_df.sort_values('Absolute Correlation', ascending=False)

        # Prepare detailed removals HTML
        detailed_removals = "<ul>"
        for feature, reason in self.removal_reasons.items():
            detailed_removals += f"<li><strong>{feature}:</strong> {reason}</li>"
        detailed_removals += "</ul>"

        # High-risk removals
        high_risk_html = "<h3>High-Risk Removals (Top Importance Features)</h3><p>These removals involve high-predictive features; review carefully.</p><ul>" if self.high_risk_removals else ""
        for f in self.high_risk_removals:
            high_risk_html += f"<li>{f}: {self.removal_reasons.get(f, '')}</li>"
        high_risk_html += "</ul>" if self.high_risk_removals else ""

        # Dynamic description
        pair_removal_desc = "for each high-correlation pair or near-perfect cluster, greedily remove lower-importance features (or higher VIF if no importance data), keeping the most valuable one per group to break redundancy."

        template_str = """
        <html>
        <head><title>Feature Correlation Analysis Report</title>
        <style>
            body { font-family: Arial, sans-serif; line-height: 1.6; }
            h1, h2 { color: #333; }
            table { border-collapse: collapse; width: 100%; }
            th, td { border: 1px solid #ddd; padding: 8px; text-align: left; }
            th { background-color: #f2f2f2; }
            ul { list-style-type: disc; padding-left: 20px; }
            img { max-width: 100%; height: auto; }
        </style>
        </head>
        <body>
        <h1>Feature Correlation Analysis Report</h1>
        <p>Generated on: {{ timestamp }}</p>
        <p>Input File: {{ input_path }}</p>
        <p>Correlation Method: {{ method }}</p>
        <p>Correlation Threshold: {{ threshold }}</p>
        <p>VIF Threshold: {{ vif_threshold }}</p>

        <h2>Report Overview</h2>
        <p>This report analyzes the correlations and multicollinearity among the features in your dataset, which consists of z-scored financial indicators for a large universe of stocks over one year. The goal is to identify redundant or problematic features that could impact your LightGBM-based stock investment strategy. By detecting high correlations and multicollinearity, we can suggest feature removals to simplify the model, reduce overfitting risk, and improve computational efficiency without significant loss of information.</p>

        <h2>Key Concepts Explained</h2>
        <p><strong>{{ method.capitalize() }} Correlation:</strong> This measures the strength and direction of the relationship between two features. Values range from -1 (perfect negative correlation) to 1 (perfect positive correlation), with 0 indicating no correlation. High absolute values (e.g., > {{ threshold }}) suggest redundancy, as one feature can largely predict the other. For your dataset, we used the {{ method }} method to compute pairwise correlations.</p>
        <p><strong>Variance Inflation Factor (VIF):</strong> VIF quantifies multicollinearity by showing how much a feature's variance is inflated due to its correlations with other features. It is calculated as 1 / (1 - R²), where R² is from regressing the feature on all others. A VIF > {{ vif_threshold }} indicates moderate multicollinearity, while >10 suggests severe issues, and inf means perfect linear dependence. High VIF can make model coefficients unstable, even in tree-based models like LightGBM.</p>

        <h2>Analysis Summary</h2>
        <ul>
            <li>Total Features Analyzed: {{ num_features }}</li>
            <li>High Correlation Pairs (|{method}| > {{ threshold }}): {{ num_pairs }}</li>
            <li>Suggested Feature Removals: {{ num_removals }} ({{ suggested_removals }})</li>
        </ul>

        <h2>How Recommendations Are Generated</h2>
        <p>Recommendations are based on a systematic approach to mitigate multicollinearity:</p>
        <ol>
            <li><strong>Identify Problematic Features:</strong> Compute the correlation matrix and flag pairs with absolute correlation above {{ threshold }}. Calculate VIF for each feature.</li>
            <li><strong>Prioritize Removals:</strong> Detect near-perfect correlation clusters (corr >= {{ perfect_threshold }}); per cluster, keep the highest-importance feature and remove others. Then, {{ pair_removal_desc }}</li>
            <li><strong>Fallback:</strong> If no issues are found, suggest removing the top 10% of features by average correlation to reduce dimensionality.</li>
            <li><strong>Validation Advice:</strong> After removals, retrain your LightGBM model and evaluate performance using cross-validation or out-of-sample testing. Consider domain knowledge (e.g., retain key financial indicators) or integrate feature importance from a preliminary LightGBM run to refine choices.</li>
        </ol>
        <p>This process ensures minimal information loss while addressing redundancy. Removing {{ num_removals }} features reduces dimensionality by approximately {{ reduction_pct }}%.</p>

        <h2>High Correlation Pairs</h2>
        {{ high_corr_table }}

        <h2>VIF Scores (inf indicates perfect multicollinearity)</h2>
        {{ vif_table }}

        <h2>Detailed Feature Removal Recommendations</h2>
        <p>Below is a one-by-one explanation for each suggested removal, including its VIF, key correlations, and rationale. These suggestions aim to eliminate redundancy while preserving predictive power.</p>
        {{ detailed_removals }}
        {{ high_risk_html }}

        <h2>Visualizations</h2>
        <p>The heatmap focuses on features involved in high correlations for clarity. The VIF plot shows the top 20 scores.</p>
        <img src="correlation_heatmap.png" alt="Clustered Correlation Heatmap">
        <img src="vif_barplot.png" alt="Top VIF Scores Plot">

        <h2>Next Steps</h2>
        <p>Implement the suggested removals in your dataset and retrain your LightGBM model. Monitor metrics like AUC, Sharpe ratio, or backtest performance for your stock strategy. If needed, run this analysis periodically as your feature set evolves. For further customization, integrate LightGBM feature importances to prioritize retention of high-value features.</p>
        </body>
        </html>
        """
        template = Template(template_str)
        report_html = template.render(
            timestamp=timestamp,
            input_path=self.input_path,
            method=self.correlation_method,
            threshold=self.corr_threshold,
            vif_threshold=self.vif_threshold,
            perfect_threshold=self.perfect_corr_threshold,
            num_features=len(self.features),
            num_pairs=len(self.high_corr_pairs),
            num_removals=len(self.suggested_removals),
            suggested_removals=', '.join(self.suggested_removals),
            reduction_pct=round(100 * len(self.suggested_removals) / len(self.features), 1) if self.features else 0,
            high_corr_table=high_corr_df.to_html(index=False),
            vif_table=self.vif_df.to_html(index=False) if self.vif_df is not None else "<p>VIF not computed.</p>",
            detailed_removals=detailed_removals,
            high_risk_html=high_risk_html,
            pair_removal_desc=pair_removal_desc
        )

        report_path = os.path.join(self.output_dir, 'report.html')
        with open(report_path, 'w') as f:
            f.write(report_html)
        logger.info(f"Generated enhanced report at {report_path}")

    def run_analysis(self) -> None:
        """Run the full analysis pipeline."""
        self.load_data()
        self.load_coefficients()
        self.compute_correlations()
        self.compute_vif()
        self.suggest_removals()
        self.visualize()
        self.generate_report()

def main():
    parser = argparse.ArgumentParser(description="Professional Feature Correlation Analyzer for Stock Data")
    parser.add_argument('--input', type=str, required=True, help='Path to input CSV file')
    parser.add_argument('--coefficients', type=str, default=None, help='Path to CSV with feature coefficients (optional)')
    parser.add_argument('--method', type=str, default='pearson', choices=['pearson', 'spearman', 'kendall'], help='Correlation method')
    parser.add_argument('--threshold', type=float, default=0.7, help='Correlation threshold for flagging')
    parser.add_argument('--vif_threshold', type=float, default=5.0, help='VIF threshold for flagging')
    parser.add_argument('--perfect_threshold', type=float, default=0.999, help='Near-perfect correlation threshold for clustering')
    parser.add_argument('--output_dir', type=str, default='results', help='Output directory')
    
    args = parser.parse_args()
    
    analyzer = FeatureCorrelationAnalyzer(
        input_path=args.input,
        coefficients_path=args.coefficients,
        correlation_method=args.method,
        corr_threshold=args.threshold,
        vif_threshold=args.vif_threshold,
        perfect_corr_threshold=args.perfect_threshold,
        output_dir=args.output_dir
    )
    analyzer.run_analysis()

if __name__ == '__main__':
    main()
type or paste code here
1 Like

Unrelated question. How is ATRN calculated at P123? It has a strangley high (inverse)correlation with momentum factors.

1 Like

Is it not just ATR divided by price? Makes sense for momentum/“hot stocks” to do badly or be interrupted by crashes. This is part of why a lot of users are so worried about hedges. What other interesting things are you seeing? Would be interesting to see all the negative correlations.

Thanks for sharing!

Interesting that Grok gave you an object-oriented version. I think it might be easier for you to follow it if you ask it for an "imperative only version."

Using VIF is pretty classic, I think you're safe with that.

Noticed that it possible to use importance_type GAIN instead of standard SPLIT. This will give you the total gains of splits which use the feature in the Importance result after prediction training.
Standard is SPLIT wich gives you numbers of times the feature is used in a model.

Add - "importance_type":"gain" - to your model.

It will give you some extra insight of the importance of your features.

1 Like