That is the title of the latest book by Wesley Gray and Jack Vogel, of Alpha Architect. A nice review of the momentum field.
Of particular interest is their introduction of the hypothesis that the “path” a stock takes to gain momentum is critical to the return. Is it “smooth” (or continuous) or jerky (discrete). In short, the momentum stocks with more of a smooth path over the past 12 months perform far better than those with a discrete history. (Smooth stocks perform better because of the behavioral “frog in the pan” reaction of investors).
ID=sign(past 12 months return) *[% of negative days - % of positive days]
A stock with positive momentum and a large number of positive days will have a negative ID; vice versa for stocks having a large number of negative days.
So, to do this calculation on P123, we need to know that % of negative and positive days during the test period (12 months in this example).
For % of +ve day, I think this should work;
100*((LoopSum("Close(CTR)>Close(CTR+1)",100)+ LoopSum("Close(CTR)>Close(CTR+1)",100,100)+ LoopSum("Close(CTR)>Close(CTR+1)",52,200))/252)
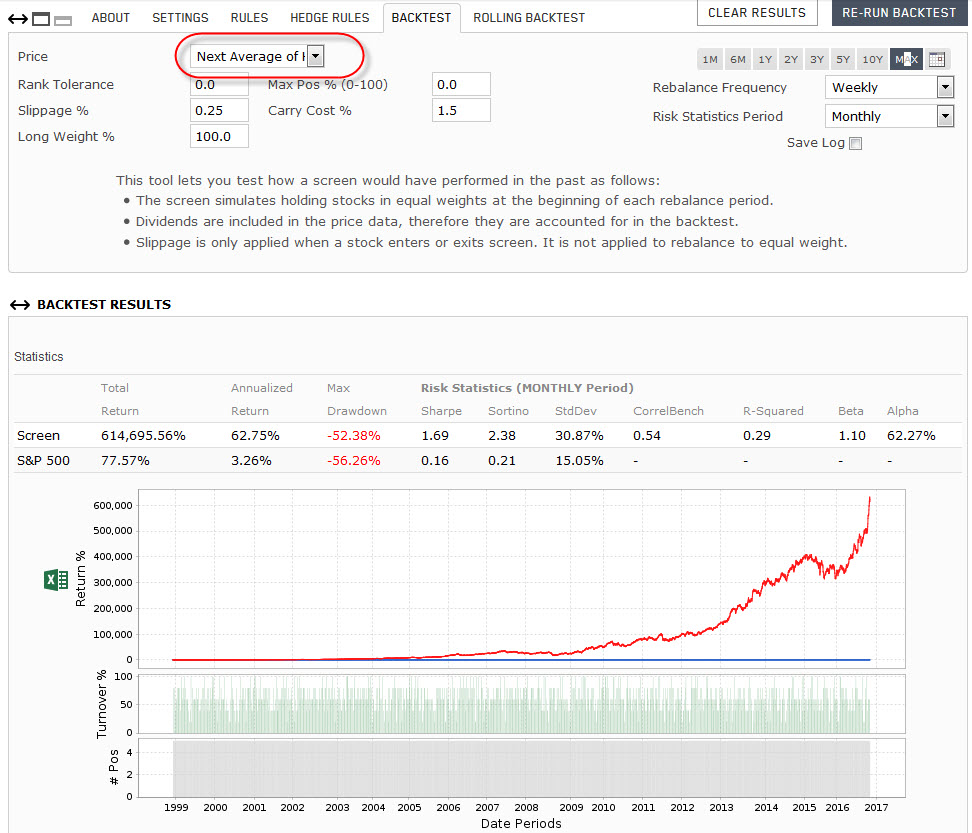
I created a public ranking system “quantitative momentum” with the a 50%/50% weight on price performance and path-smoothiniess. The book states that you should first rank according to the 12 month price performance, then take the best 100 stocks and rank those according to the smoothness of the path. I did not know how to do this in P123, so this maybe this might be a factor, which makes this more successful.
The effect does not seem to exist the last 5 years, it had a negative Alpha. This was also mentioned in the book, although they state if you equal-weight the portfolio of 50 (rebalancing every 3 month) you should get a positive Alpha in this time period as well. I was not able to achieve that. A backtest from 1999 confirmed that over the very long run the effect exists / existed.
My take: the screener / ranking system by itself does not help much. But I noticed in other successful ranking systems, that the effect of the last month performance is negative correlated to its future success (reverse engineer shows also that this factor is more valuable). This might be something to consider in the future.
The formula for the ID is (in my opinion):
((Close(21)/Close(273)-1) / Abs((Close(21)/Close(273)-1)))*(((LoopSum(“Close(CTR)<Close(CTR+1)”,100,21)+ LoopSum(“Close(CTR)<Close(CTR+1)”,100,121)+ LoopSum(“Close(CTR)<Close(CTR+1)”,31,221))/231) - ((LoopSum(“Close(CTR)>Close(CTR+1)”,100,21)+ LoopSum(“Close(CTR)>Close(CTR+1)”,100,121)+ LoopSum(“Close(CTR)>Close(CTR+1)”,31,221))/231))
The first part is the sign(12 month return). What is meant by sign is that one must only take the “-” or “+” of the 12 month return. I had to get back to the article to understand what they meant by this
Let me know if somebody finds something interesting.
I would not rely too much on such observations. Like many other technical approaches, this one might have worked for a given time or market circumstance. Most importantly you need to combine momentum with other factors, otherwise you will not get a great screener result.
I’m fond of combining high(er) momentum with low(er) volatility. To do that I usually use the quality minus junk strategy. For a buy rule that would look like;
FRank("atrn(20,0)",#All,#Asc)>15
Combining momentum with other technical and fundamental factors does seem to work. Soon you will be building high annalized return models. The real trick after that is getting decent average return per trade.