Instead of the graph showing just one value - Average Return for the bucket - for it to show Average Return plus the St.Deviation x1 and x2 intervals and maybe Min and Max.
View the feature request here.
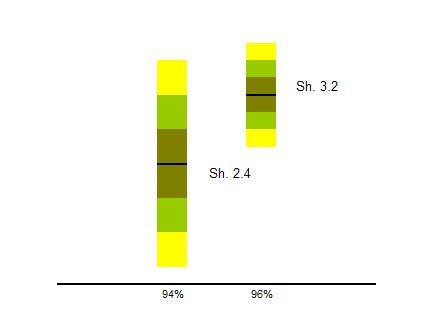
We can also show a Sharpe reading next to the bar. All of this will show us whether the return indicated in this bucket is from concentrated and therefore more predictive results or distributed ,very random results.
Excellent idea, but I’d also like to see a full drill-down capability (this Feature Request ). Perhaps the two should be combined?
On a related topic, I’ve always considered the display of 100 or 200 (equally sized) buckets to be worse than a waste of bandwidth. Does anybody really care about the 77th or 43rd percentile? I’d like to see a display with unequal buckets, with most detail at the top end. I’ve made this a new feature request here .
I actually find the display of all buckets quite useful.
Though we are only interested to invest in the high ranks, to me a good ranking system should demonstrate a good discrimination. That is - higher rank buckets should clearly have greater returns. Mathematically said the return vs. percentile rank function should be monotonic. Don’t forget the ranking systems performance graph includes all the stocks it was tested on. So if I see the lower, especially the lowest, percentile buckets having lower or negative returns that means a decreased probability of the dogs ending up in my high ranked investment choices.
So an ideal ranking systems should have very high return of the higher percentile buckets and the steeper the slope down the lower buckets is, the better. I would also like to see negative returns on the left end.
I notice most of the ranking systems that produce good sims on P123 have that discriminating property/quality.
As per my approach to further studying the systems. If I see a system that has a well demonstrated discrimination I go further on to increase the number of buckets and check whether the monotonic discrimination is present in the smaller buckets. If that is true I pay attention to this system a lot.
A very nice system that I see now, I first saw in one of Denny’s sims, is BJS Mo Value. Who started it? It is very good. Denny did you start this one?
Vlad, I agree completely, and that’s why I suggested a full range of buckets, but with different sizes: (lower limits shown)
99.9, 99.8, 99.5
99, 98, 97, 96, 95,
90, 80, 70, 60, 50, 40, 30, 20, 10, 5, 2, 1, 0
Denny’s idea to speciy a range of buckets would also work, but with a little more user input required. I’m lazy, and would like the above set to be the default.
In any case I would like to see some options rather than a hard-coded scheme. I personally am relatively happy with the bucket structure now.
I am not sure making the buckets size different will reduce demand for processing power in the servers since you still have to calculate the retunrs of all the stock you just have to put them in the differently sized buckets.
The credit for one of the best public Ranking Systems, BJS Mo Value, goes to Brian Schumacher (traderblues). All I did was help develop some good Sims. One of which has 96% annual gain with an 18% max drawdown with only a 7% loss over the last few weeks. You can view it here: Denny’s BJS Mo Value 5stk a4b9s8, http://www.portfolio123.com/port_summary.jsp?portid=95297
Regarding BJS Mo-Value, I have to pass a lot of the credit on to Dan (Parquette) for providing the tools. I used his single-factor performance graphs he posted on the forum a few months ago to come up with this system. With this system, I am in an 8% drawdown right now. Compare this to my present 23% drawdown using BJS Small Cap GARP (ouch). I am feeling a lot better about things today, though.
[quote]
(Vlad) I would like to see some options rather than a hard-coded scheme. I personally am relatively happy with the bucket structure now.
[/quote] No problem. I’m just suggesting this schema as the default (rather than the current 20 equal buckets).
[quote]
(Vlad)I am not sure making the buckets size different will reduce demand for processing power in the servers since you still have to calculate the retunrs of all the stock you just have to put them in the differently sized buckets.
[/quote] Probably true, but I think this would eliminate the need for multiple runs. Would also make printouts easier to read.
Final argument: How else are you going to look at the 99.8 & 99.9 buckets?
I find your idea of having a way to see the top 99.8 99.9 buckets very viable. and now when I think of it I agree that in that case, when you are concentrated in that area of the graph it woudl be nice to say, ok show me, let’s say, 96% to 100% by 0.1%. So may be one why of having the whole thing done is have the Percentile Ragne as a parameter with defaults of 0% to 100%. And by the number of buckts one can still slice that range in how eve many they want.
At times I have run the performance tests monthly or annually and gotten the standard deviation from a spread sheet after downloading all of these. Thankful that I could do this but not ideal.